Chapter 13 Venn Diagram Module
This module in xOmicsShiny helps users identify DEGs/DEPs/DEMs that are common or unique to different comparisons within one project. Users have the option to either visualize these DEGs/DEPs/DEMs as a highly customizable Venn Diagram (5 or less groups) or UpSets plot, or download a table with the gene/protein/metabolites names/IDs.
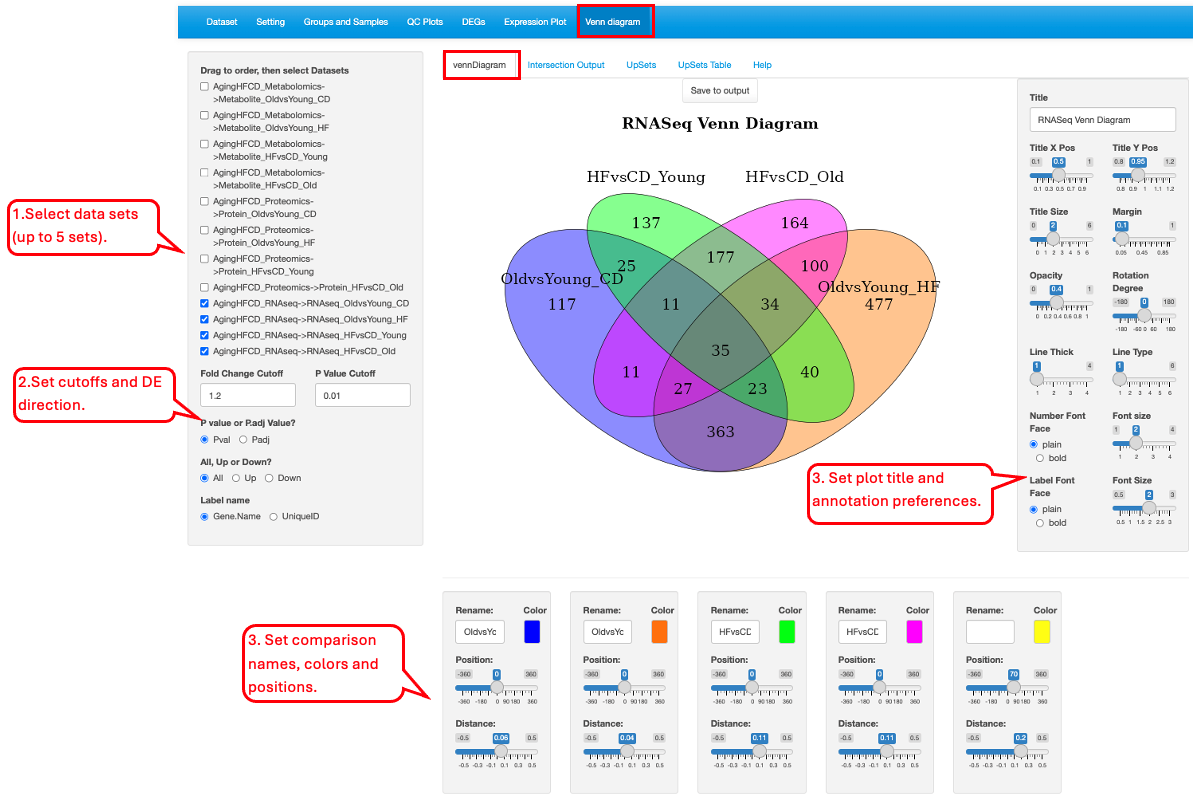
13.1 Venn Diagram
To view the DEGs/DEPs/DEMs as a Venn Diagram, users have the option to see the intersection of DEGs/DEPs/DEMs for up to 5 different comparisons. Users can also use all DEGs/DEPs/DEMs or restrict it to the ones that are Up or Down regulated.
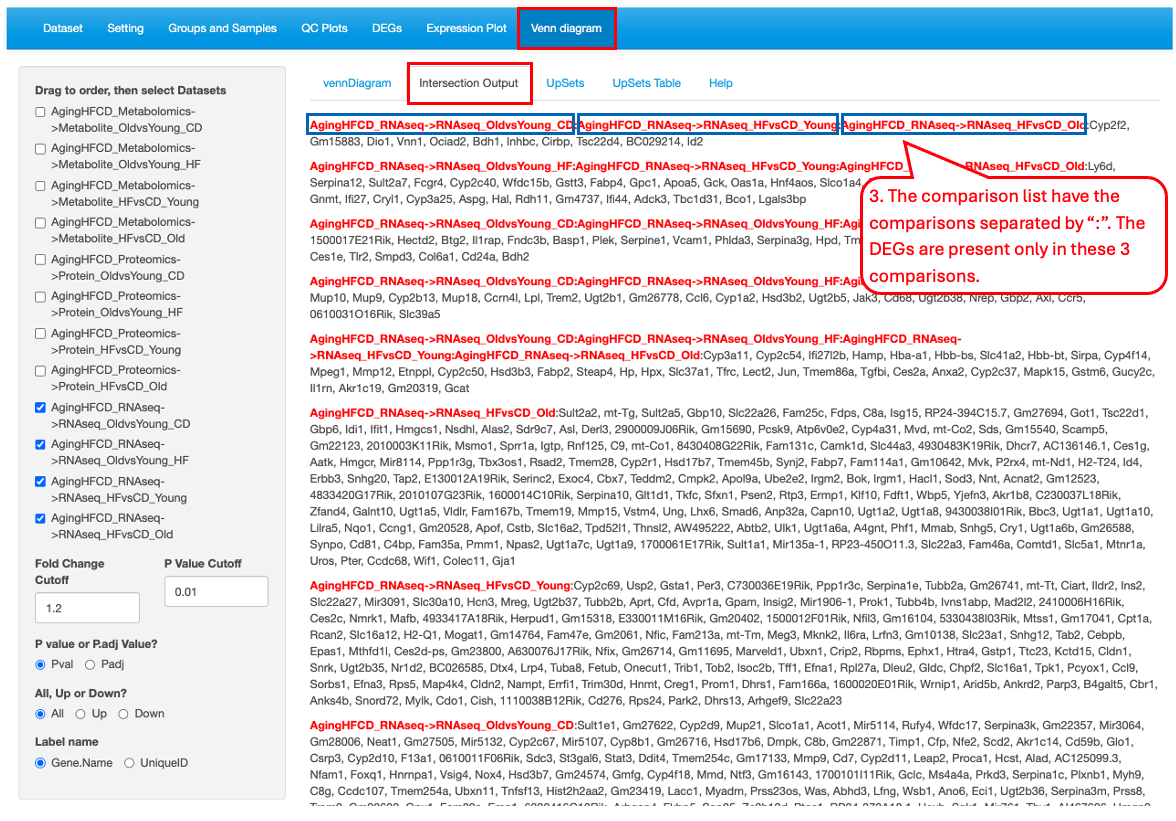
13.2 Intersection Output
This tab lets the User view the individual genes that were present in the Venn Diagram and the distribution of the genes in intersection regions.
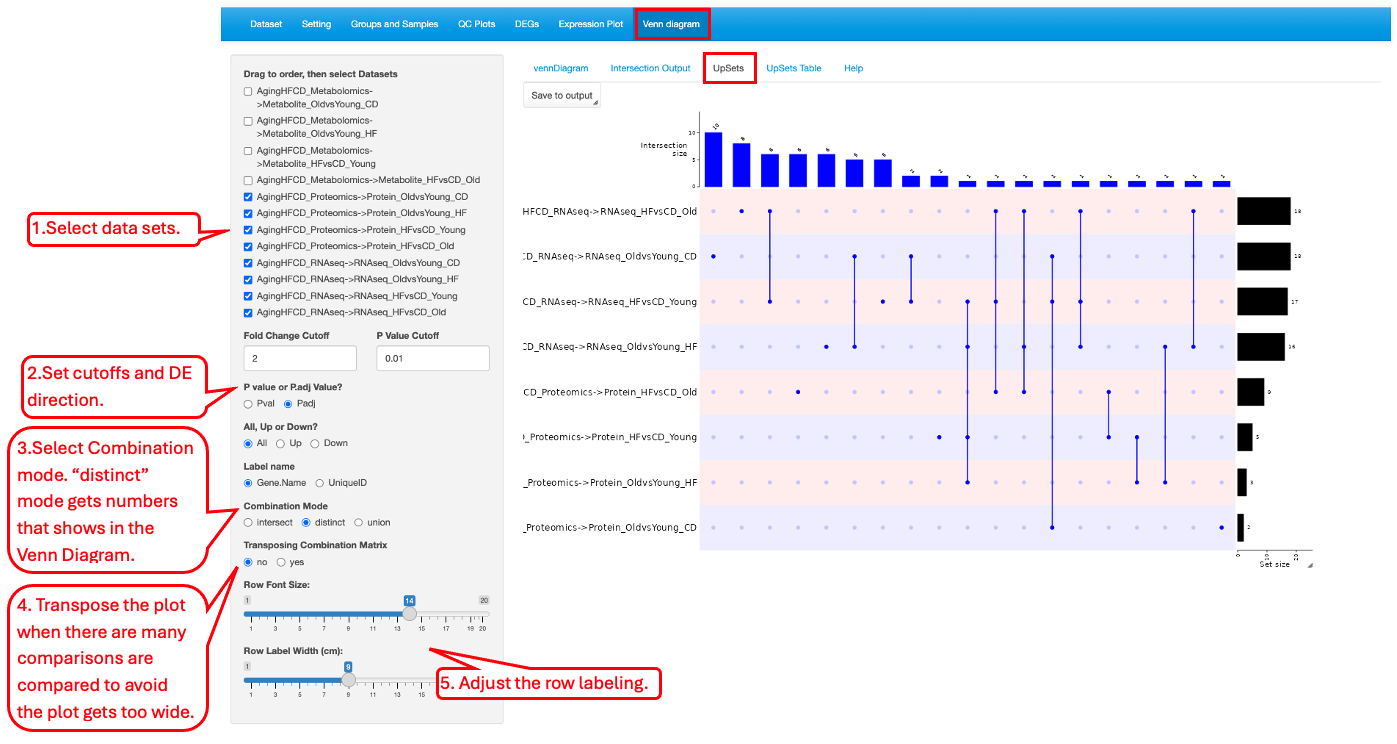
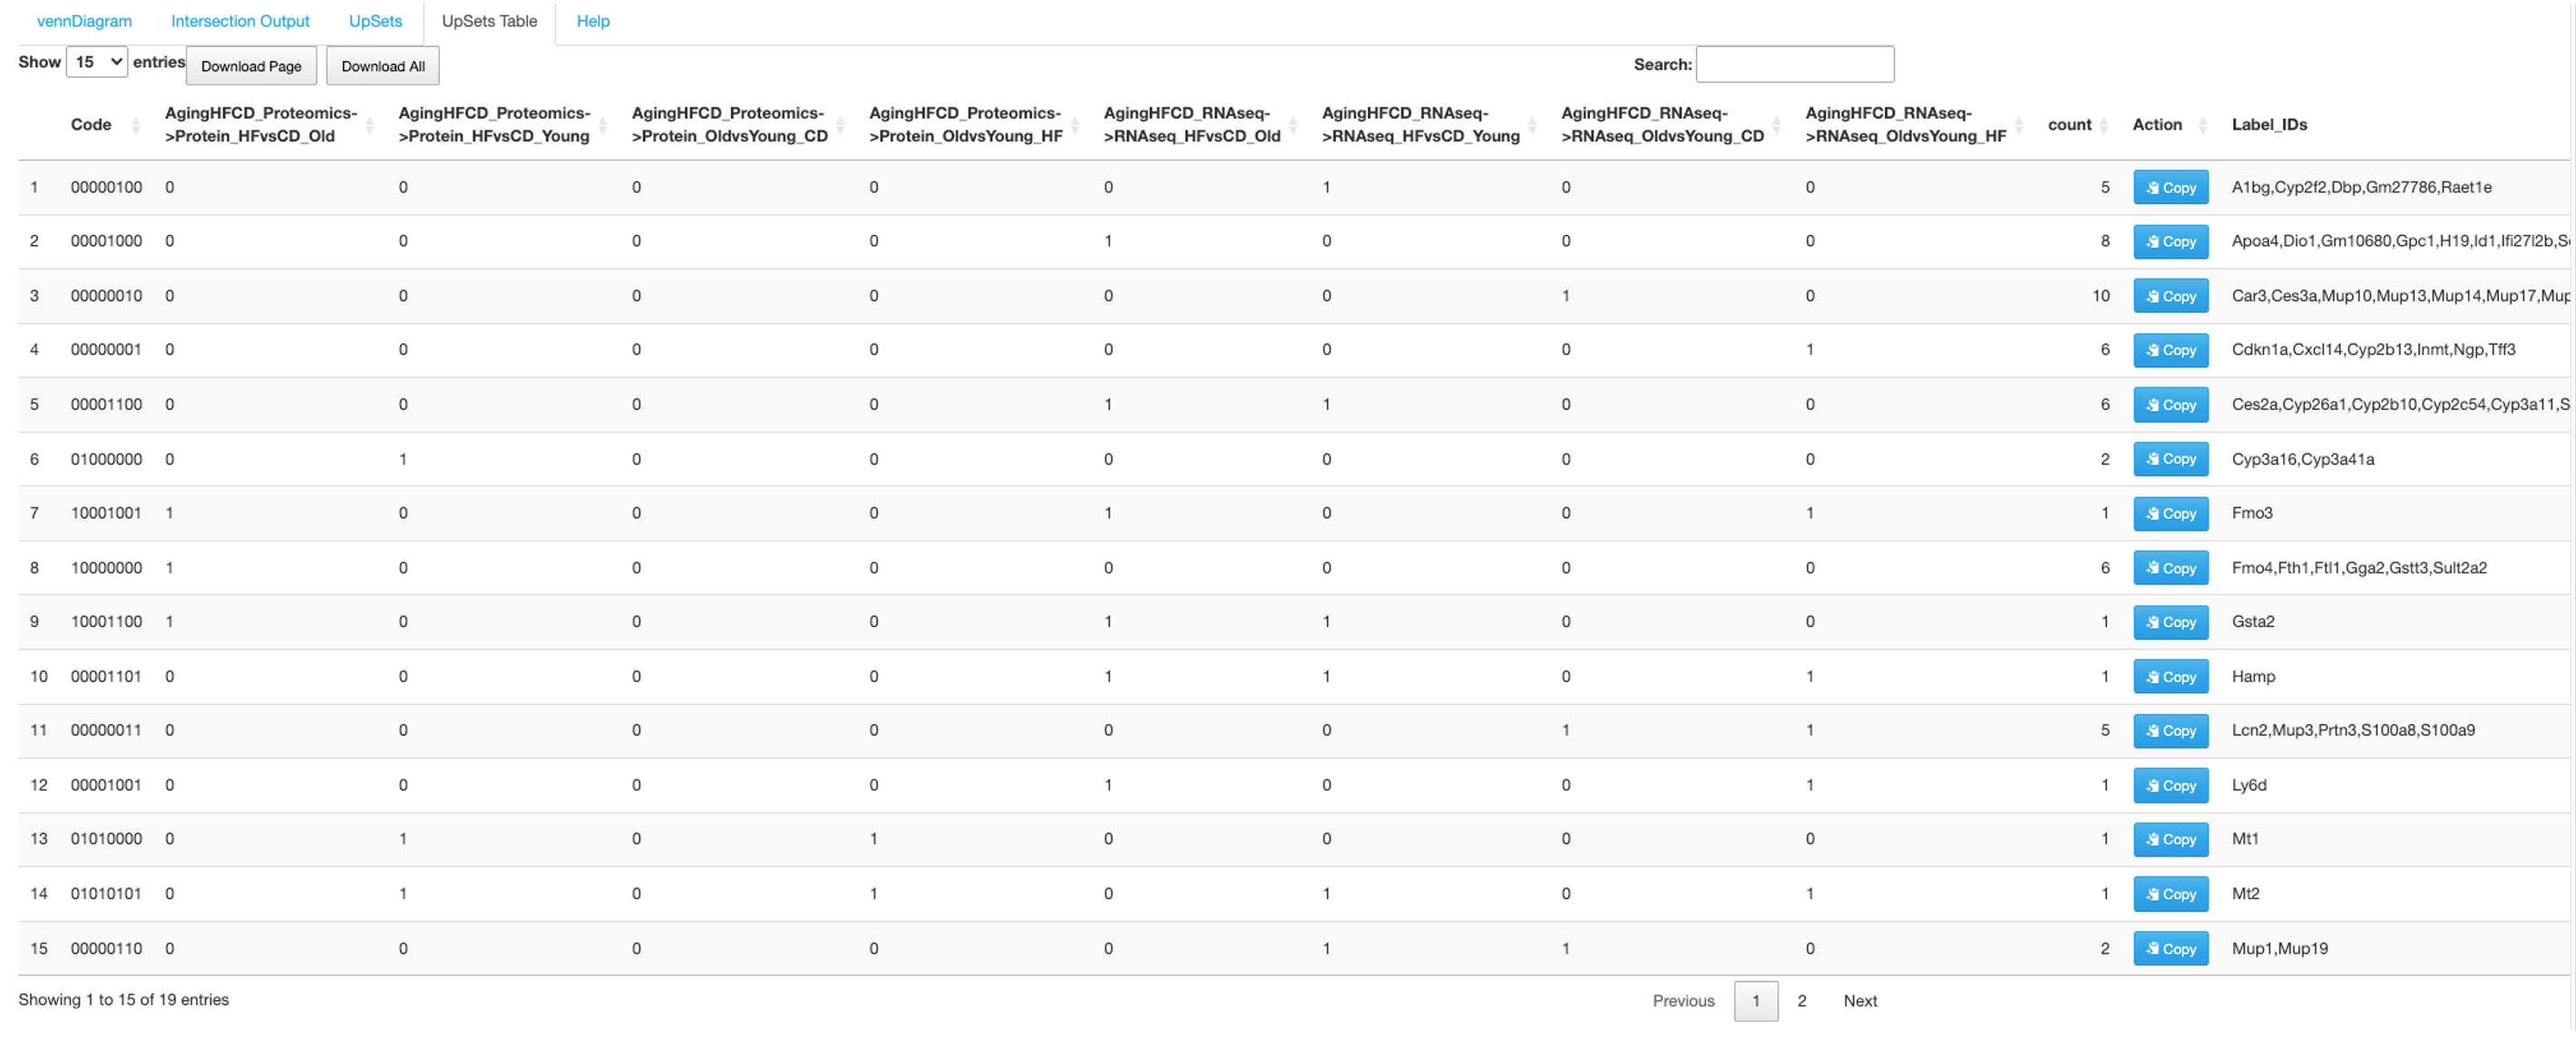
13.3 UpSets
When there are many comparisons, UpSets plot is often used to show the grouping combinations. The dots and dot connected lines indicates the group combination and the bar plot shows the numbers of each combination. There are 3 combination modes available to make the plot: intersect, distinct and union. The distinct mode produces the result that are equivalent to the numbers in the Venn Diagram.