Chapter 16 Time Course Module
This module enable users to visualize the dose-response/time-course data. The method is derived from the DRomics R package. Gauss-probit, log-Gauss-probit, Hill, log-probit, exponential, linear regressions are checked during the fitting process.
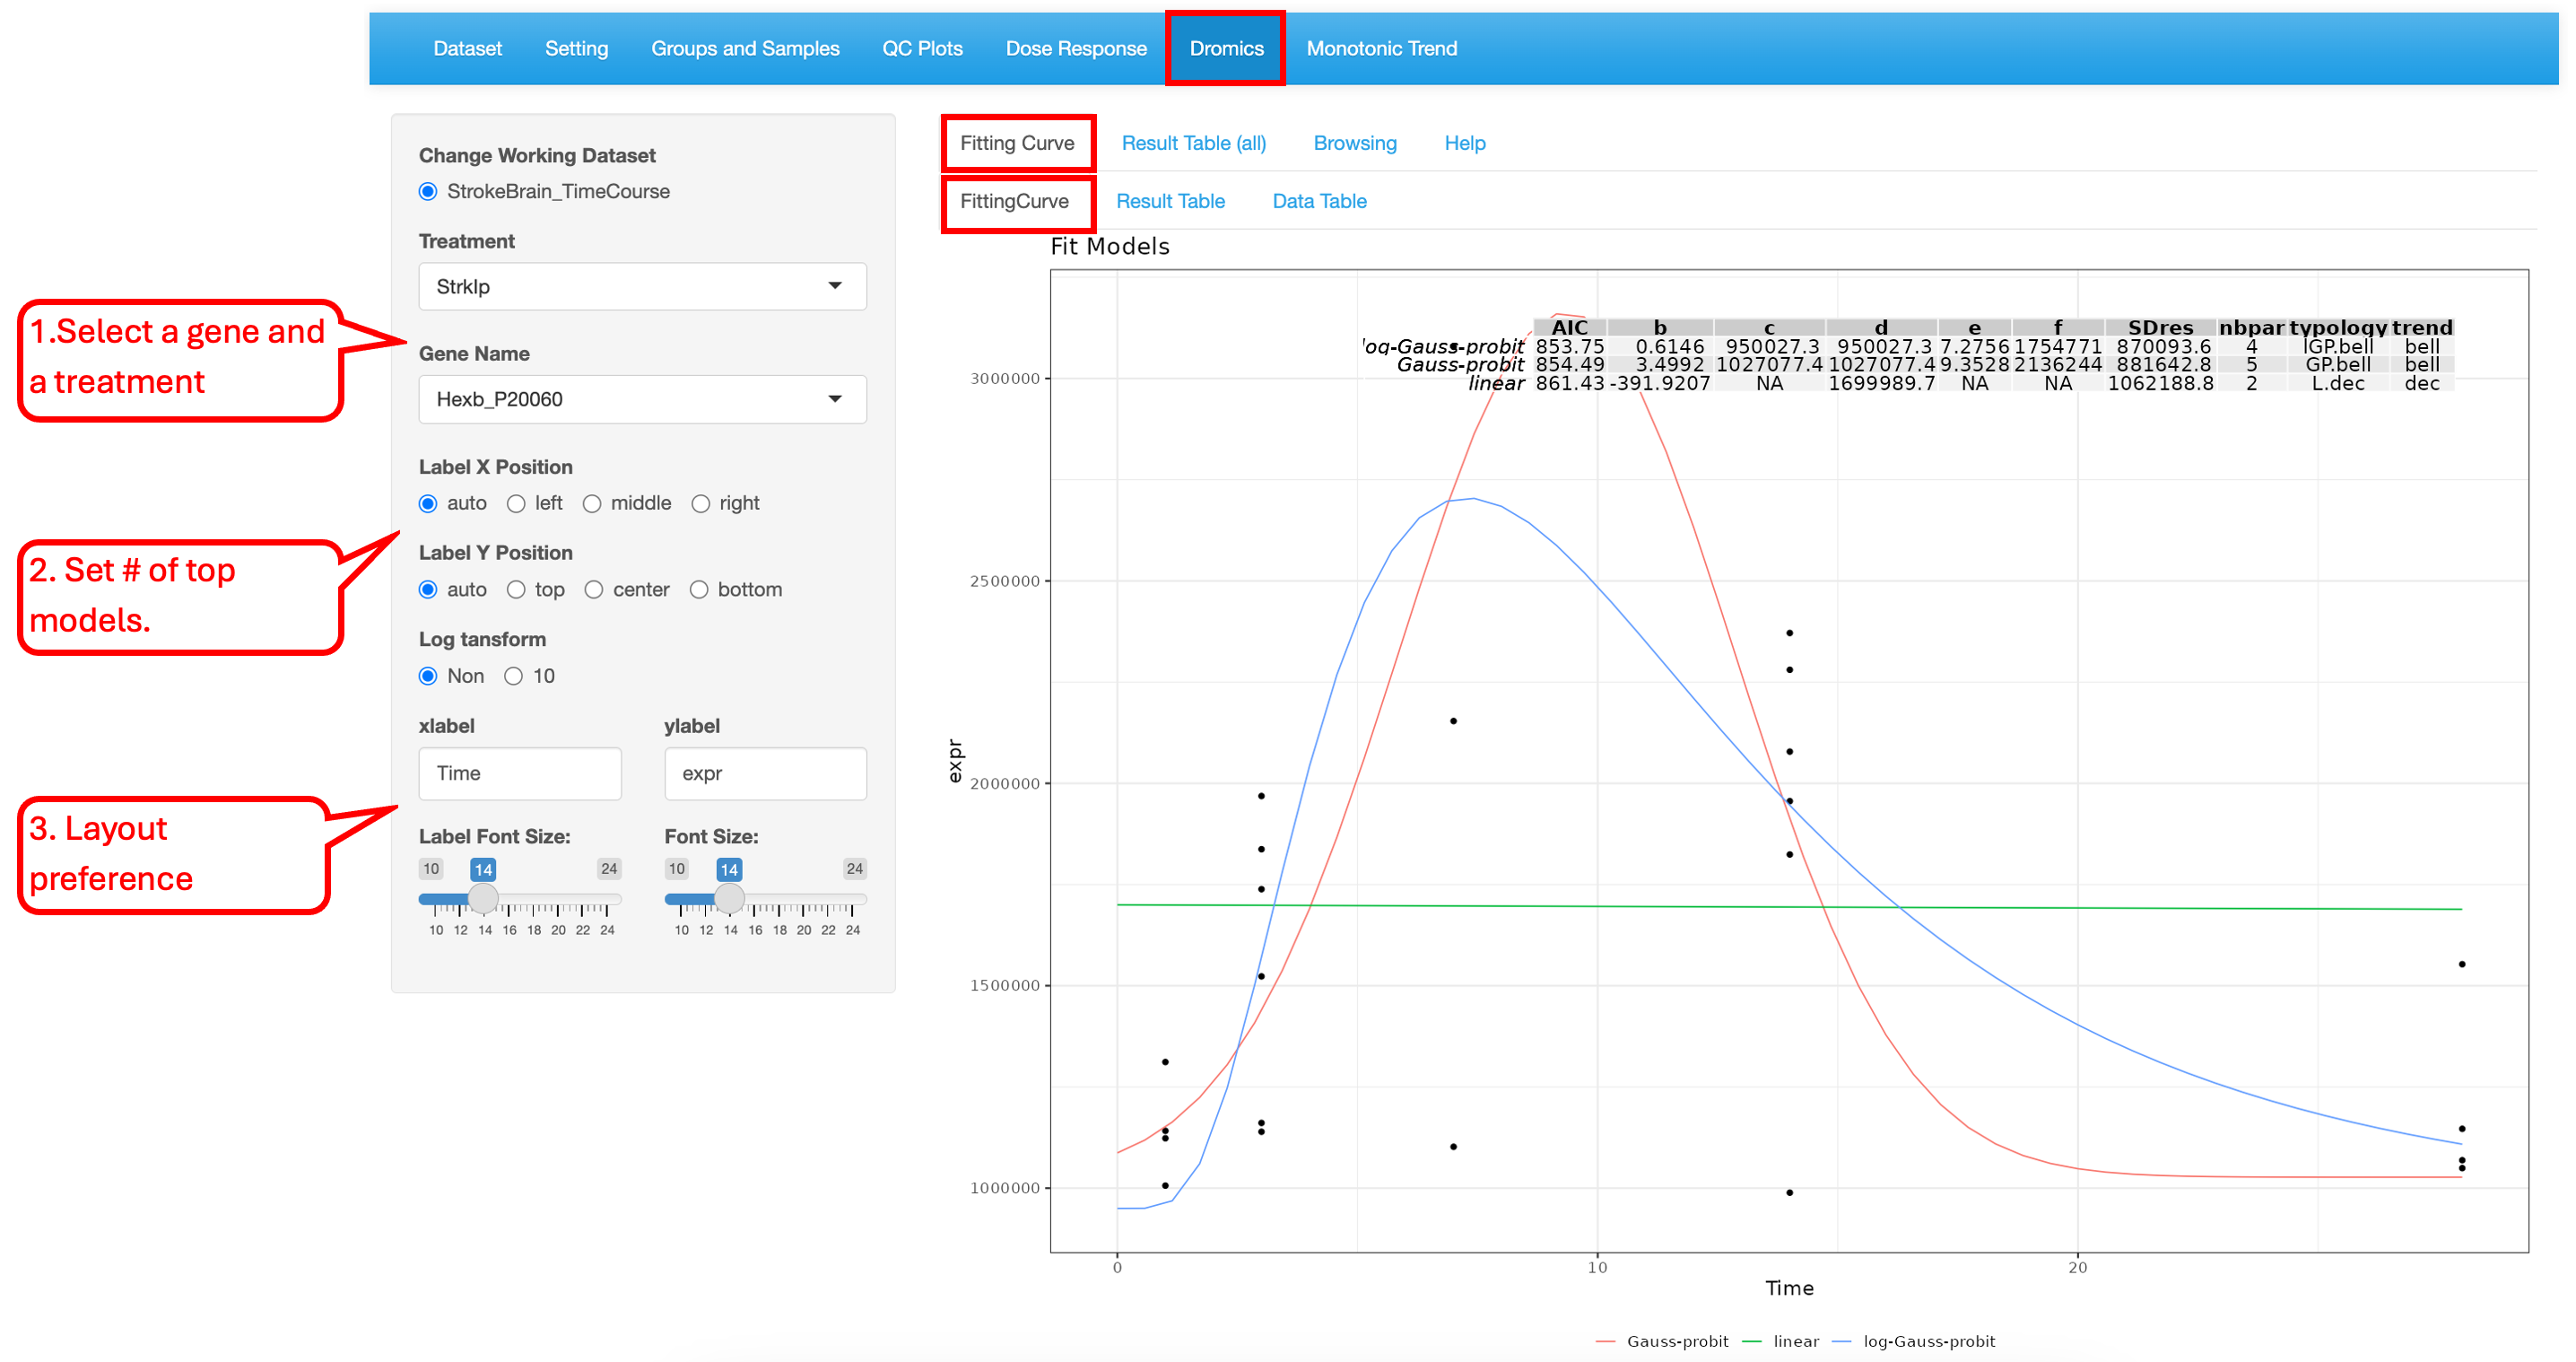
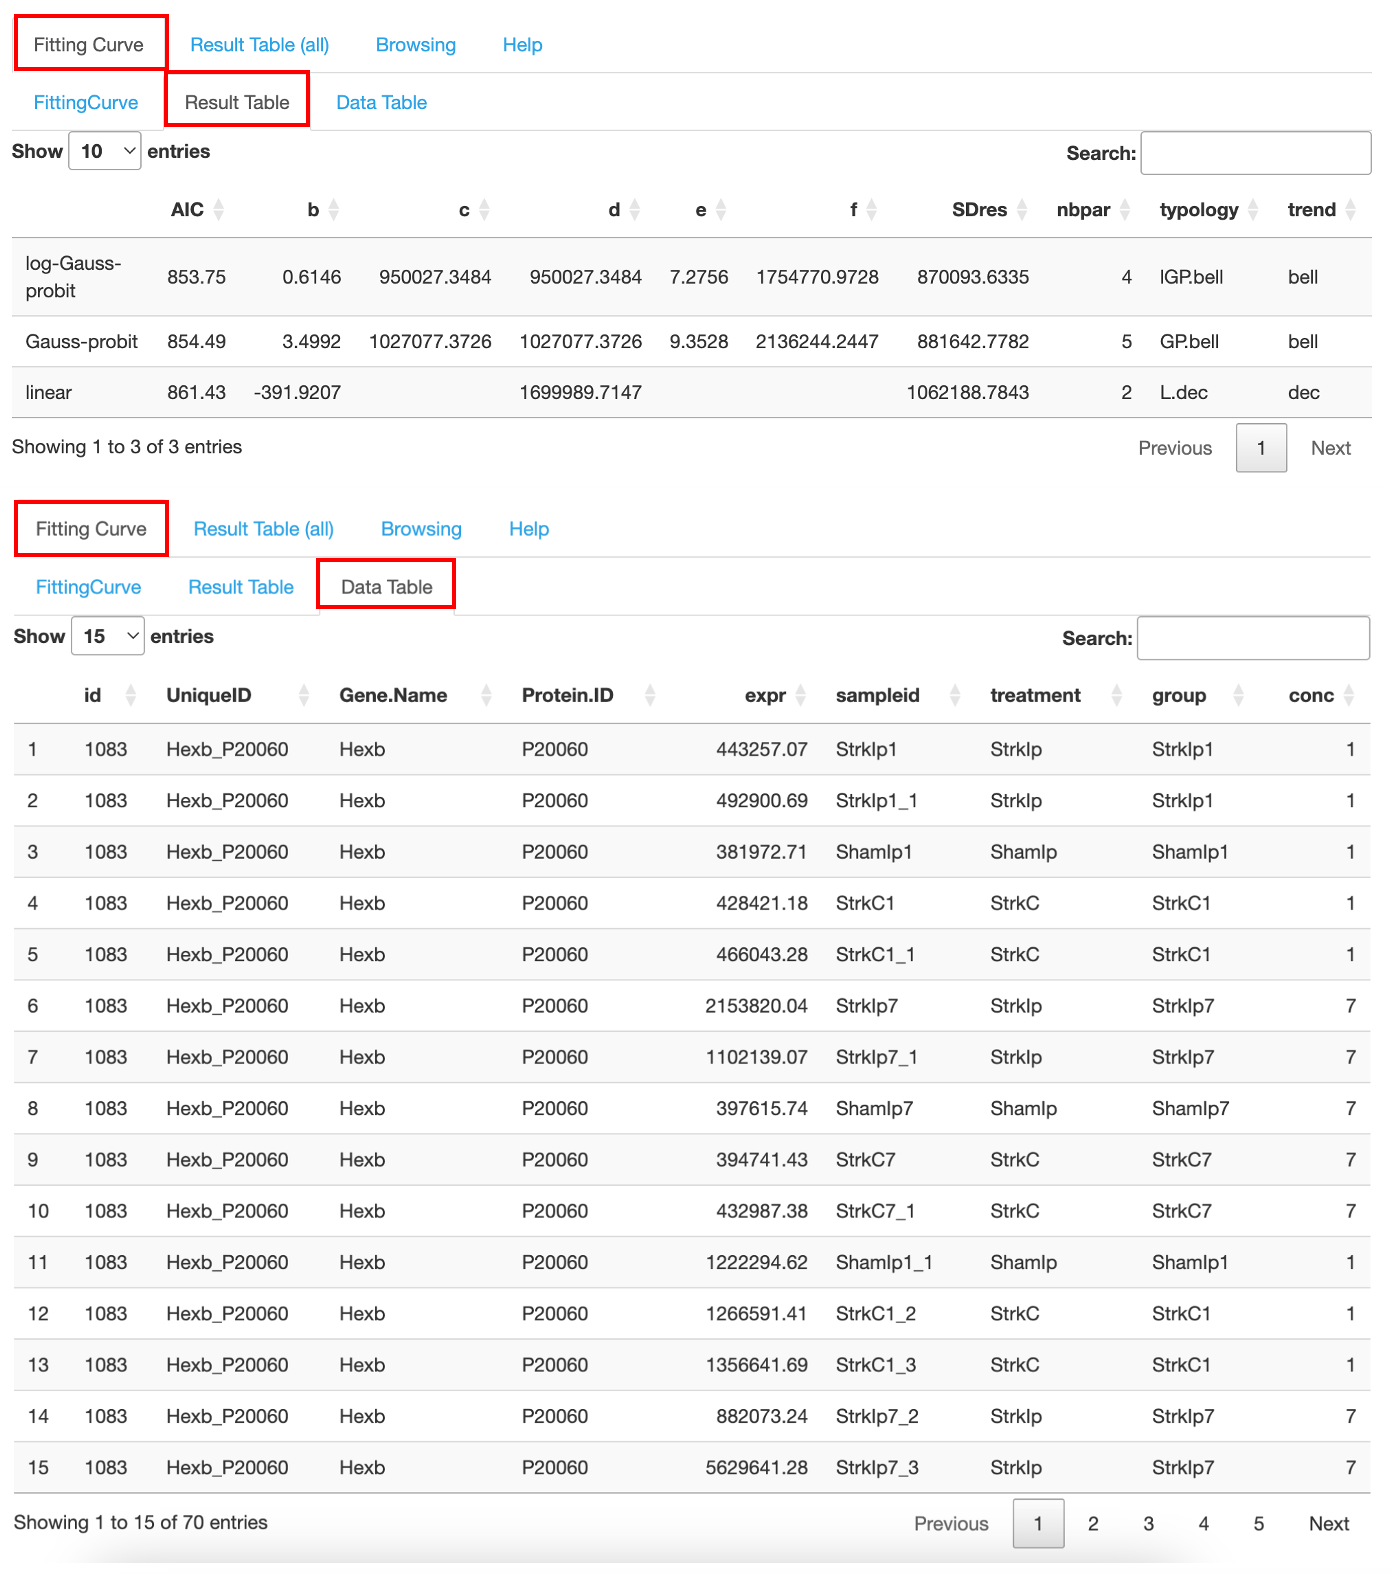
16.1 Fitting Curve
This functionality allows user to make dose-response/time-course plot for individual genes. It contains 3 sub-tabs.
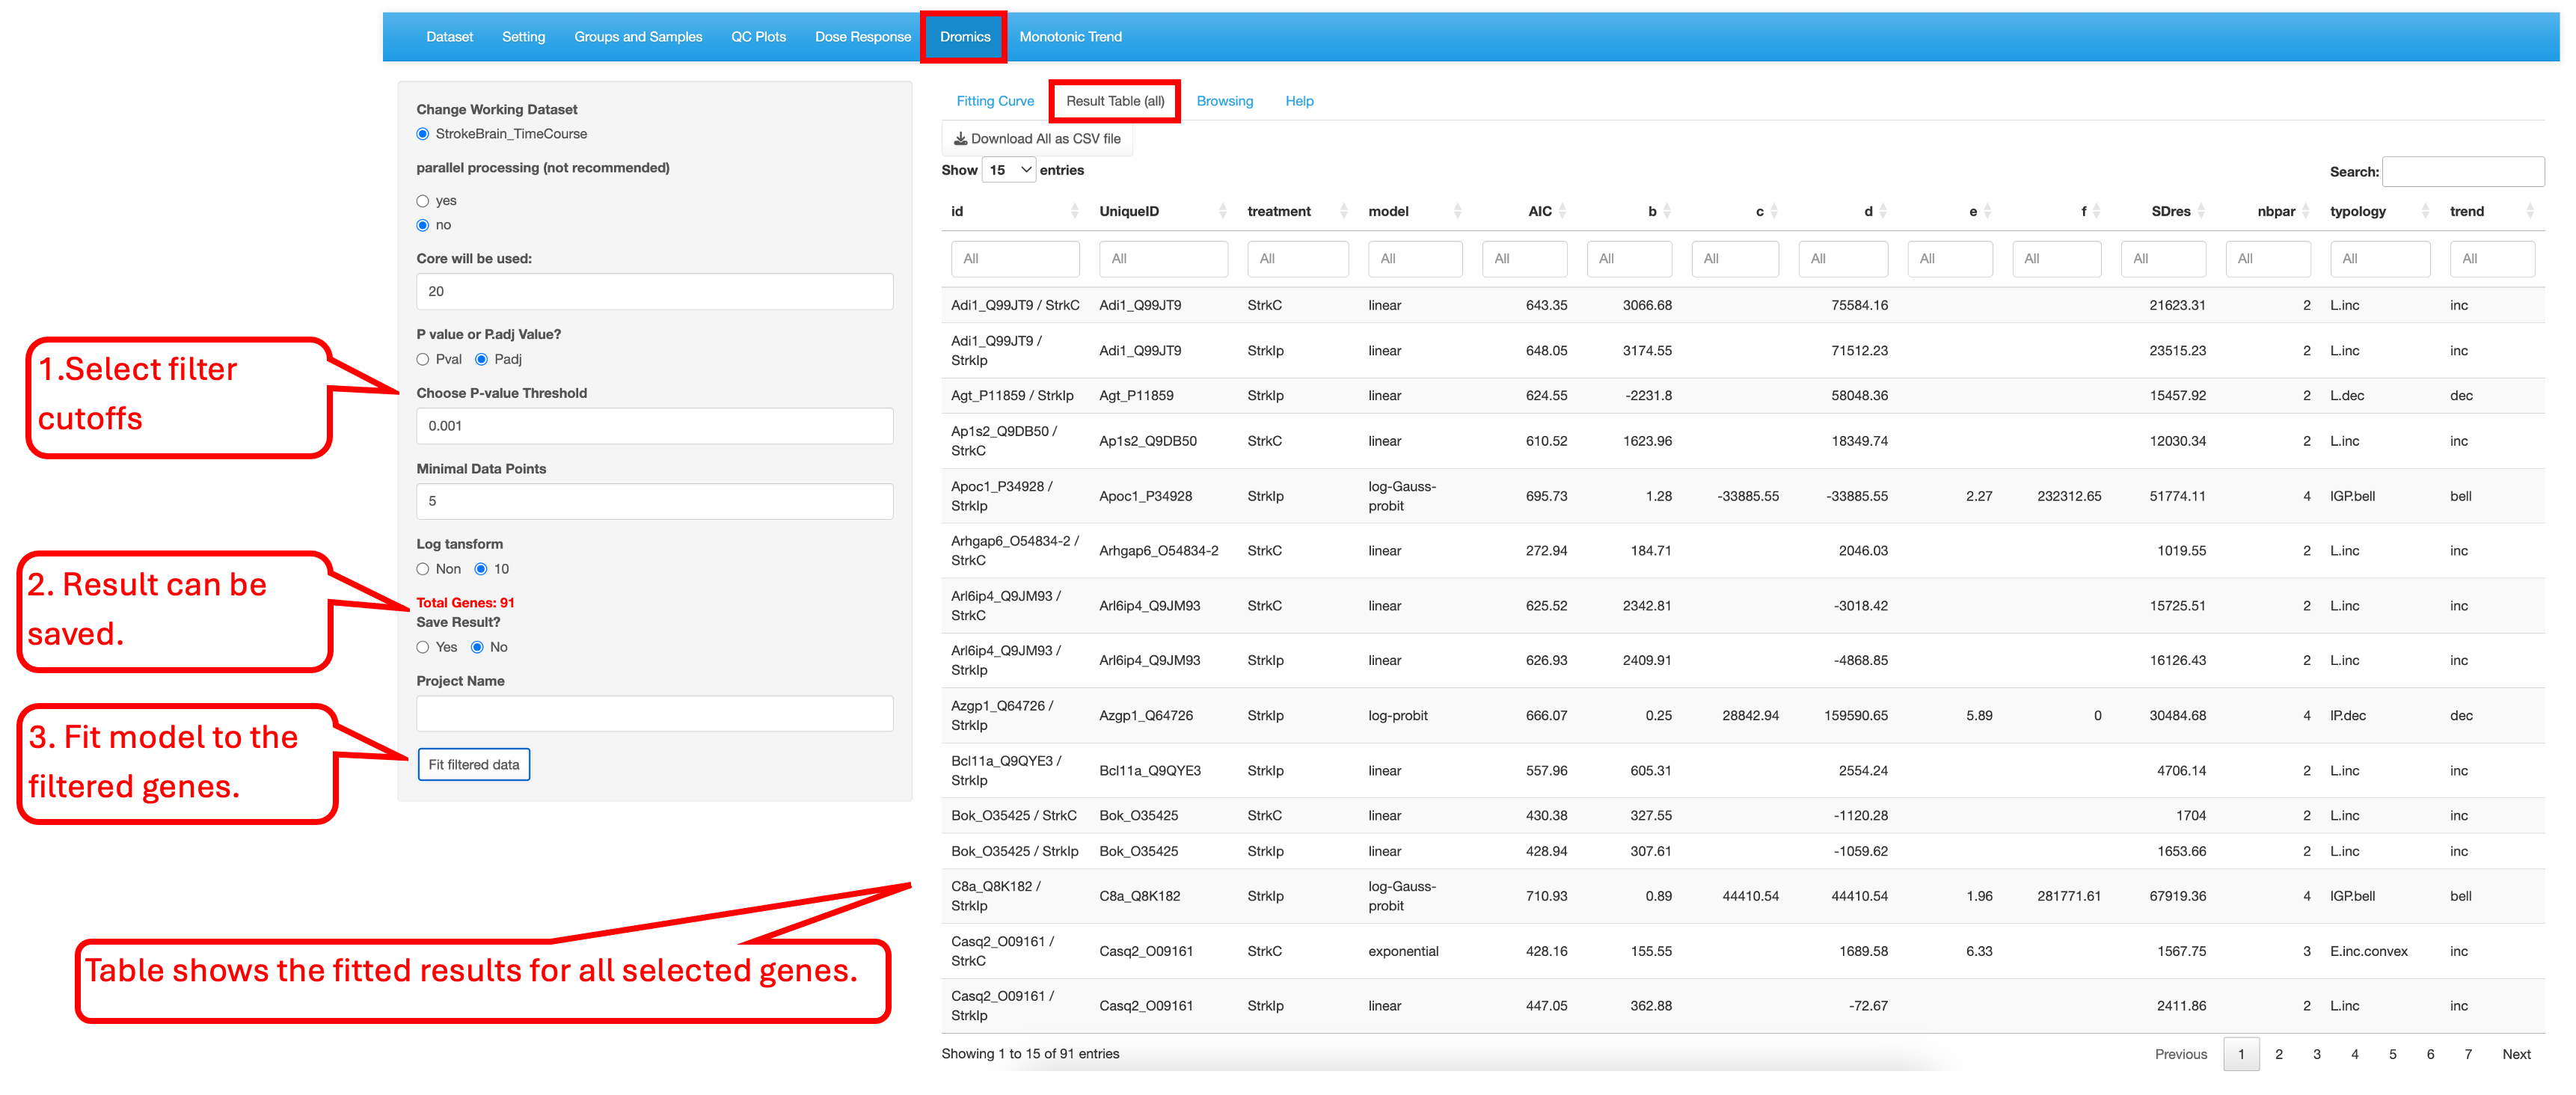
16.2 Result Table (all)
This tab shows the fitted results in a searchable table for all the genes. User can apply filter condition to view the results for the filtered genes only.
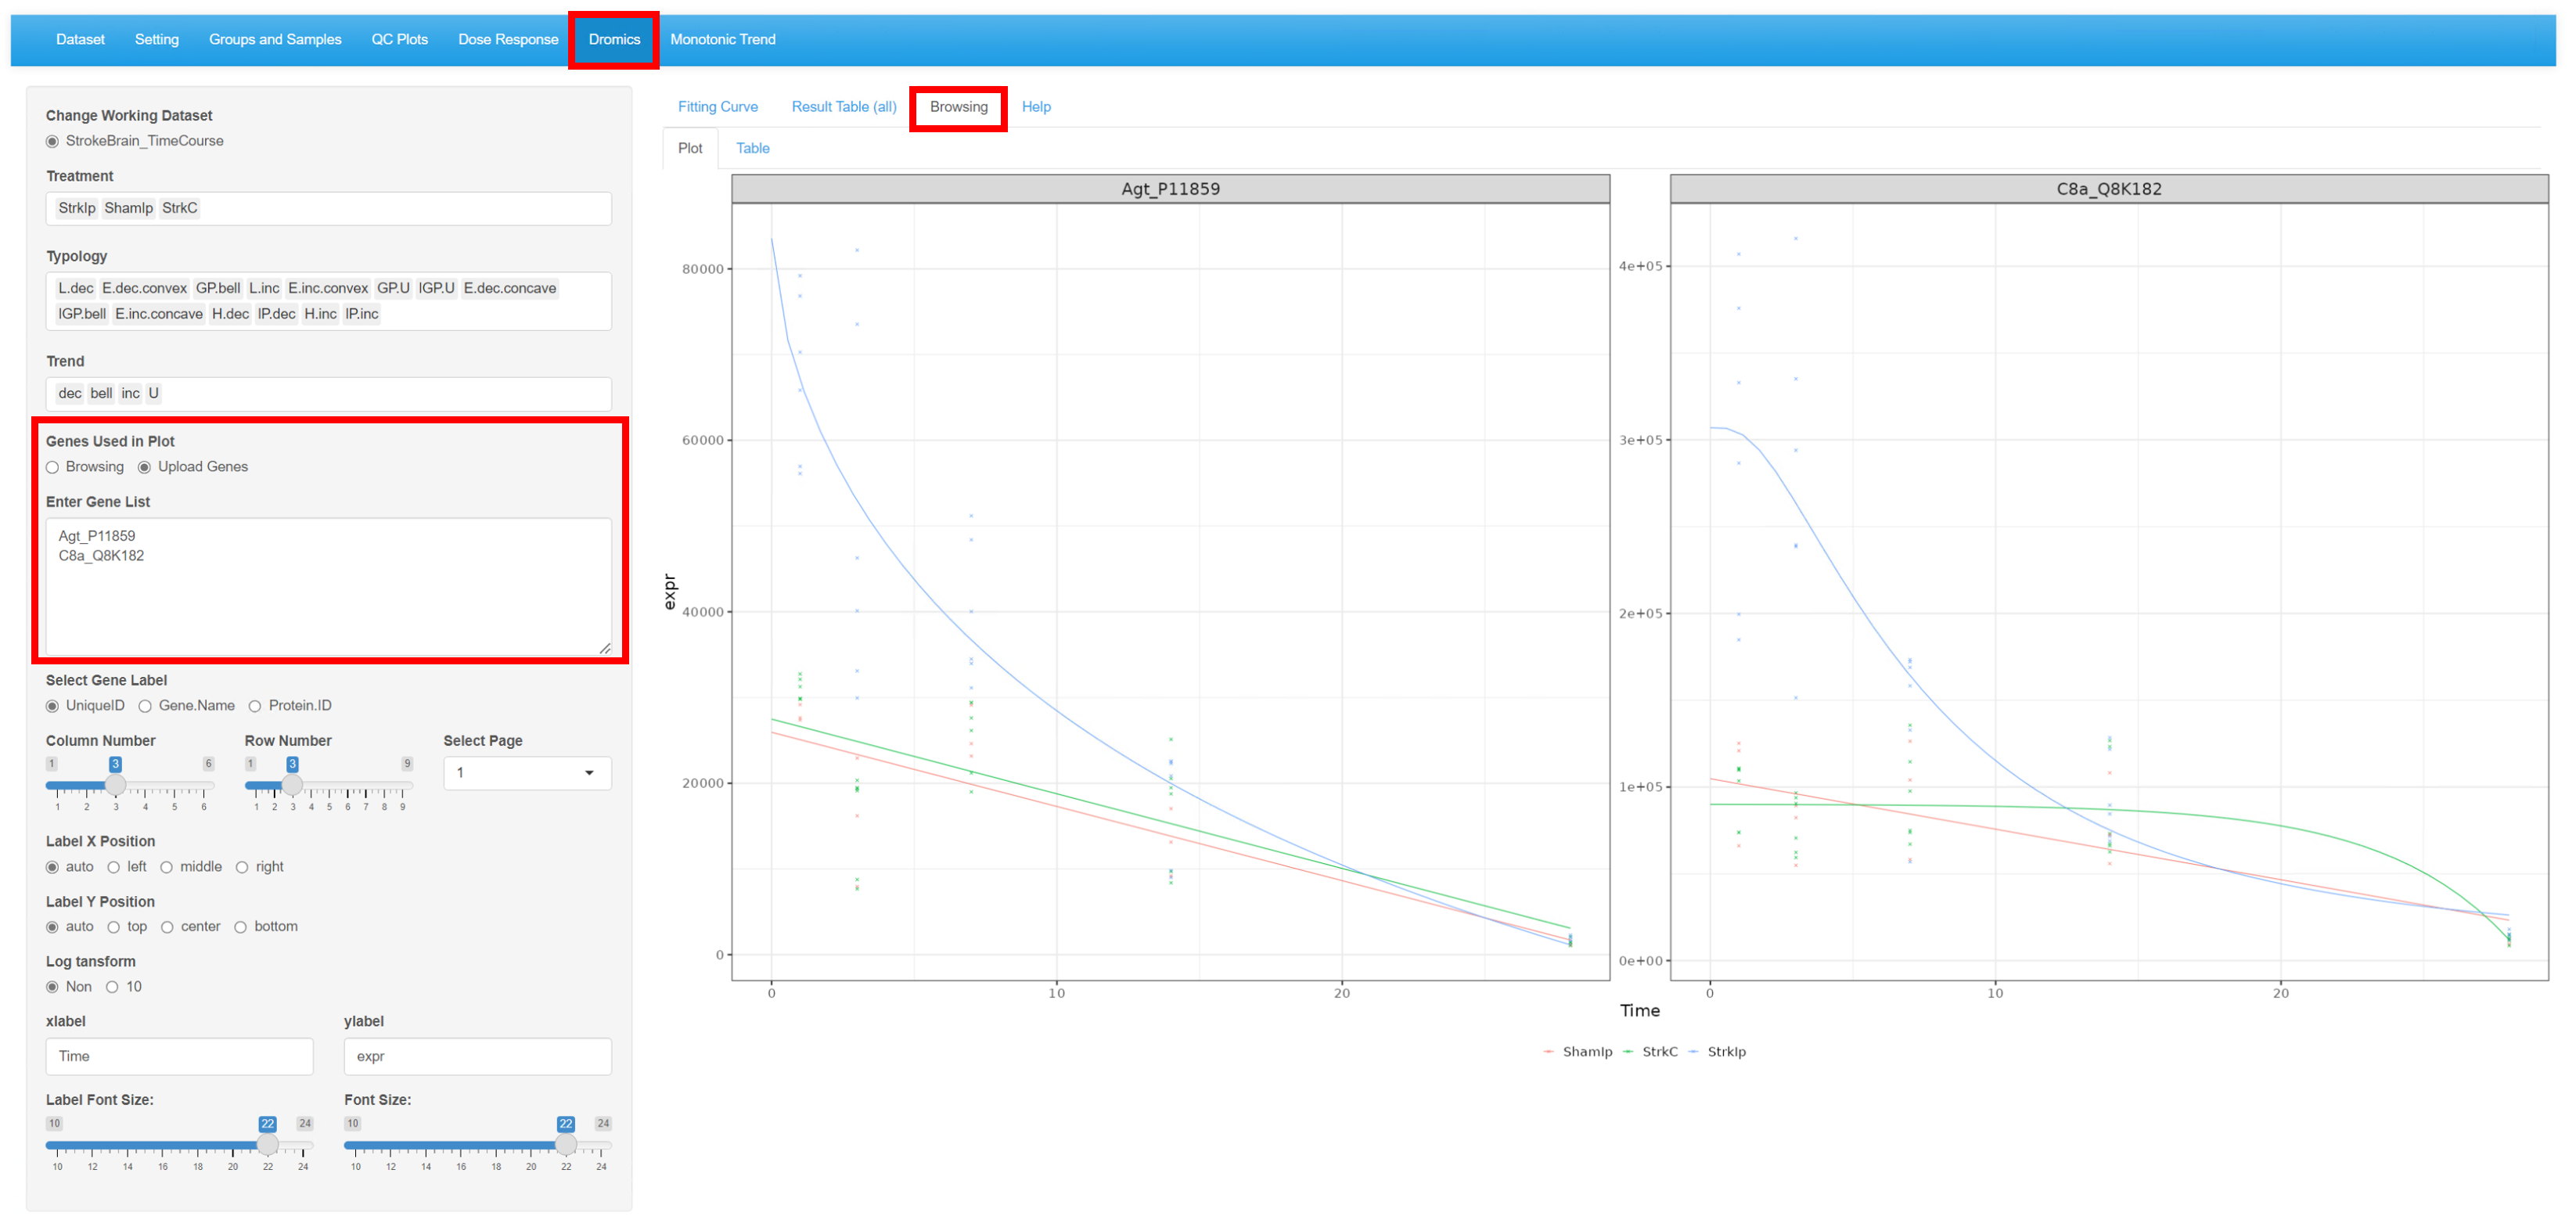
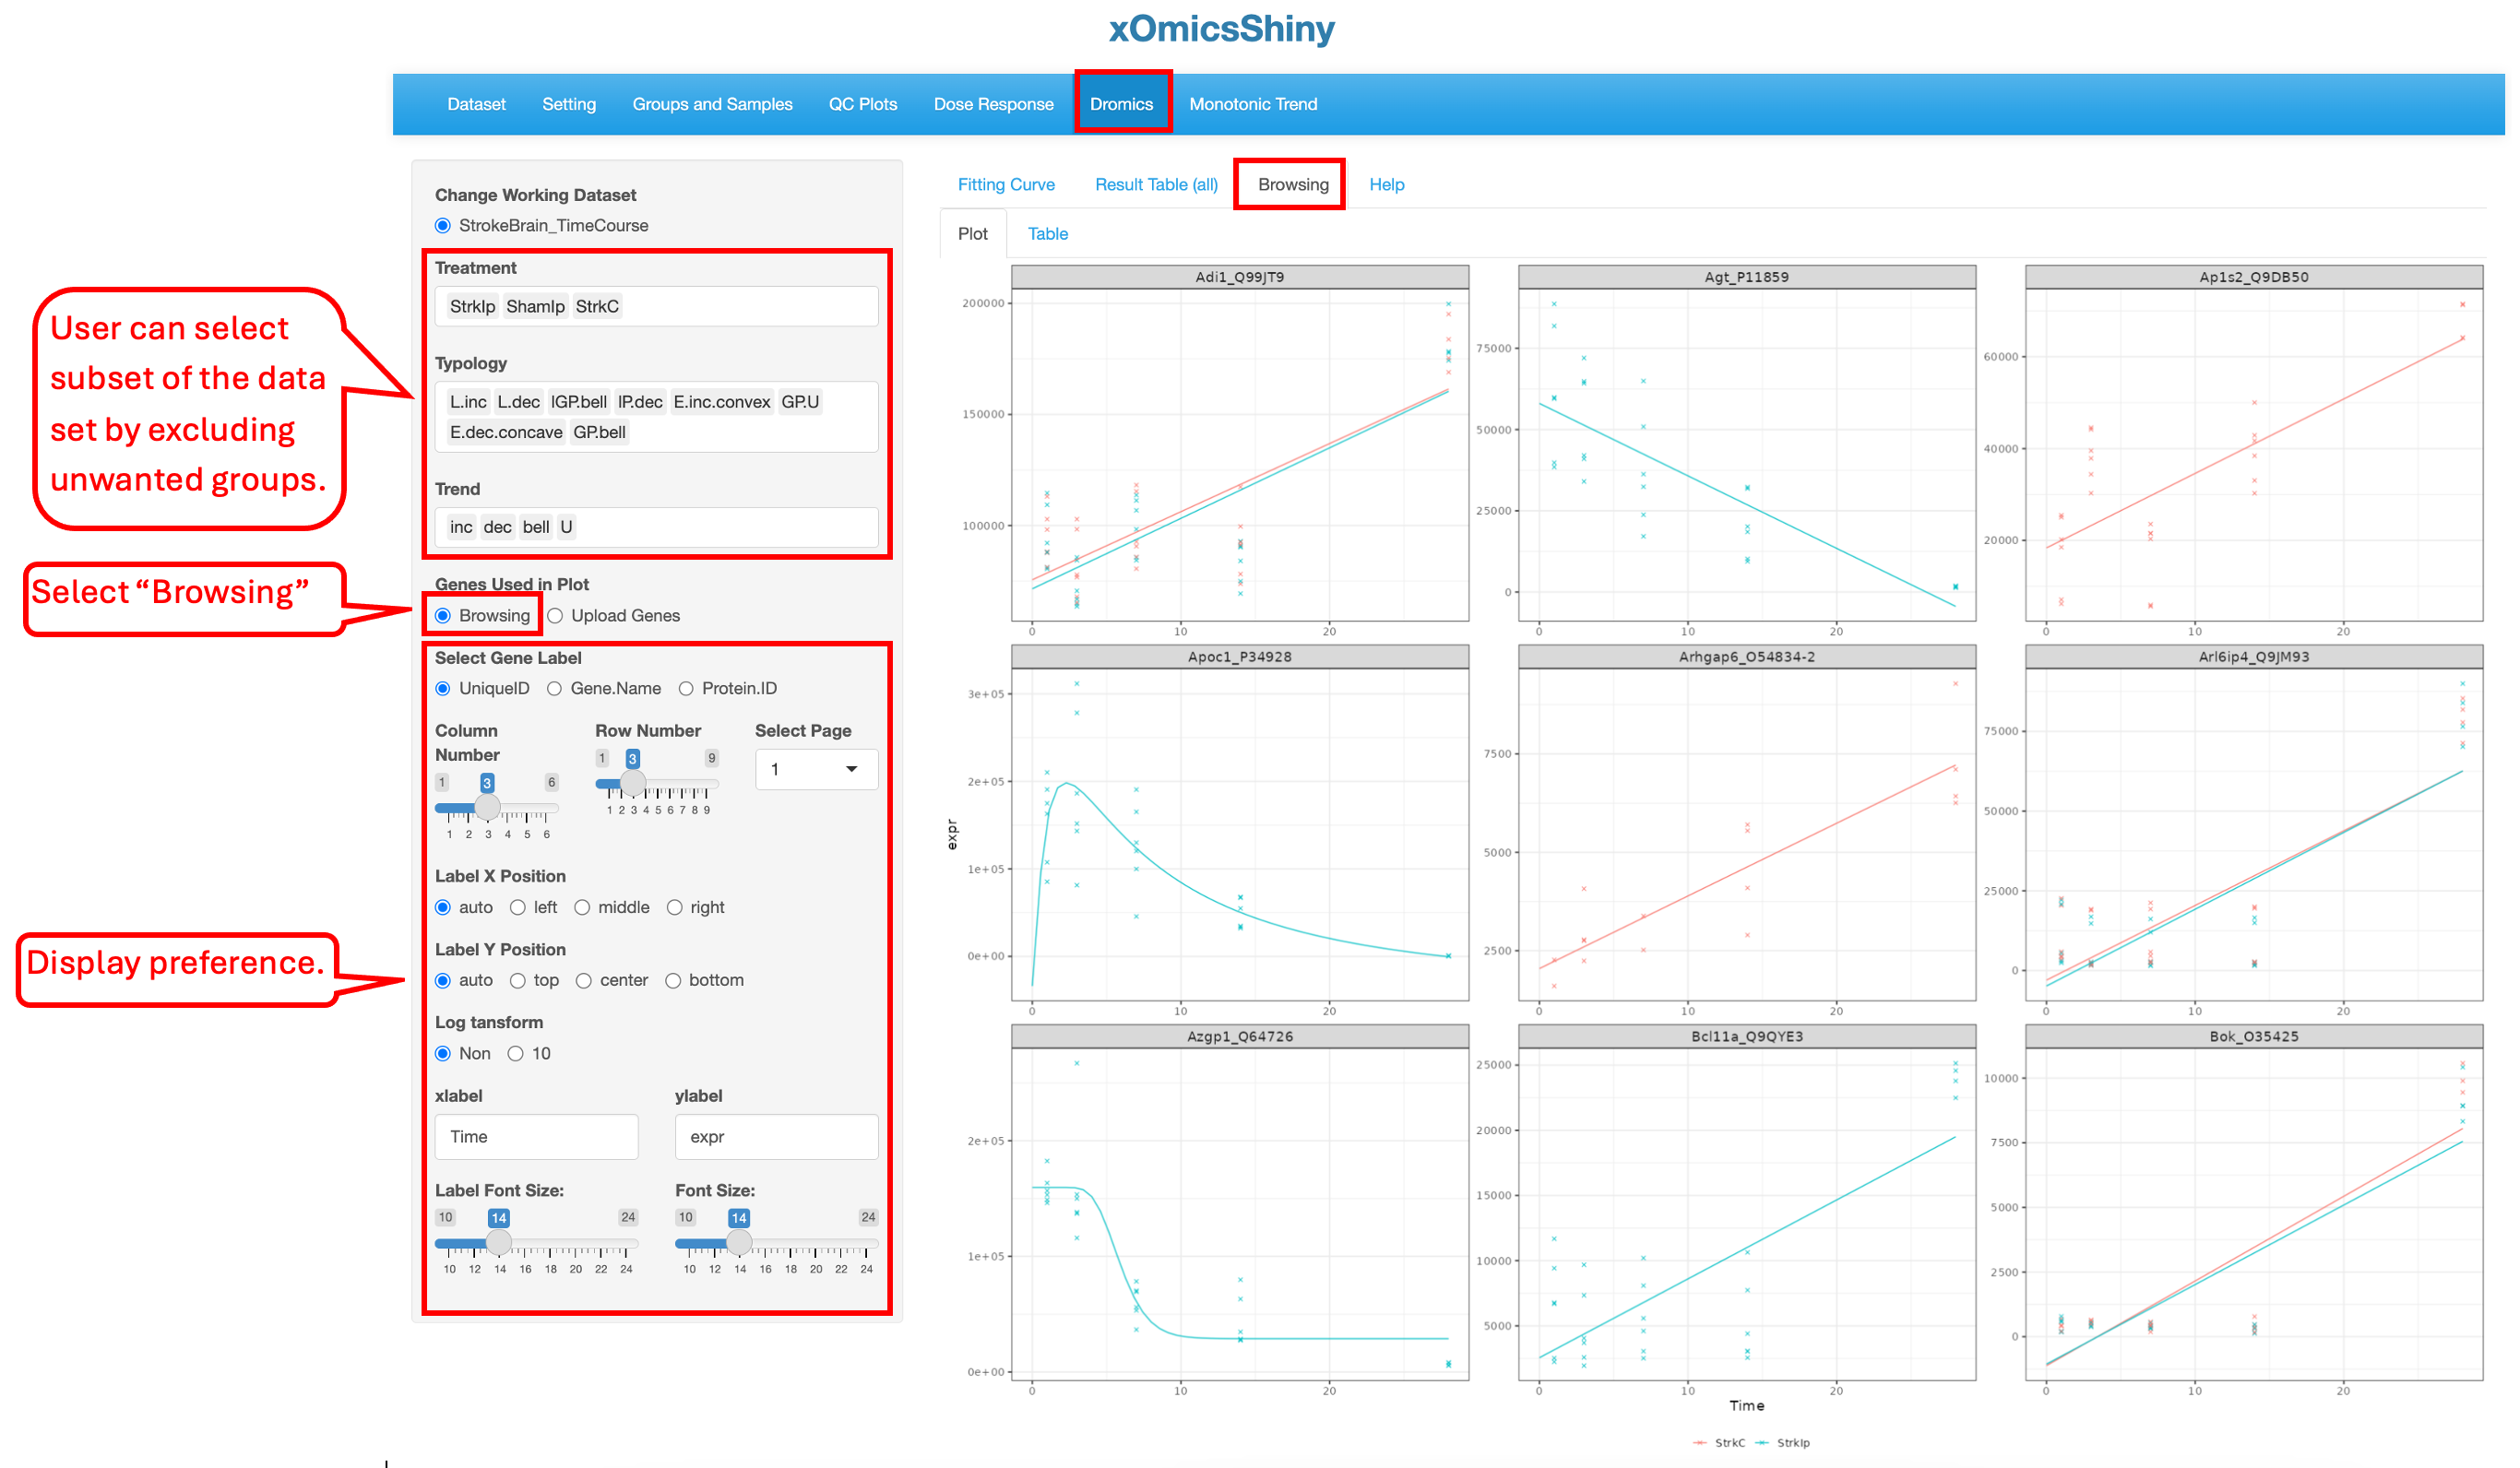
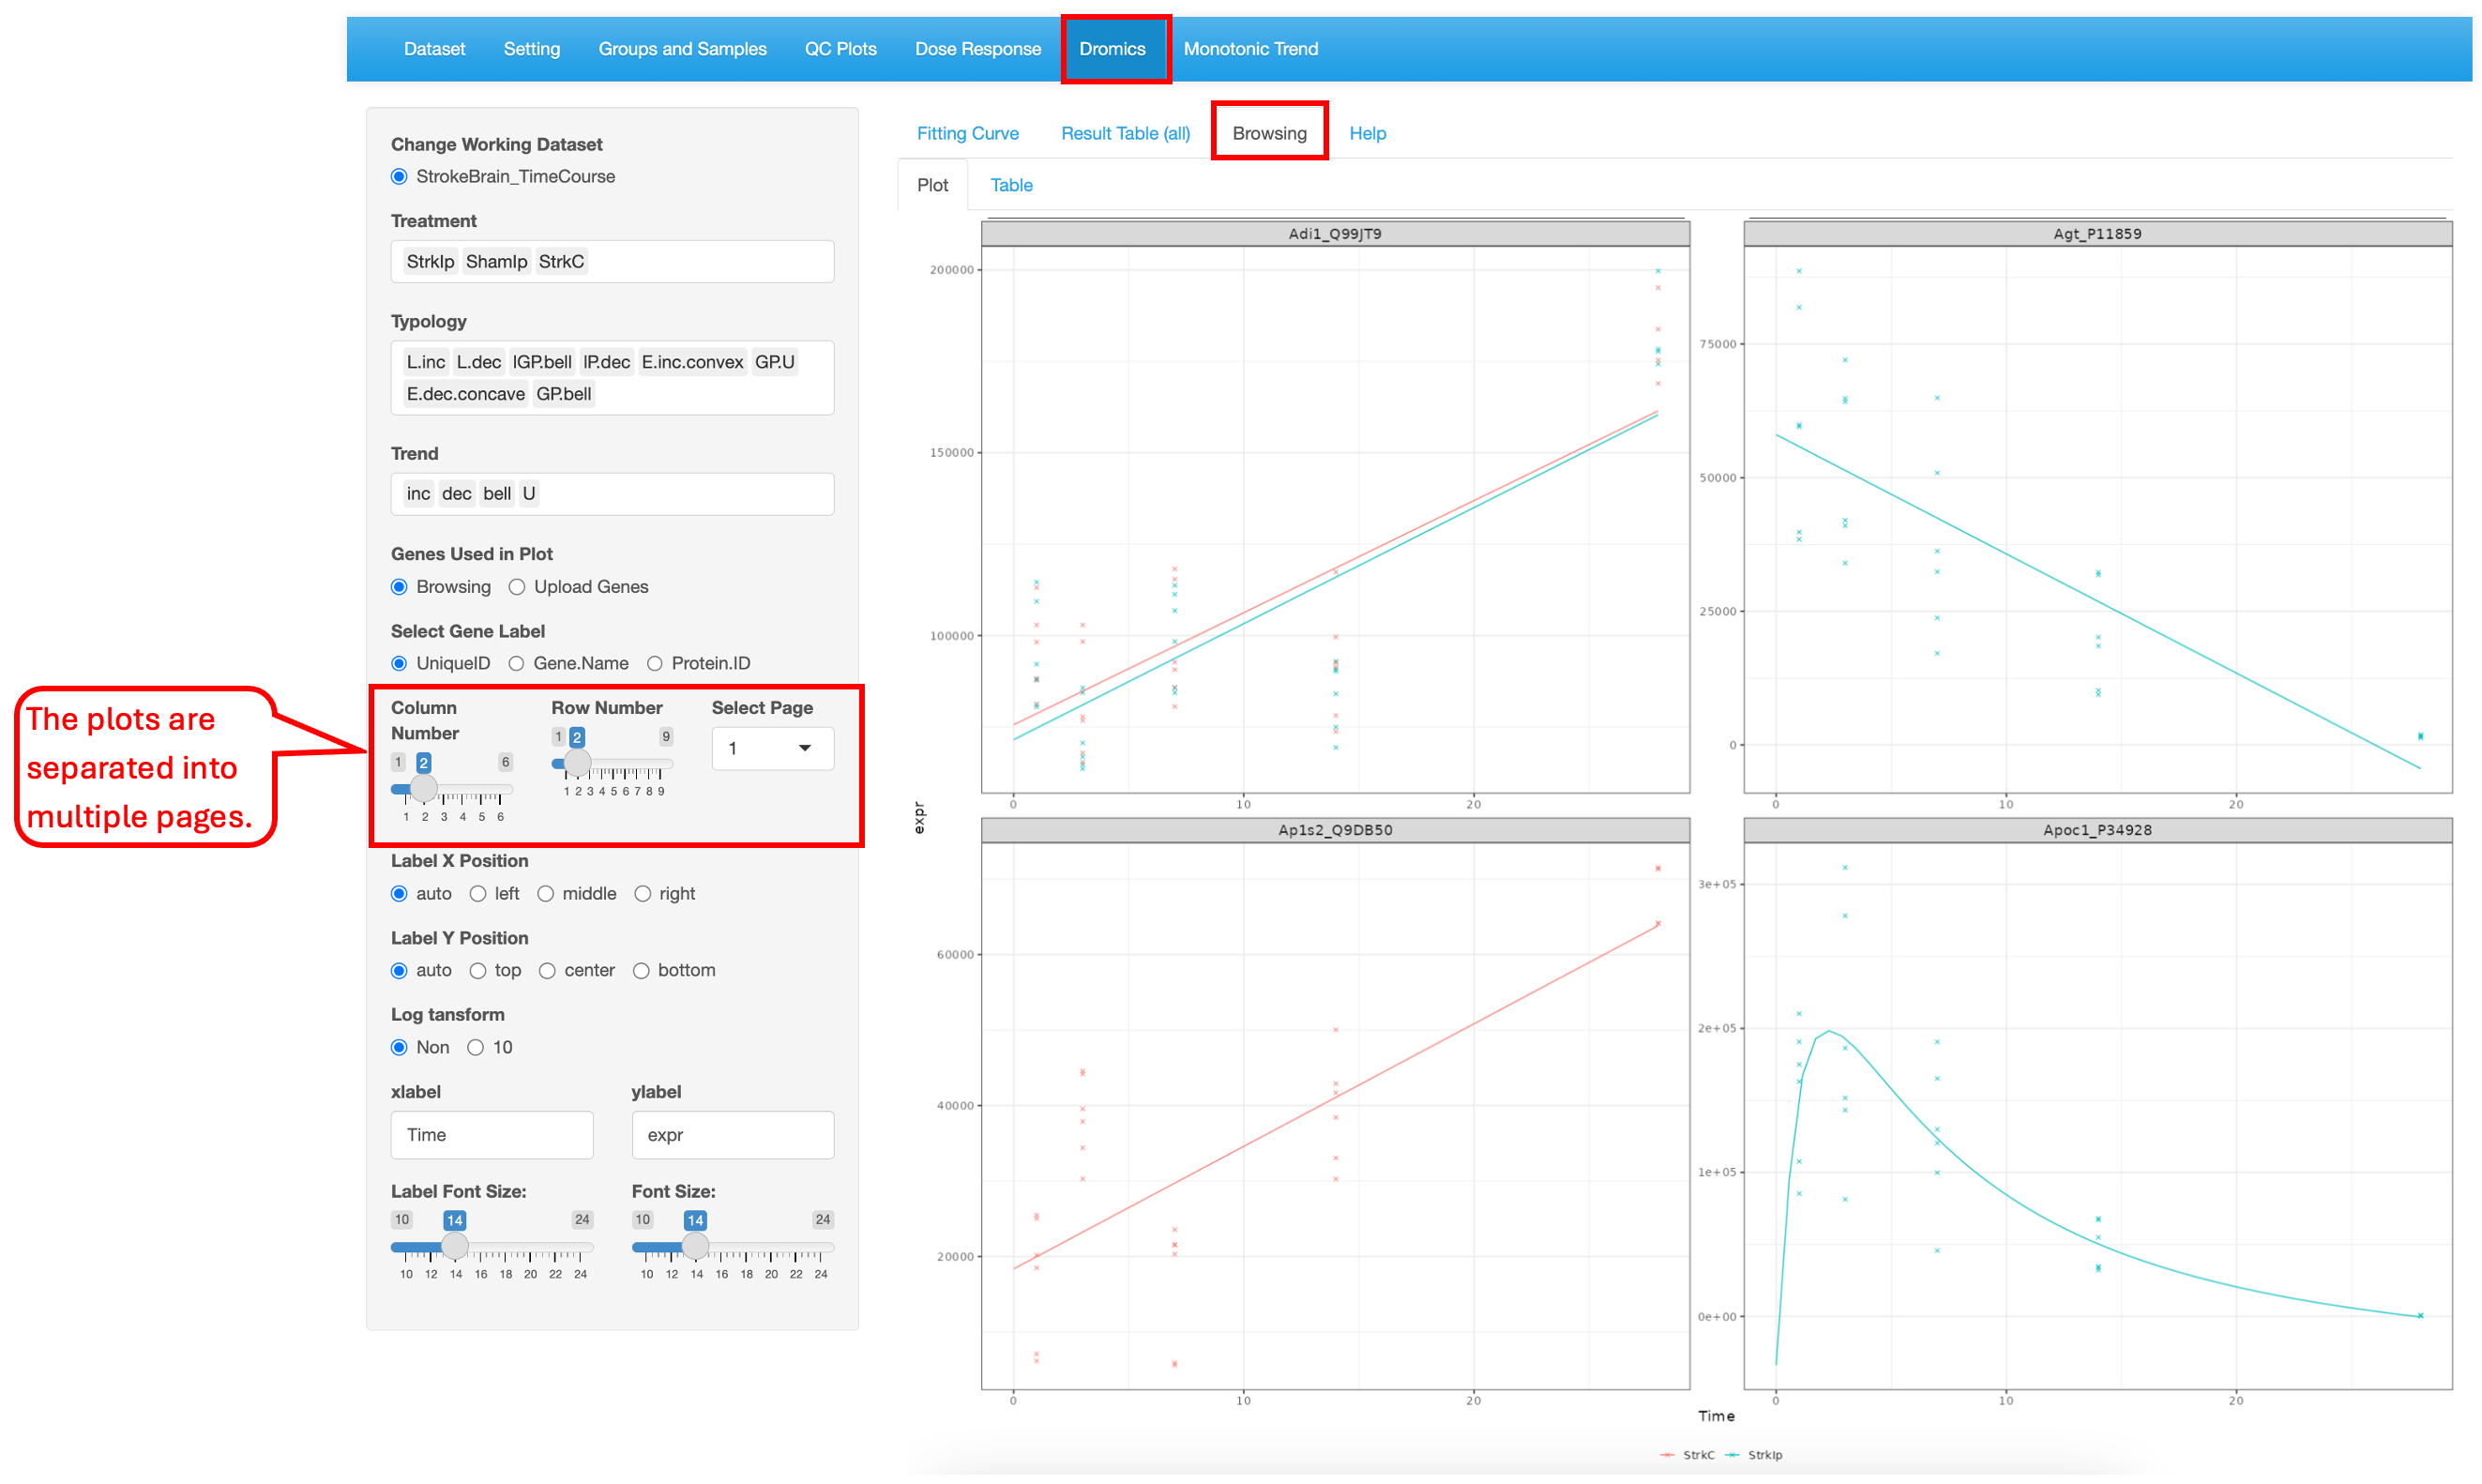
16.3 Browsing
This tab allows users to view the fitting plots for multiple genes in a single page. By default the “Plot” tab shows the plot for the first 9 genes in alphabetical order if not filter applied to the data. The “Table” tab shows the result data in the table format for the genes shown in the Plot tab.
After filter, the “Plot” tab display the fitted plots for filtered genes only.
Users can select their own gene list by using the “Upload Genes” option. Then the Plot tab will show the plots for the uploaded gene list and the Table tab will show corresponding results.