Chapter 7 Heatmap Module
This module generates highly customized publication-quality heatmaps with the ComplexHeatmap package in R. Users can enter automated list of differentially expressed genes or enter a custom list of genes to highlight on the heatmap. This module differs from other modules in that each time Users change the attributes; they need to click on the “Plot/Refresh” button to generate the plot. This is to avoid changing the output before all the attribute are added.
7.1 Static Heatmap Layout 1
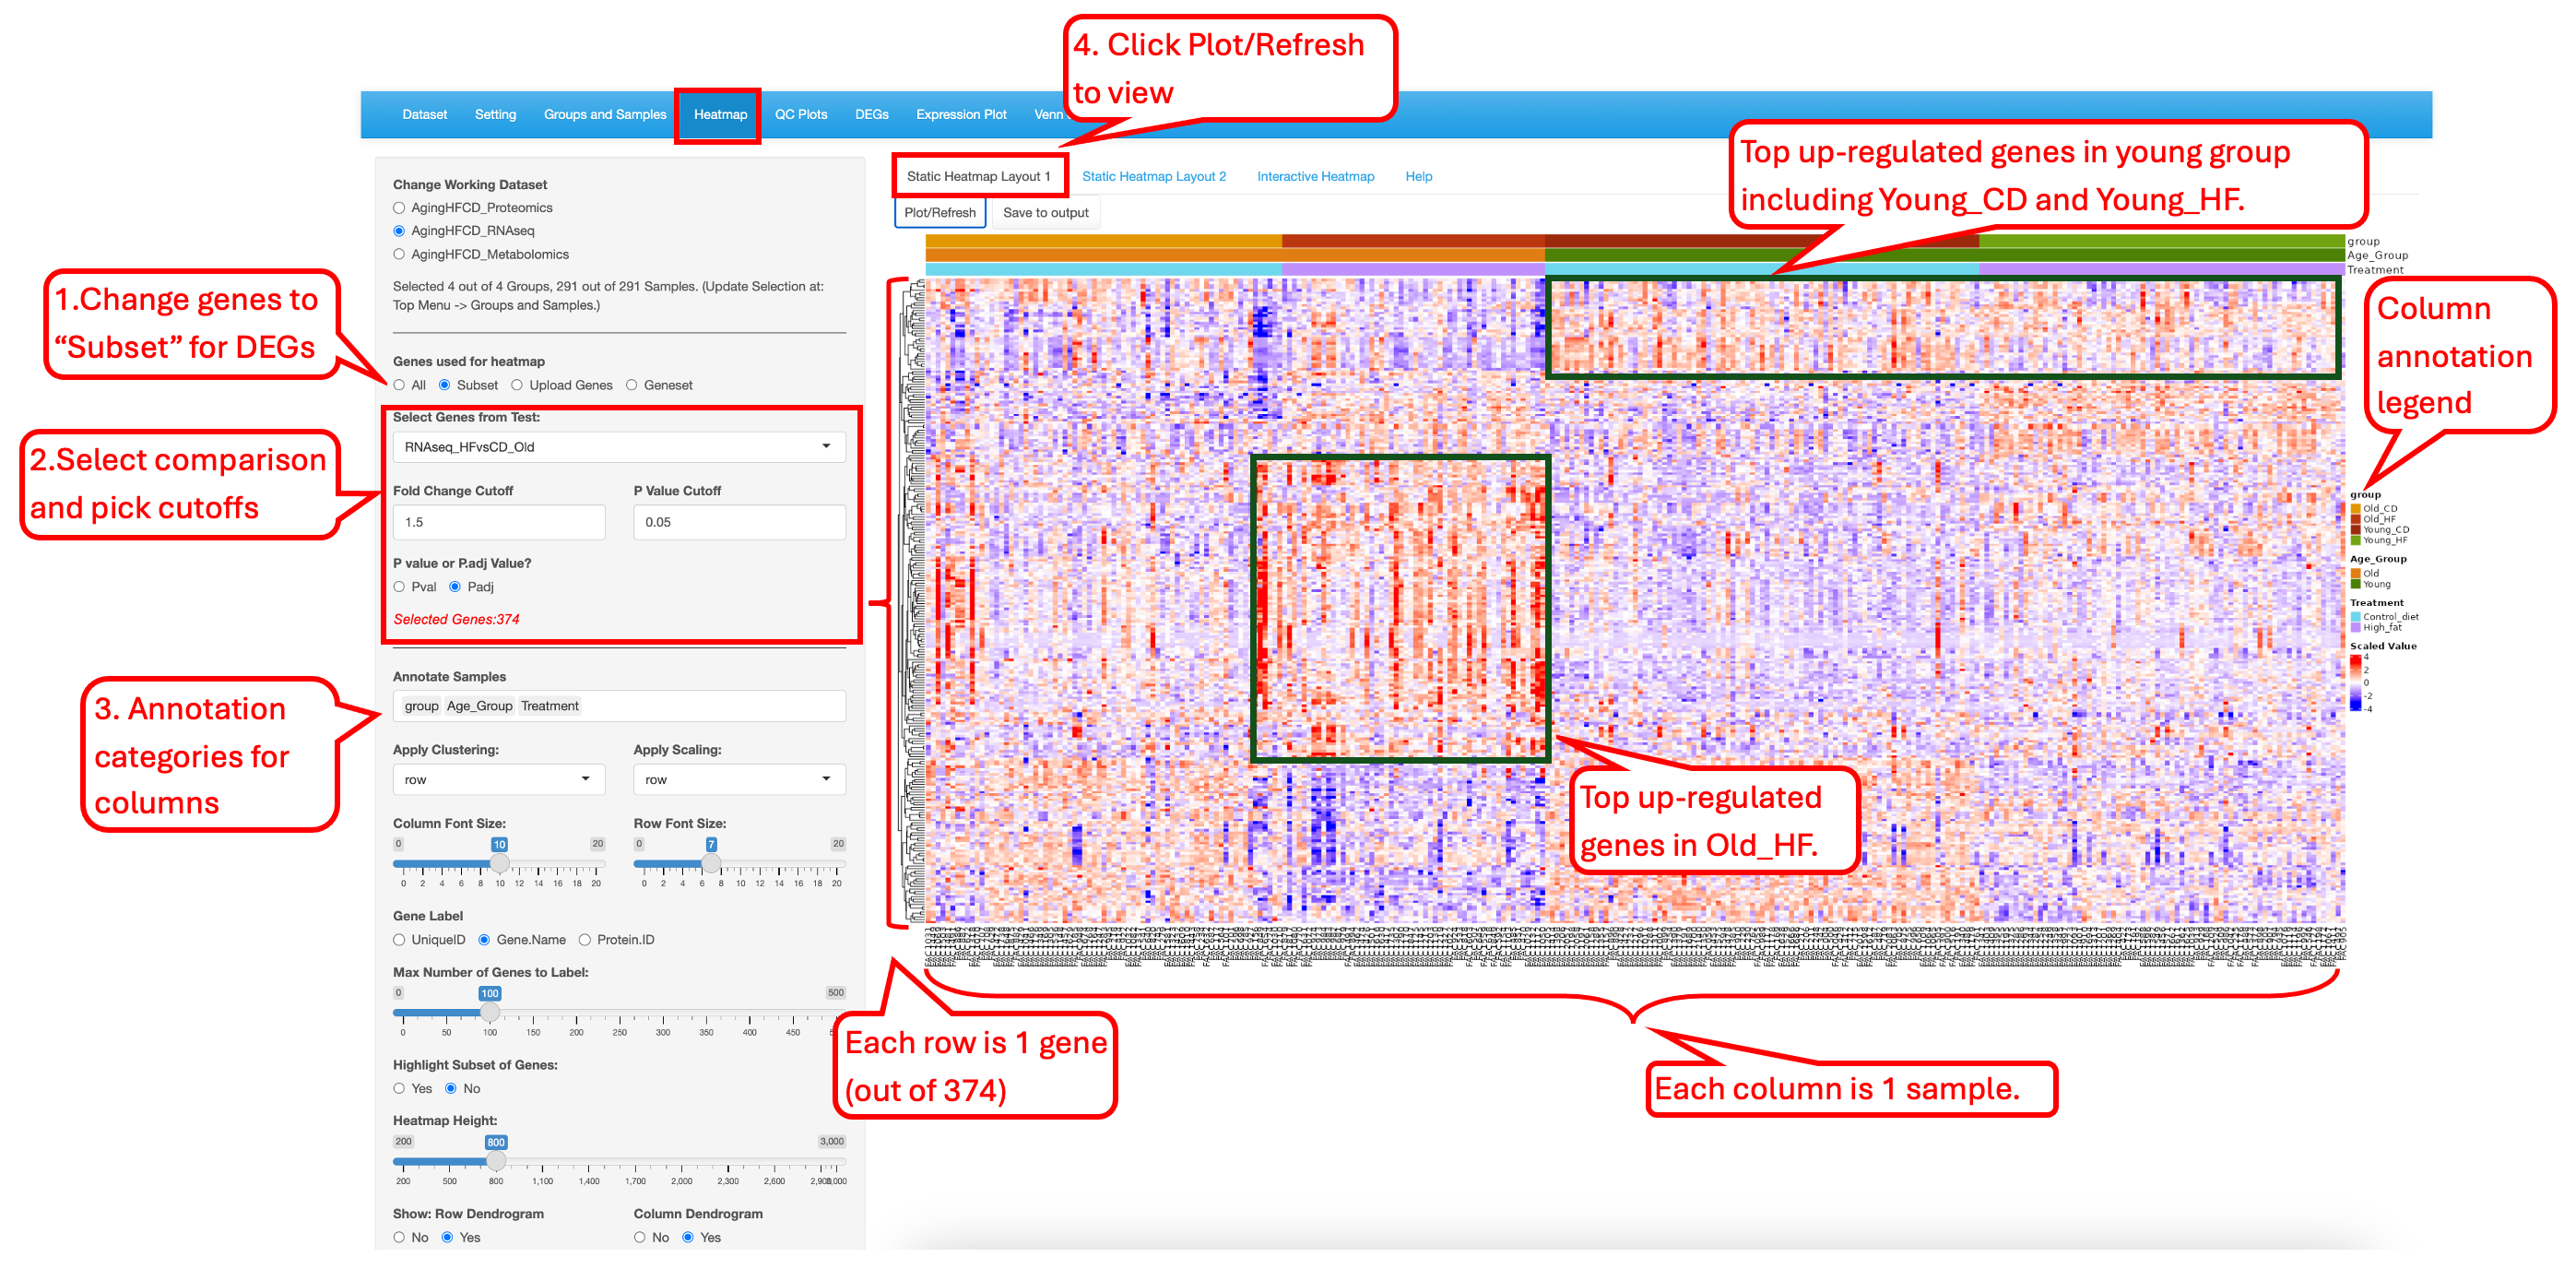
The “Static Heatmap Layout 1” uses the ComplexHeatmap package (Gu et al., 2016) for generating the plot. For demo purposes, we have selected options that highlight some capabilities to generate informative heatmap. For gene selection the default option is the selection of 100 random genes which can also be changed to variable genes. Here we selected DEGs/DEPs from the RNAseq_HFvsCD_old comparison. Users also have the option to change the cutoff criteria for filtering the genes. They can also add/remove annotation categories for the samples on the columns.
In this heatmap, the top up-regulated genes in Old_HF samples are seen as high in Old_HF samples only, while the top up-regulated genes in the Young_CD samples are also high in the Old_CD or Young_HF samples. This pattern suggests that both Age_Group and Treatment has some effect on gene expression, and they showed interactive effect on gene expression too.