Chapter 8 Expression Plot Module
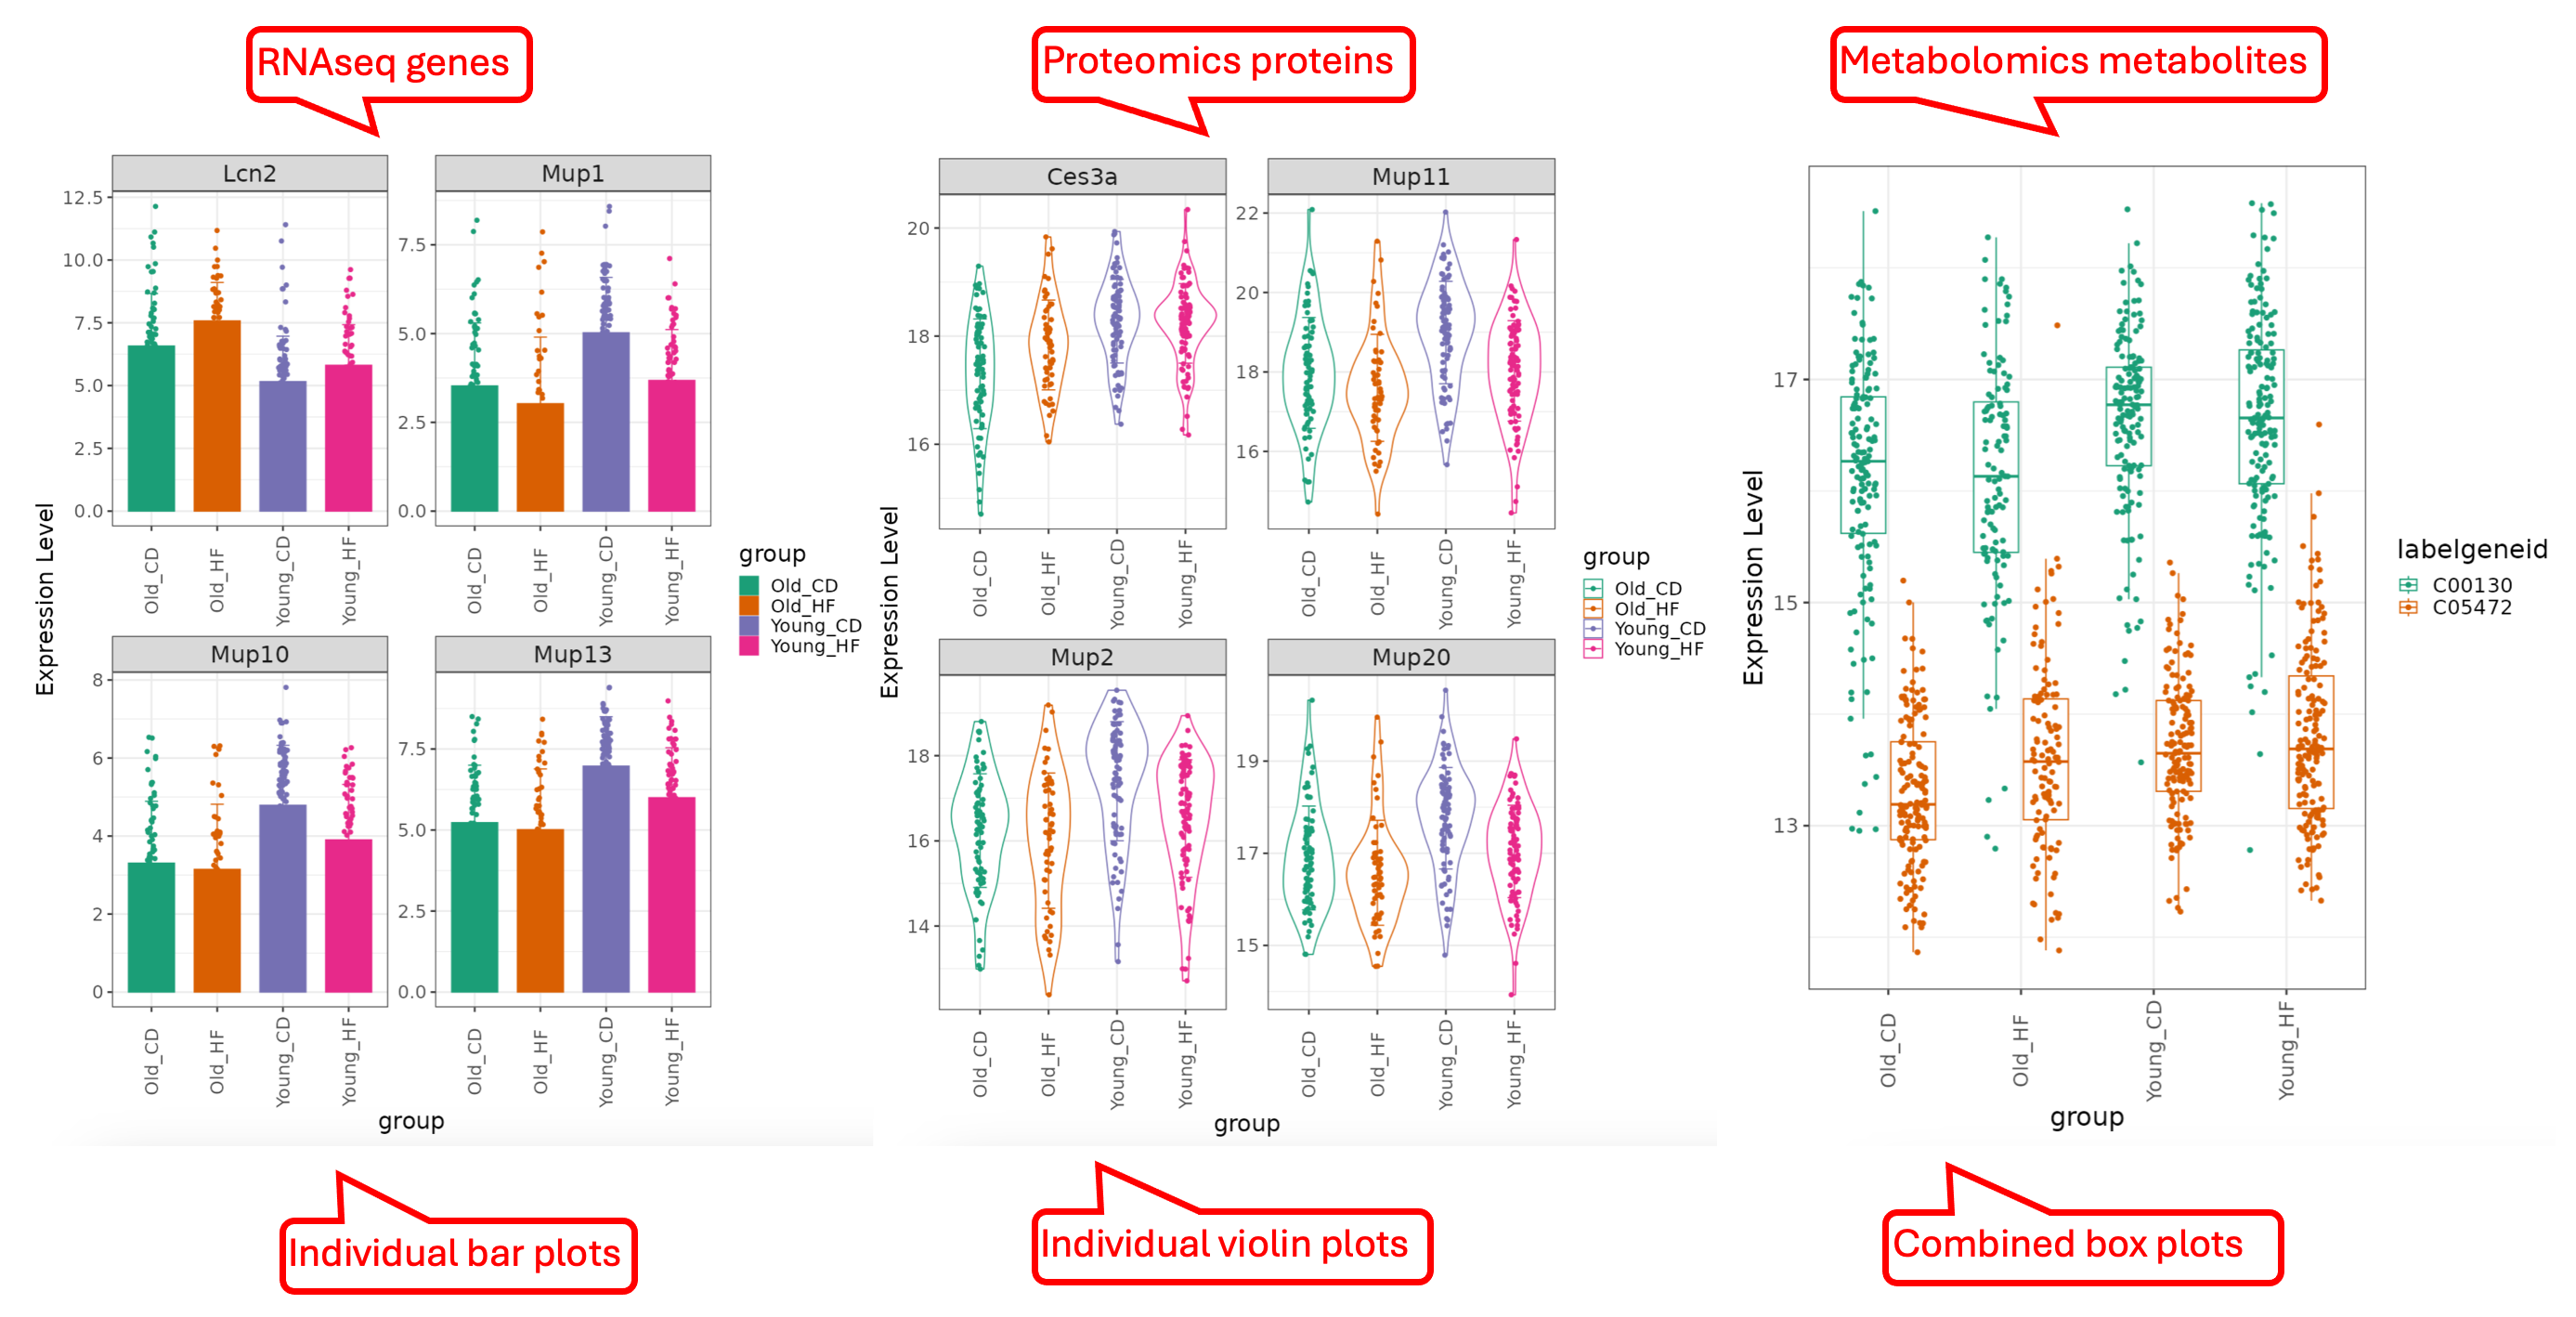
This functional module allows users to browse through a subset of genes/proteins/metabolites. It also offers an option to plot expression of individually selected genes/proteins/metabolites. Four different displays: Box Plot, Bar Plot, Violin Plot and Line Plot are made available to fit the users’ preference. Genes/proteins/metabolites can be ranked by p-value or logFC, and the number of columns in the graph can be changed.
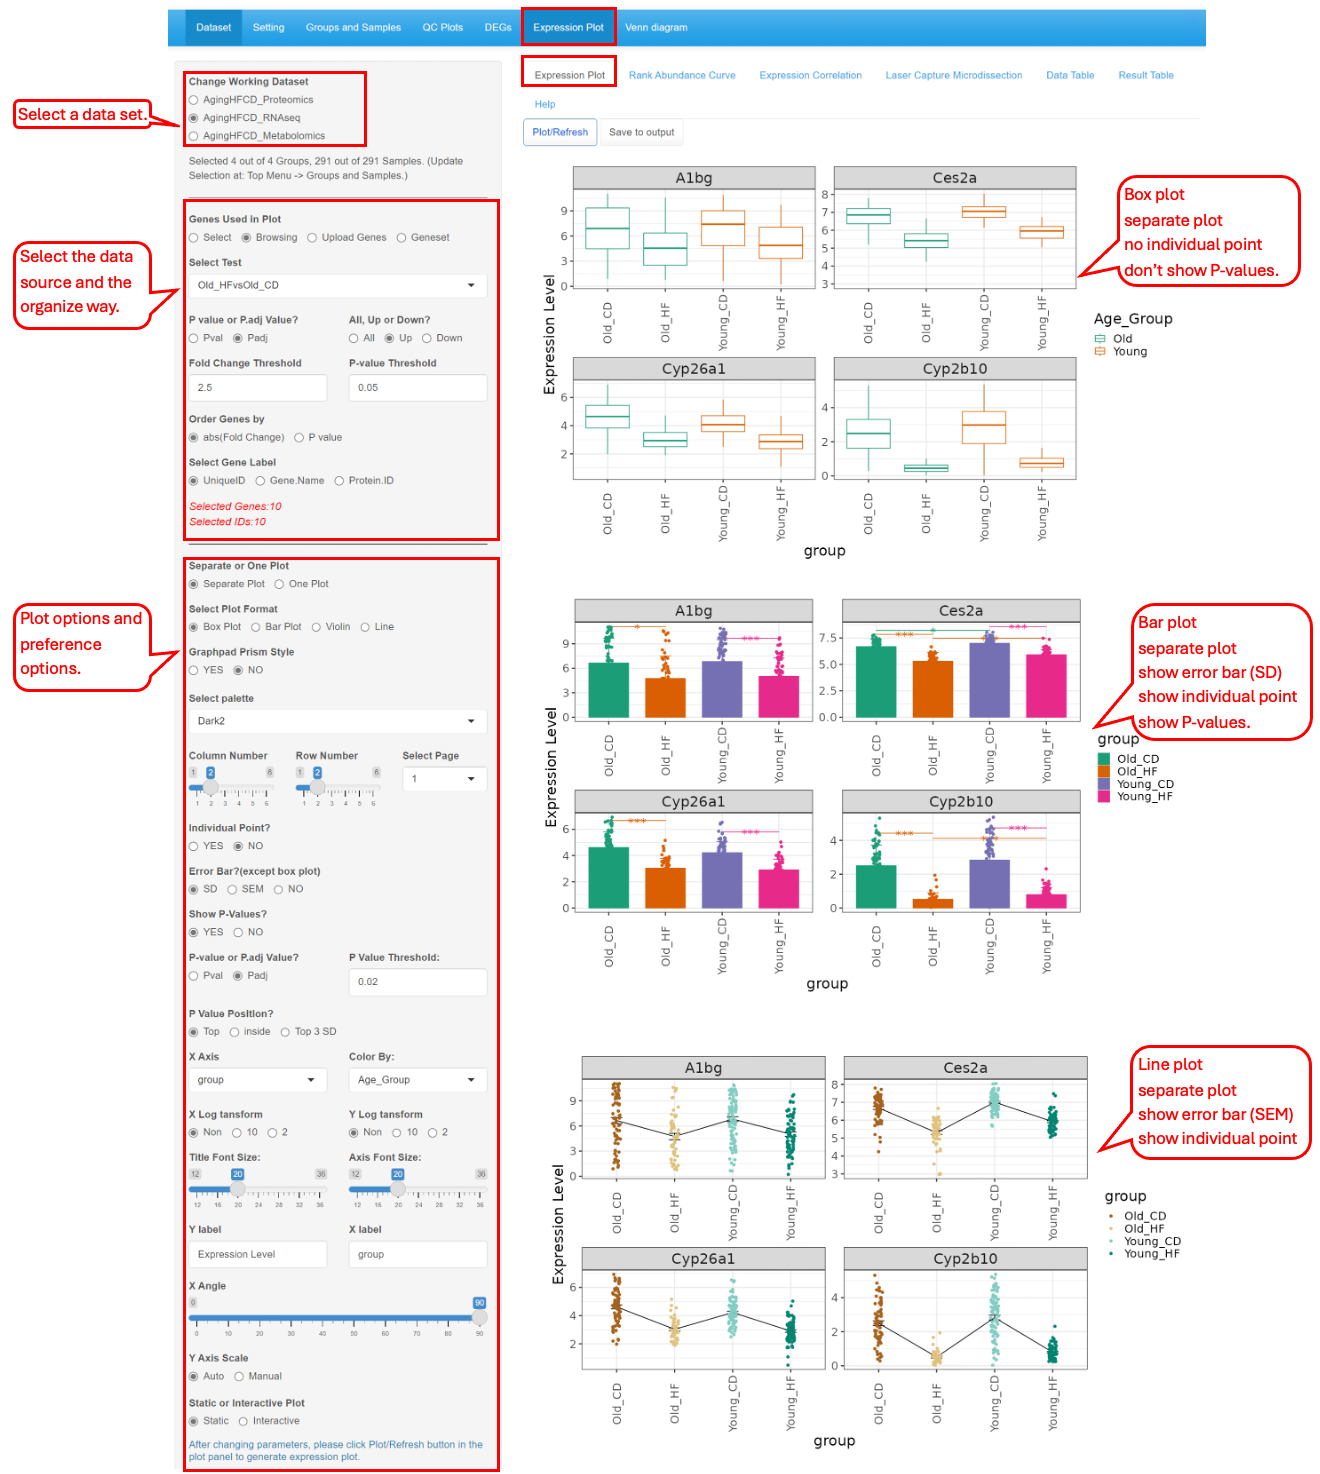
8.1 Set up options
The set up panel contains a few plotting options for data selection and visualization. It consists of dataset selection, data point selection, plot type, plot display parameters.
This tab lets the users plot out the expression of the DEGs/DEPs identified in the different comparisons. In this example below, we demonstrate how to display a few top genes using different types of plots.
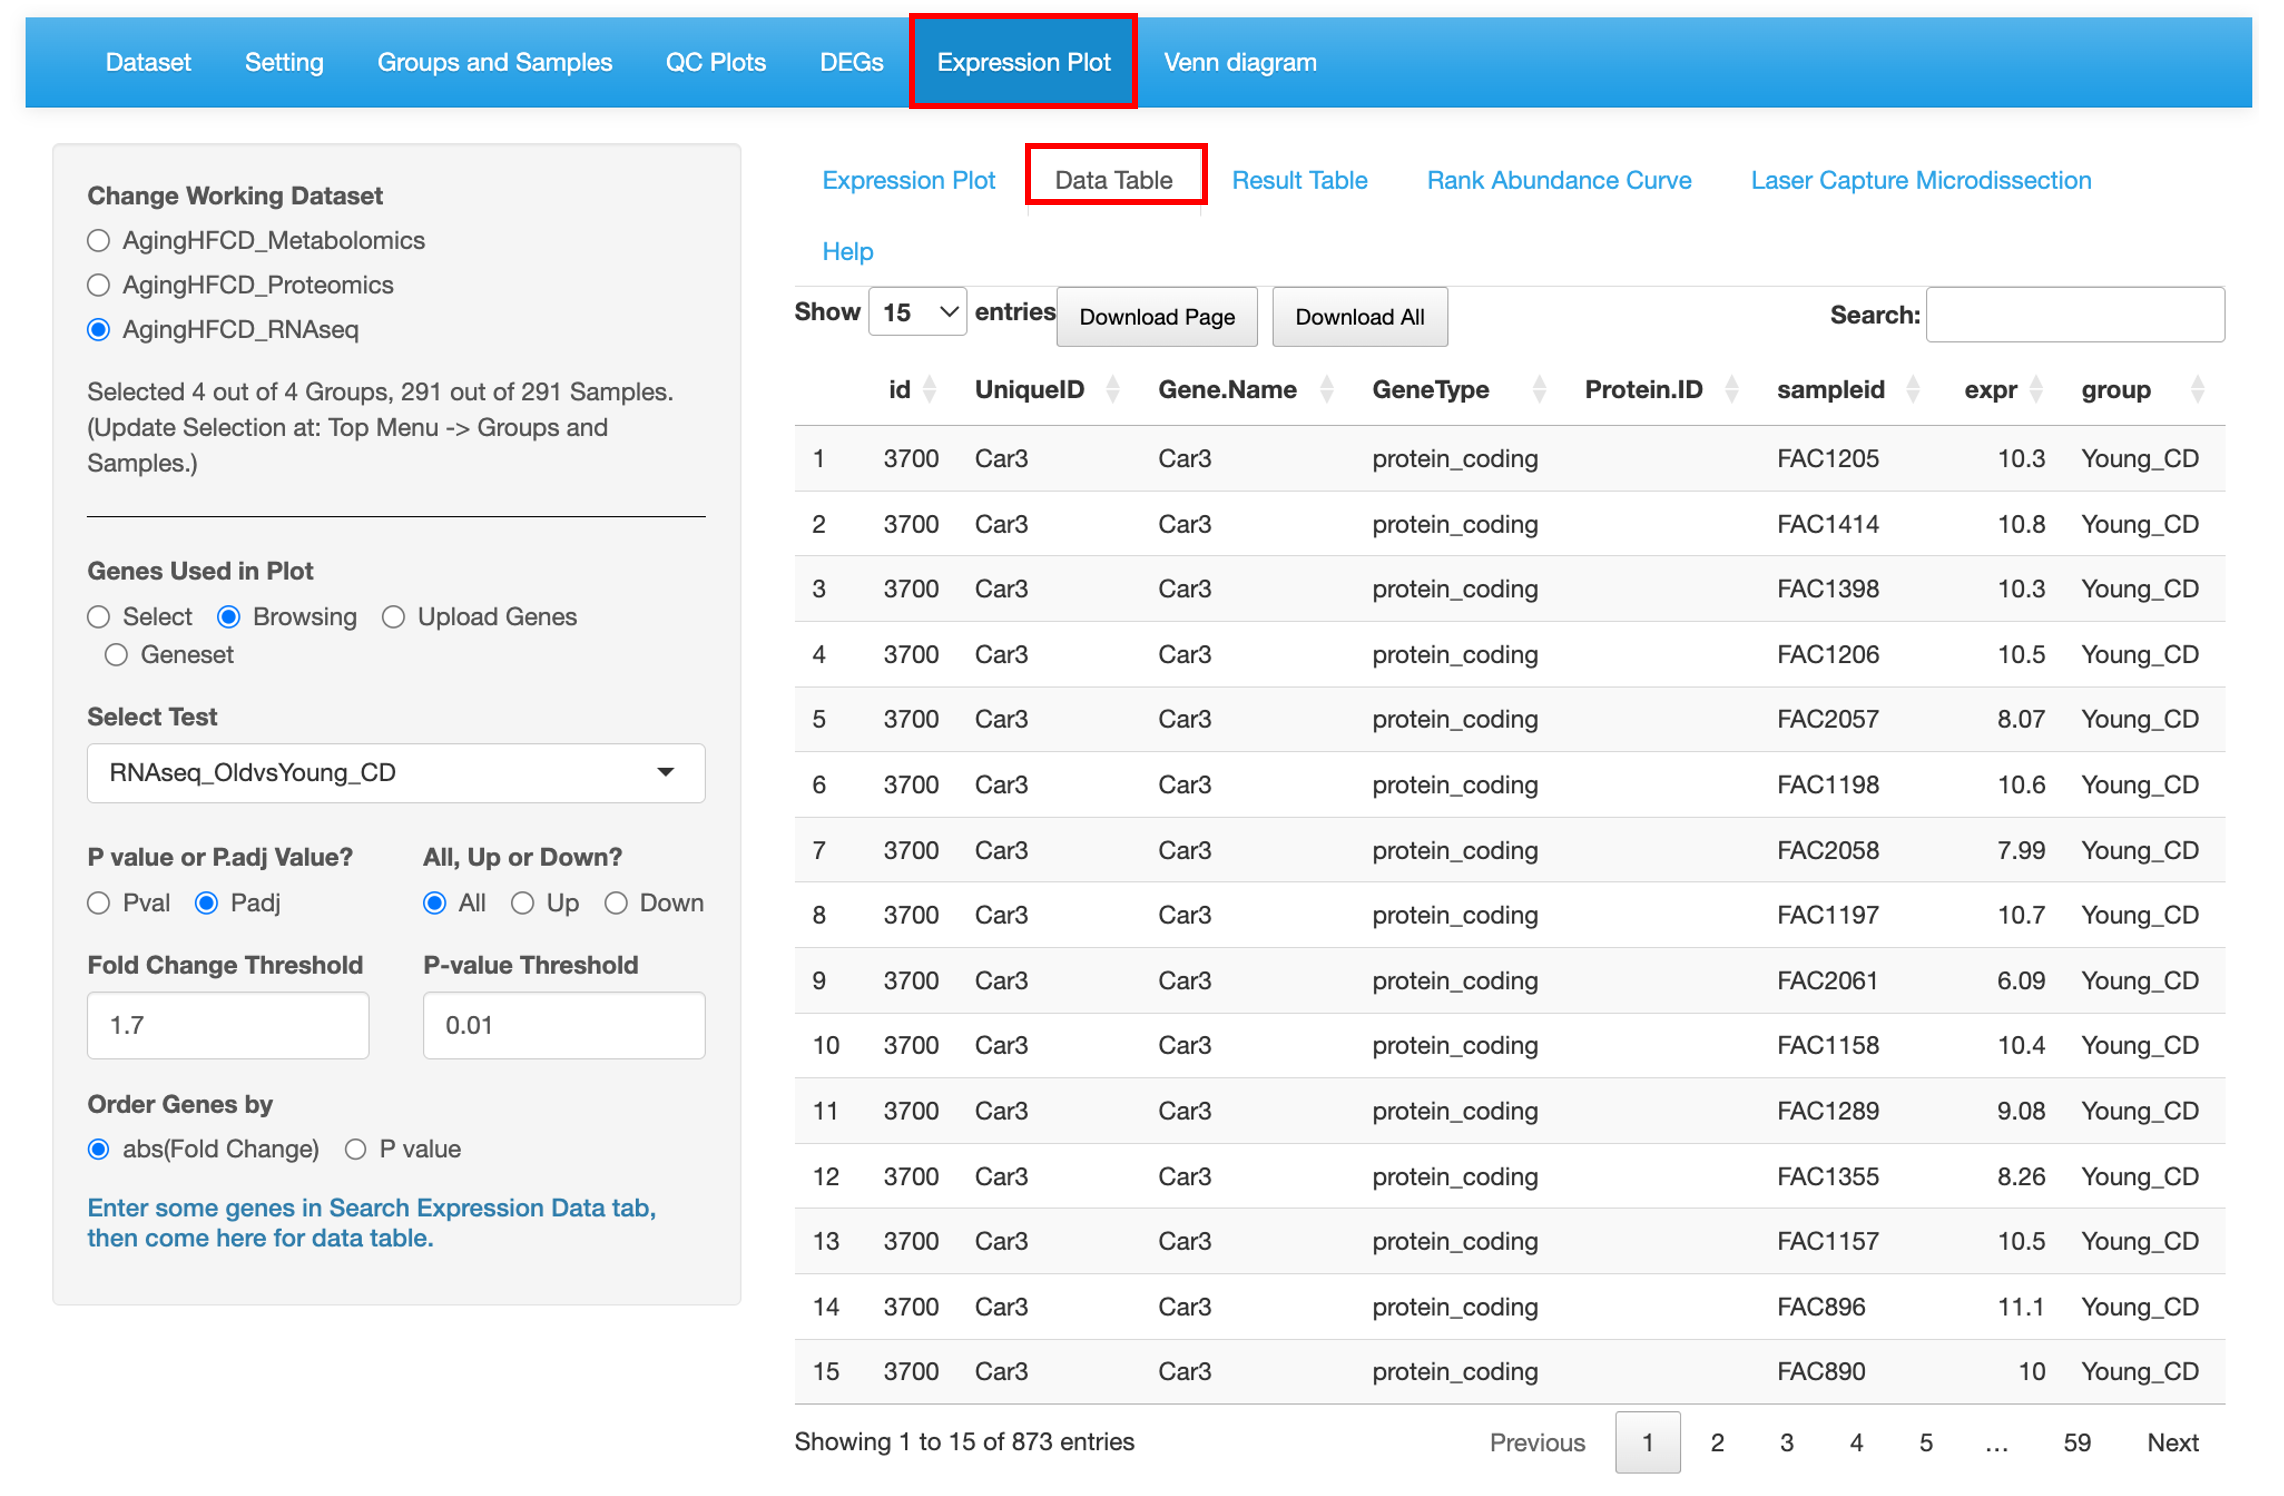
8.2 Data Table
This sub-tab lists the normalized expression data of the genes/proteins/metabolites selected from the left menu as a searchable table.
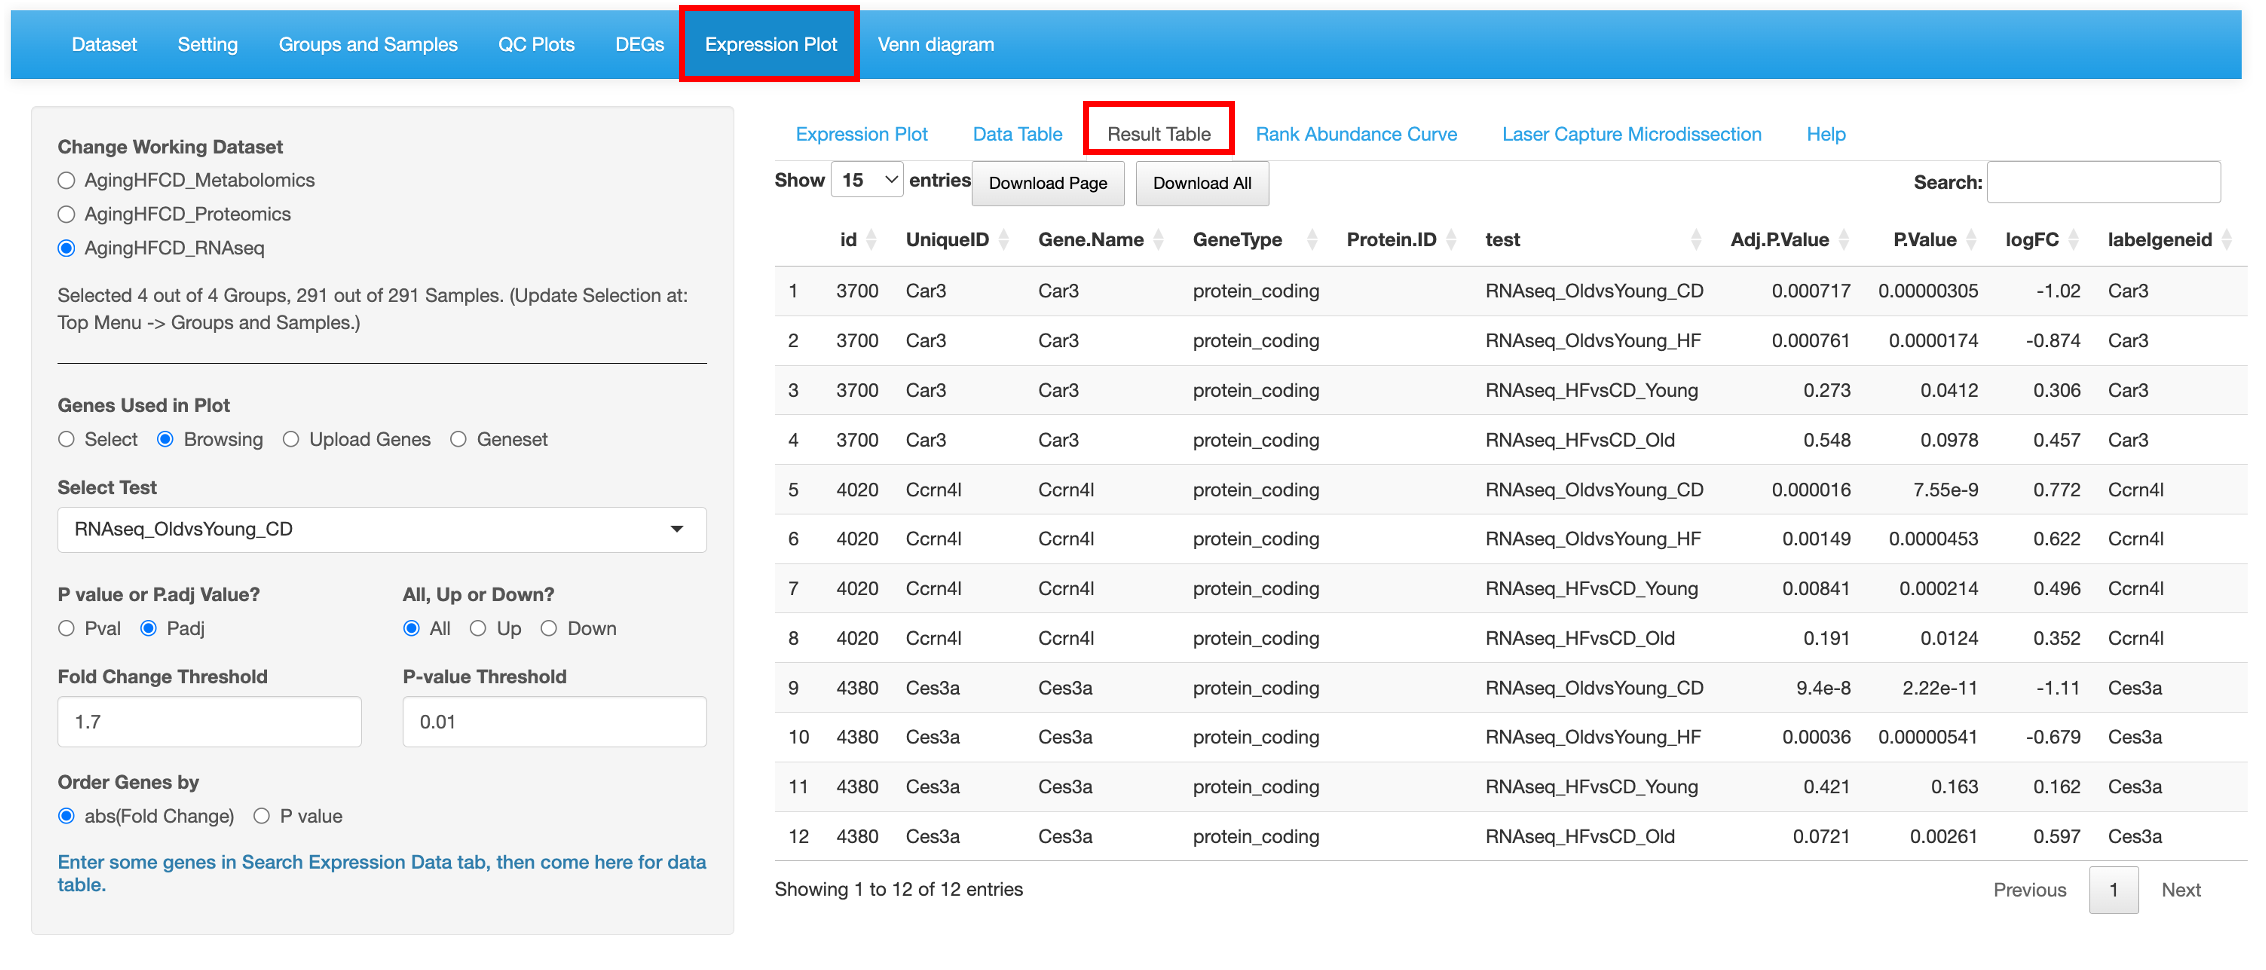
8.3 Result Table
This tab lists the statistics results of the genes/proteins/metabolites selected selected from the left menu as a searchable table. Each comparison defined is probed for the genes/proteins/metabolites in the list and the P value and Fold changes are listed
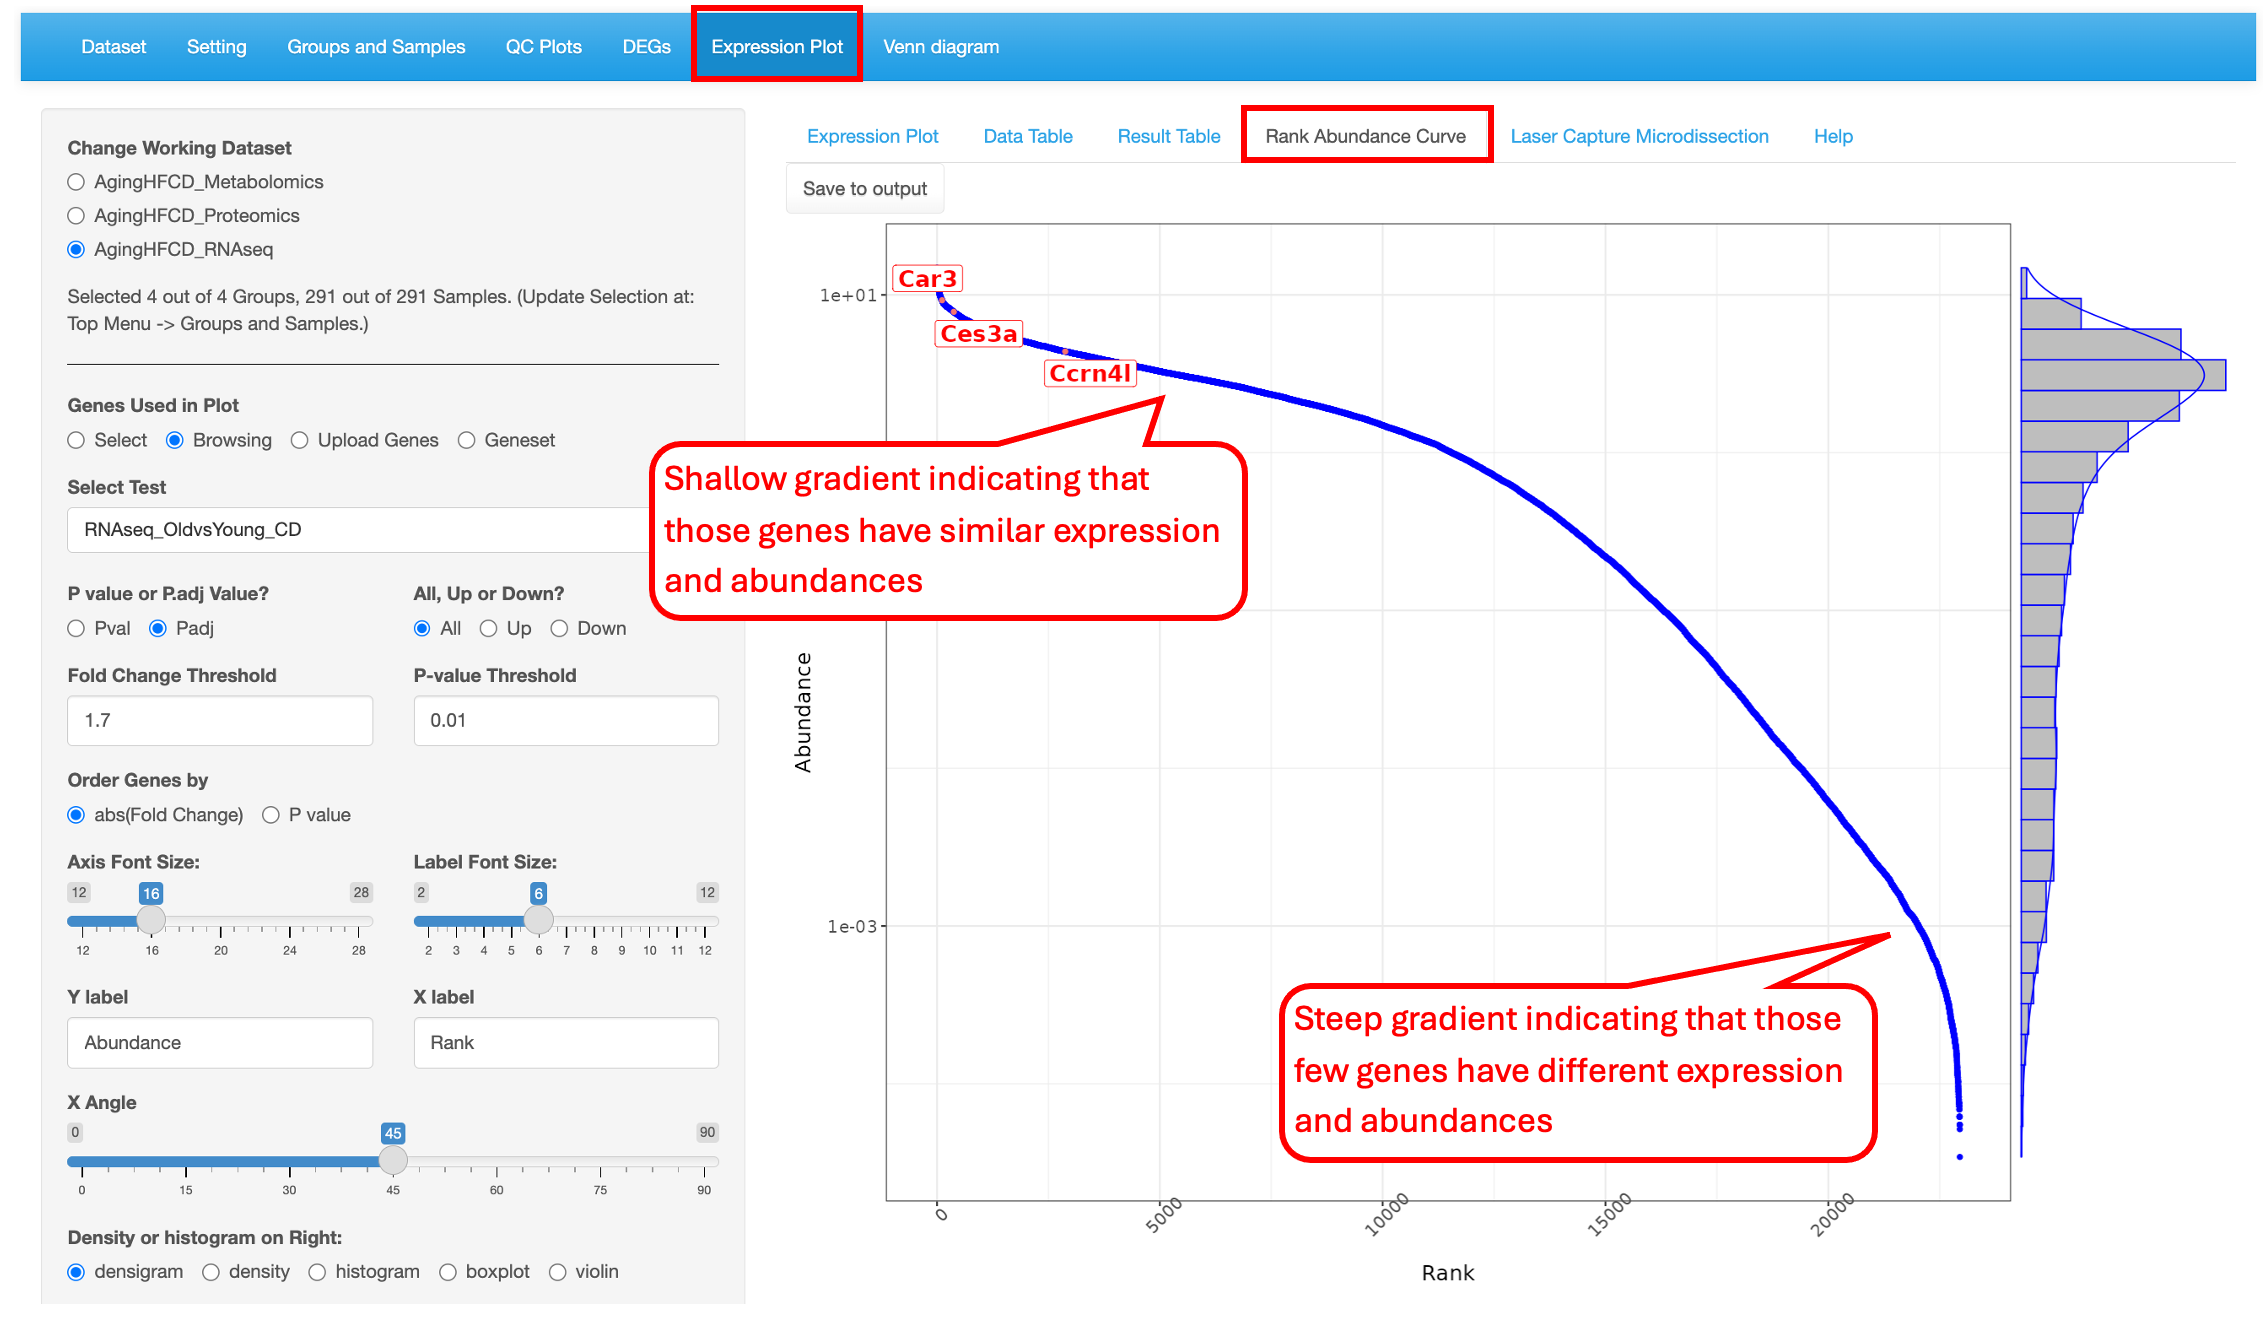
8.4 Rank Abundance Curve
This functionality helps identify the relative abundance of a list of genes within a dataset. This plot helps interpret the distribution of abundance and expression levels of a set of genes. A steep gradient indicates the genes are very different in their expression levels as the high-ranking species have much higher abundances than the low-ranking species. A shallow gradient indicates that the genes have very similar expression levels as the abundances of different species are similar.
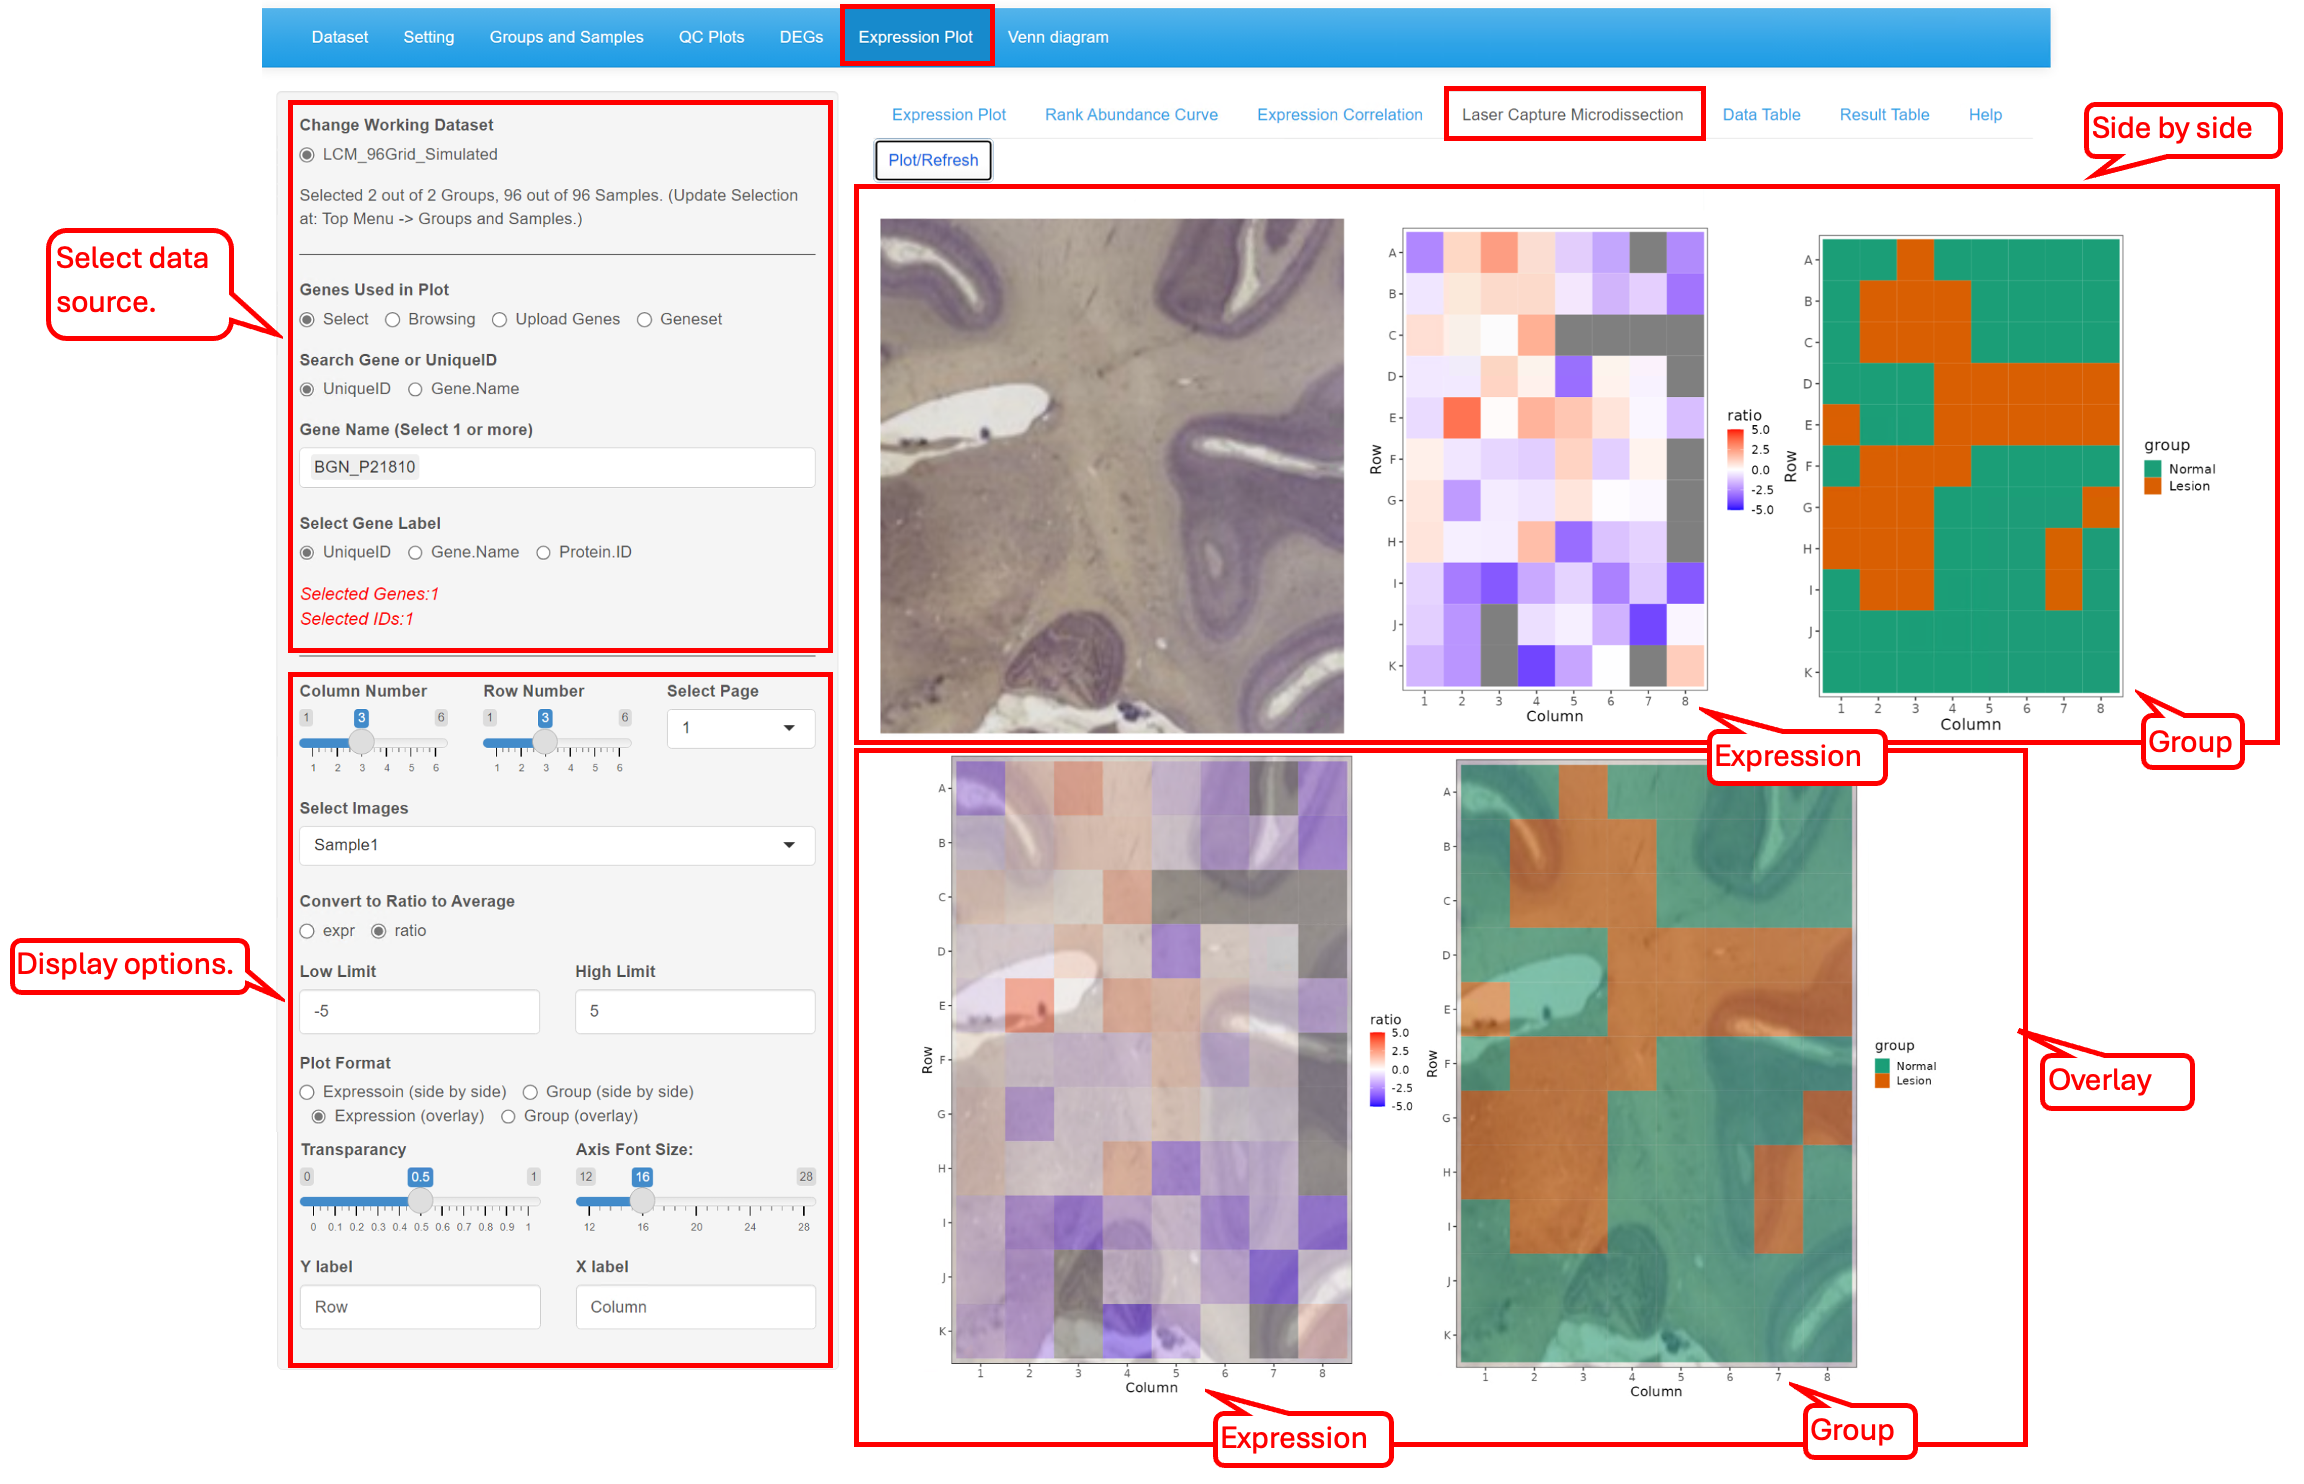
8.5 Laser Capture Microdissection
This functionality helps to check the gene expression arranged in the order of the sliced spatial samples. With the reference of the spatial sample image, users can check the gene expression side-by-side or in an overlap manner. Here we show the tool with our simulated data set LCM_Simulated.