Chapter 9 Gene Set Enrichment Module
This functionality is an extension to the differential gene identification. Users are able to use different cutoffs to filter out DEGs/DEPs/DEMs in different comparisons and probe enriched pathways. This is a useful way to make biological sense of the data. Two types of the enrichment analysis are available: gene set enrichment analysis and over-representation analysis. Beyond the standard Gene Set Enrichment Analysis, users can upload RNA, protein or metabolic data alone, or together with each other, and our system can perform combined multiomics molecular set enrichment analysis, and highlight the data on KEGG pathways showing all changed genes/proteins and metabolites. Pathway heatmap is also available to visualize enriched pathways across experiments.
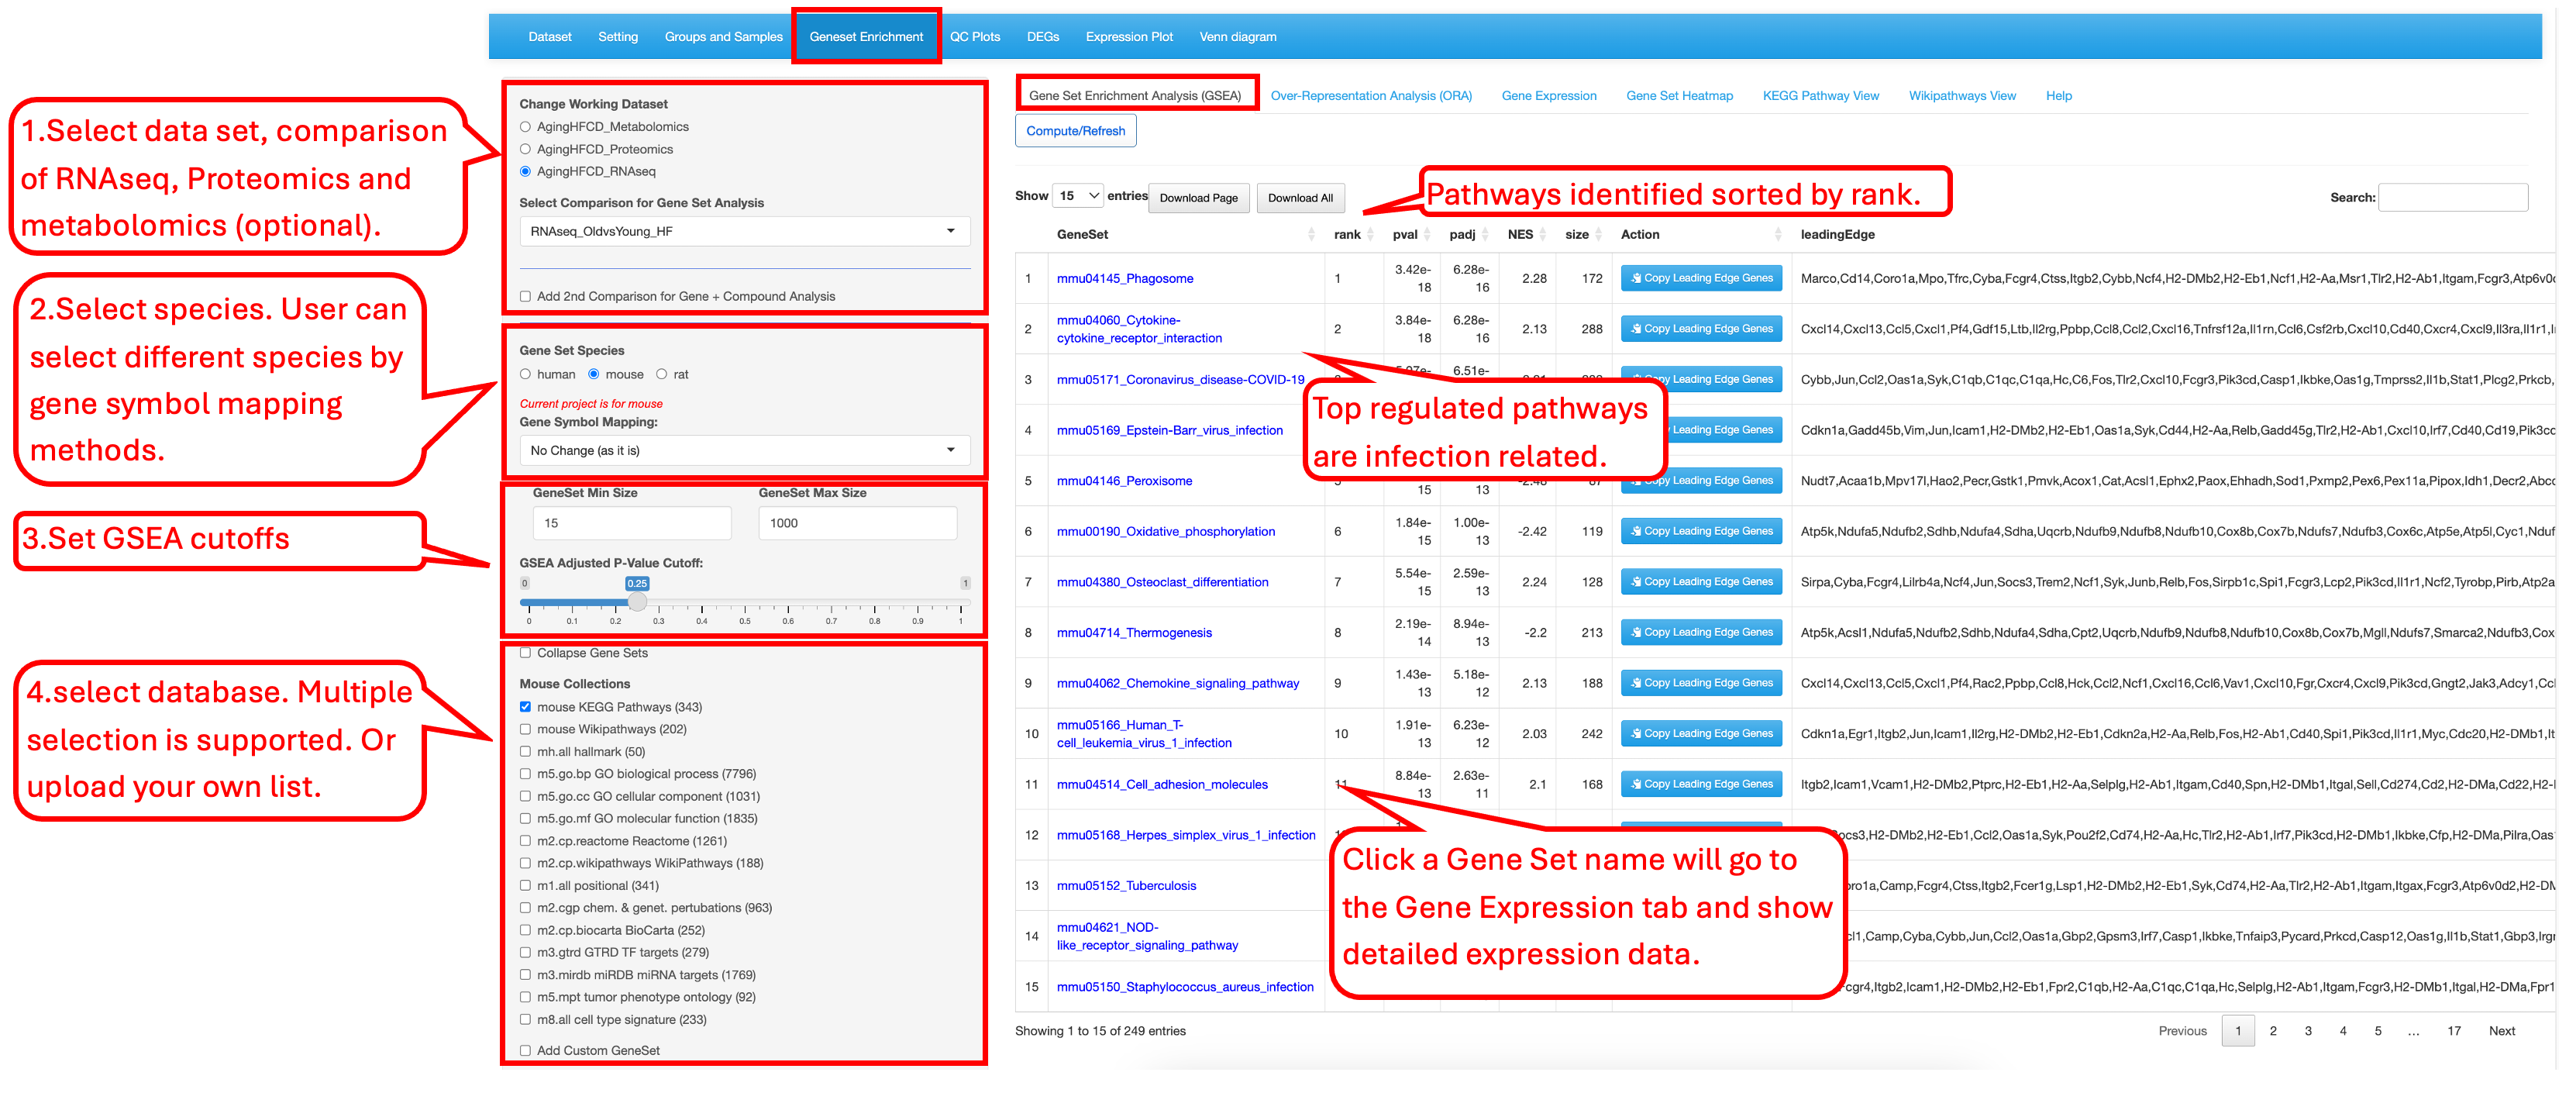
9.1 Gene Set Enrichment Analysis (GSEA)
This first tab allows users to select a specific comparison, choose a species pathway database, set statistical cutoff criteria for the analysis, and select gene set databases from a list of different databases for gene set enrichment analysis (GSEA). The result table displays the ranked GSEA summary. The entries in the first column, GeneSet, are clickable. Clicking on a gene set name opens the third tab, Gene Expression, which shows detailed results for the selected gene set.
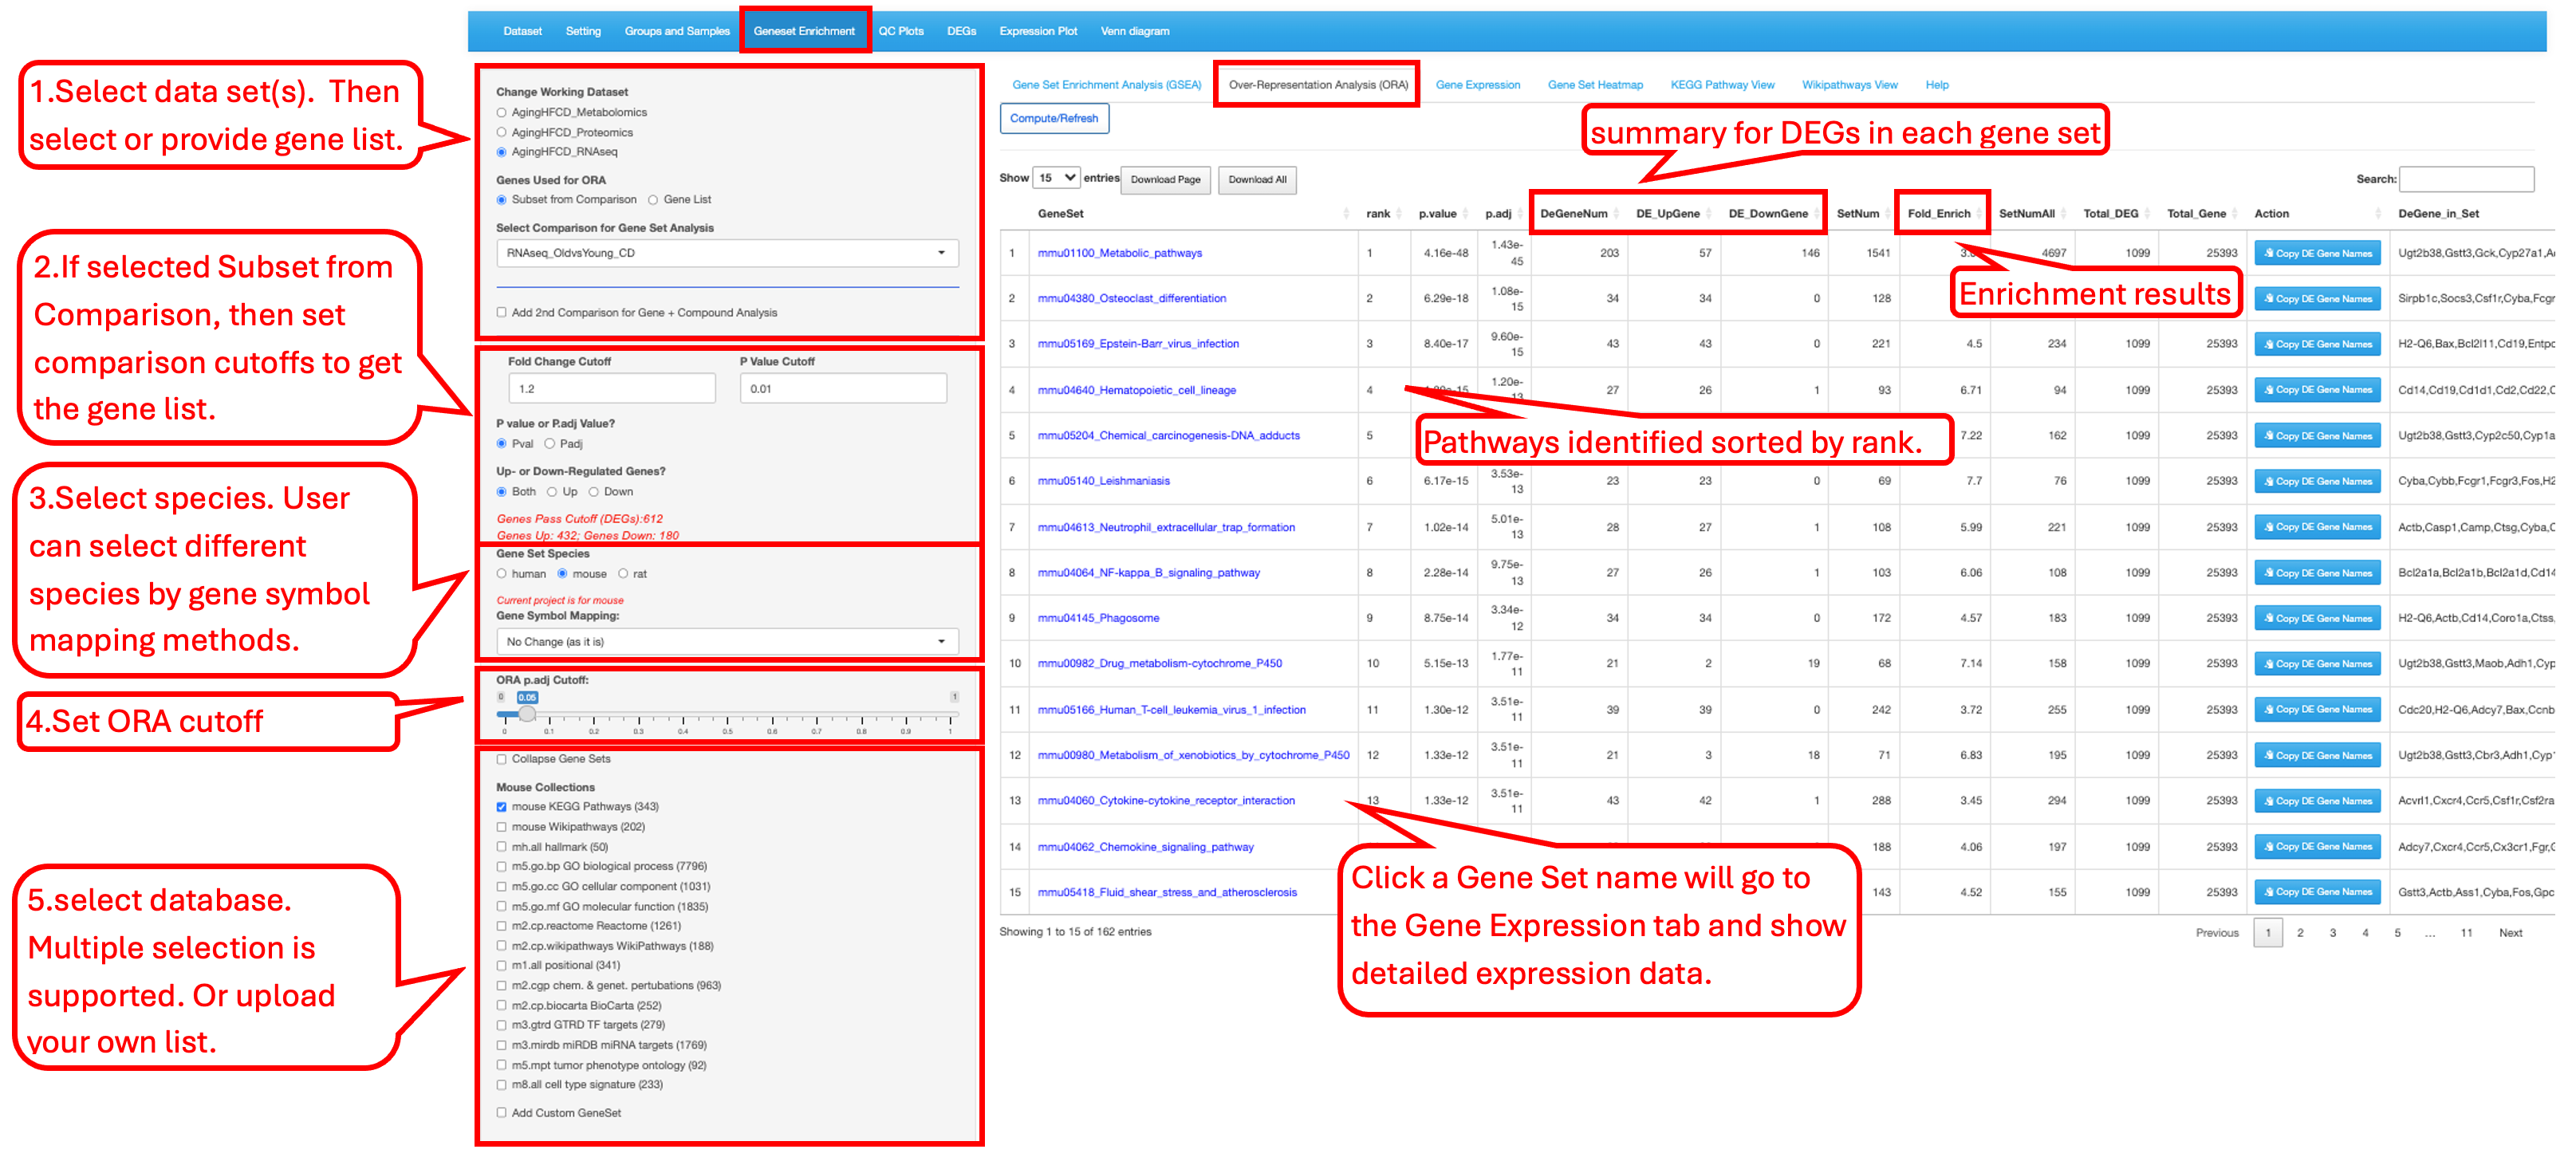
9.2 Over-Representation Analysis (ORA)
This tab allows users to test a gene list by either selecting a specific comparison with predefined cutoffs or providing a customized gene list. Users can then choose a species pathway database, set statistical cutoff criteria for the analysis, and select gene set databases from a list of options for over-representation analysis (ORA).
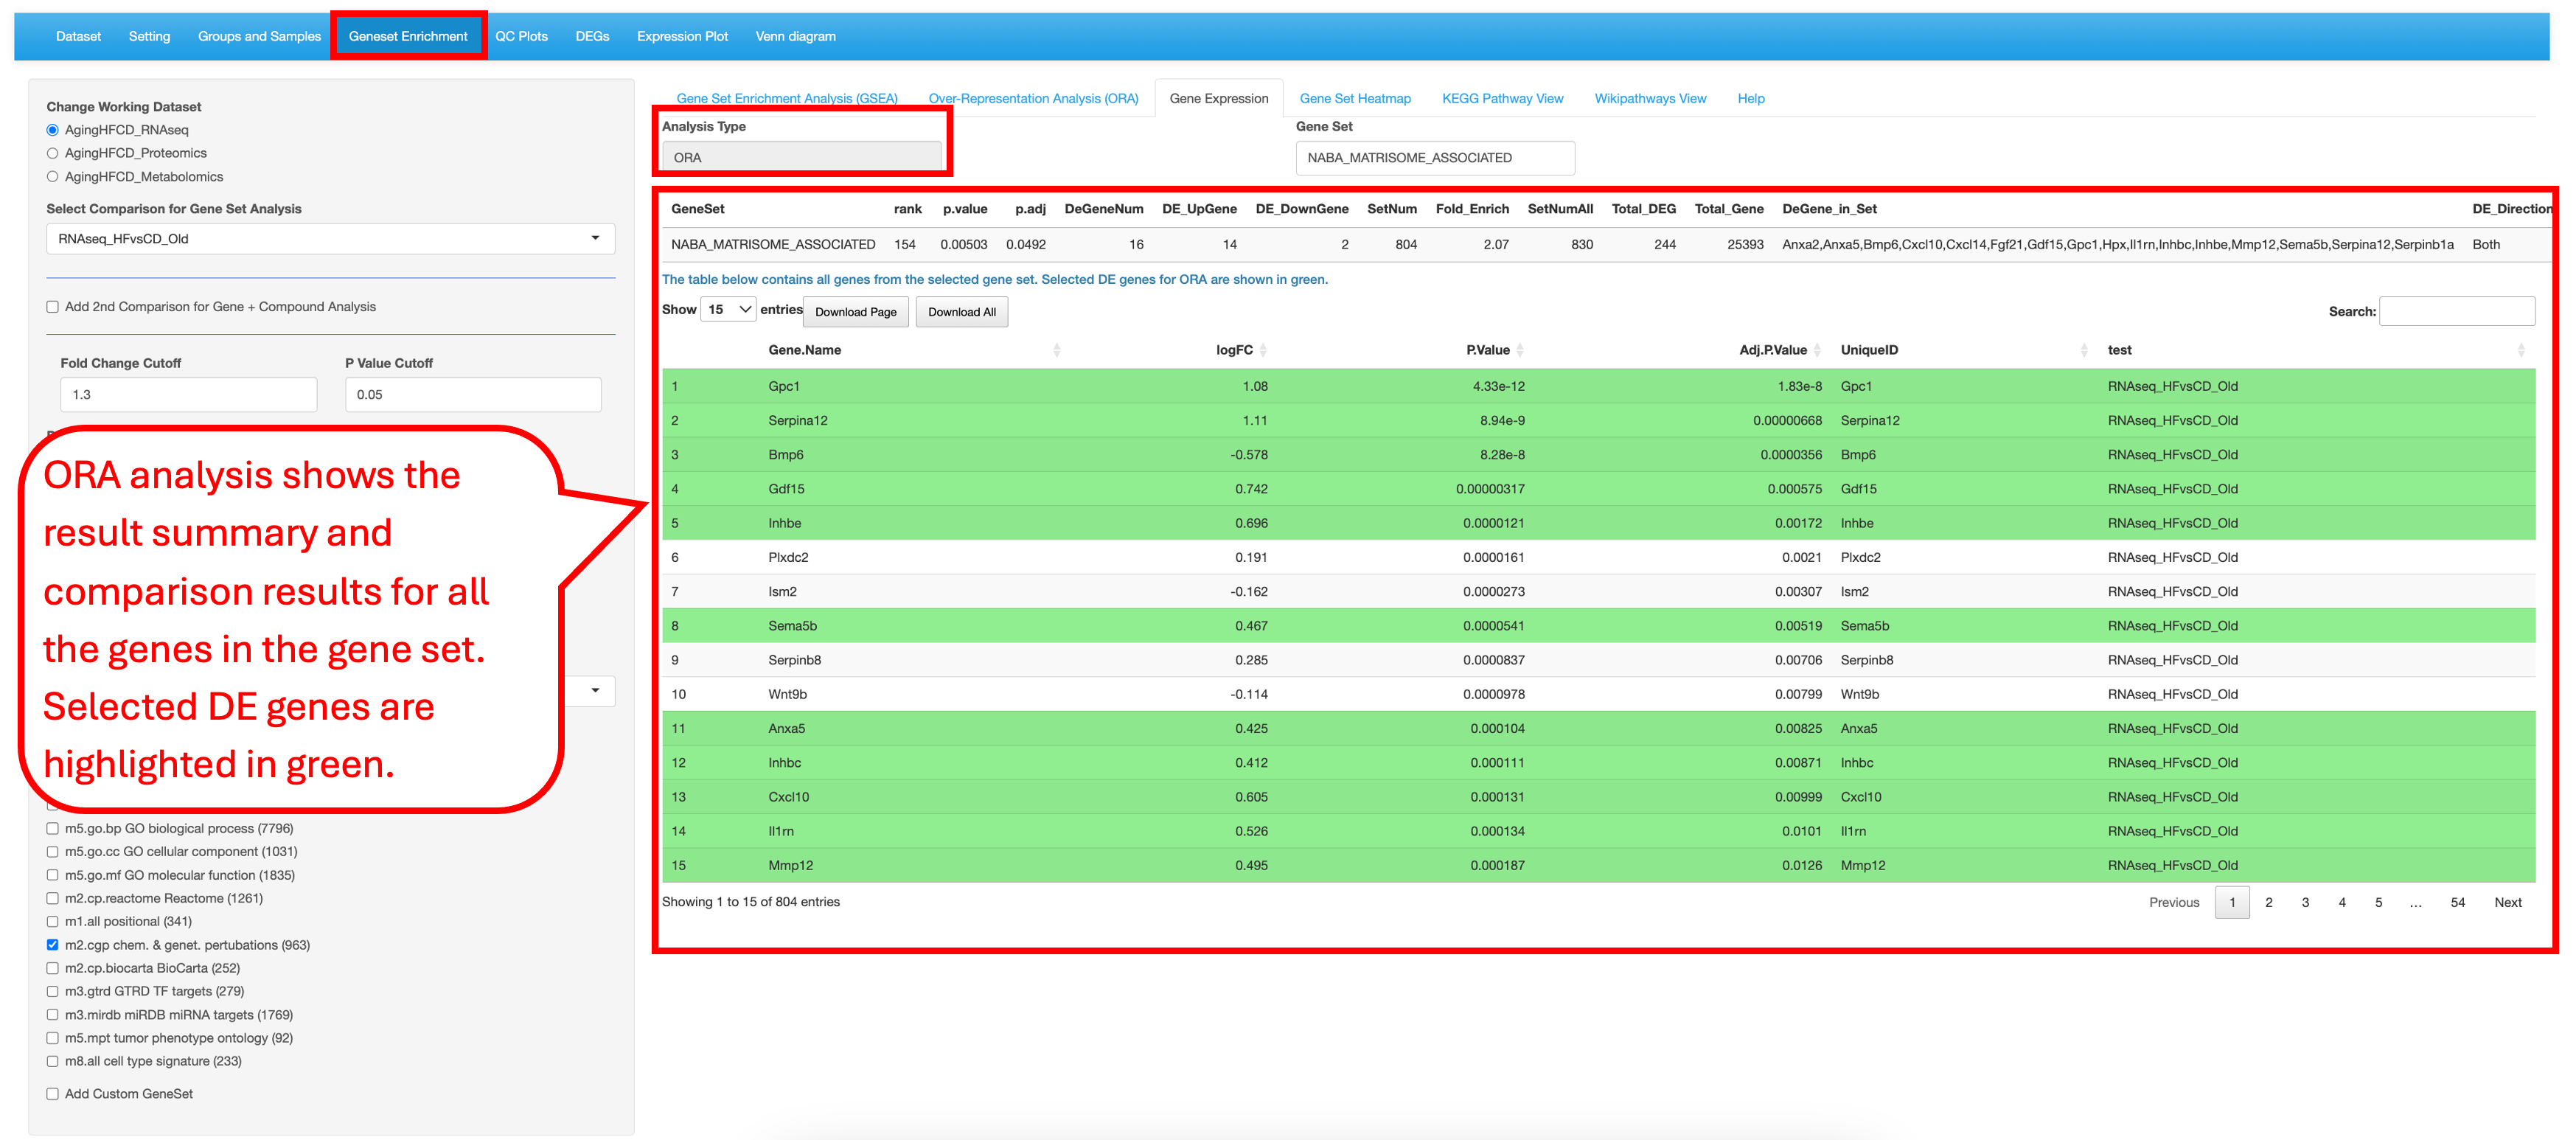
When using a gene list selected from a comparison with cutoffs, the result summary table reports the numbers of total DEGs, up-regulated DEGs, and down-regulated DEGs present in each gene set. The first column GeneSet entries in the table is clickable and links to the 3rd tab Gene Expression and show the detailed result of the selected gene set.
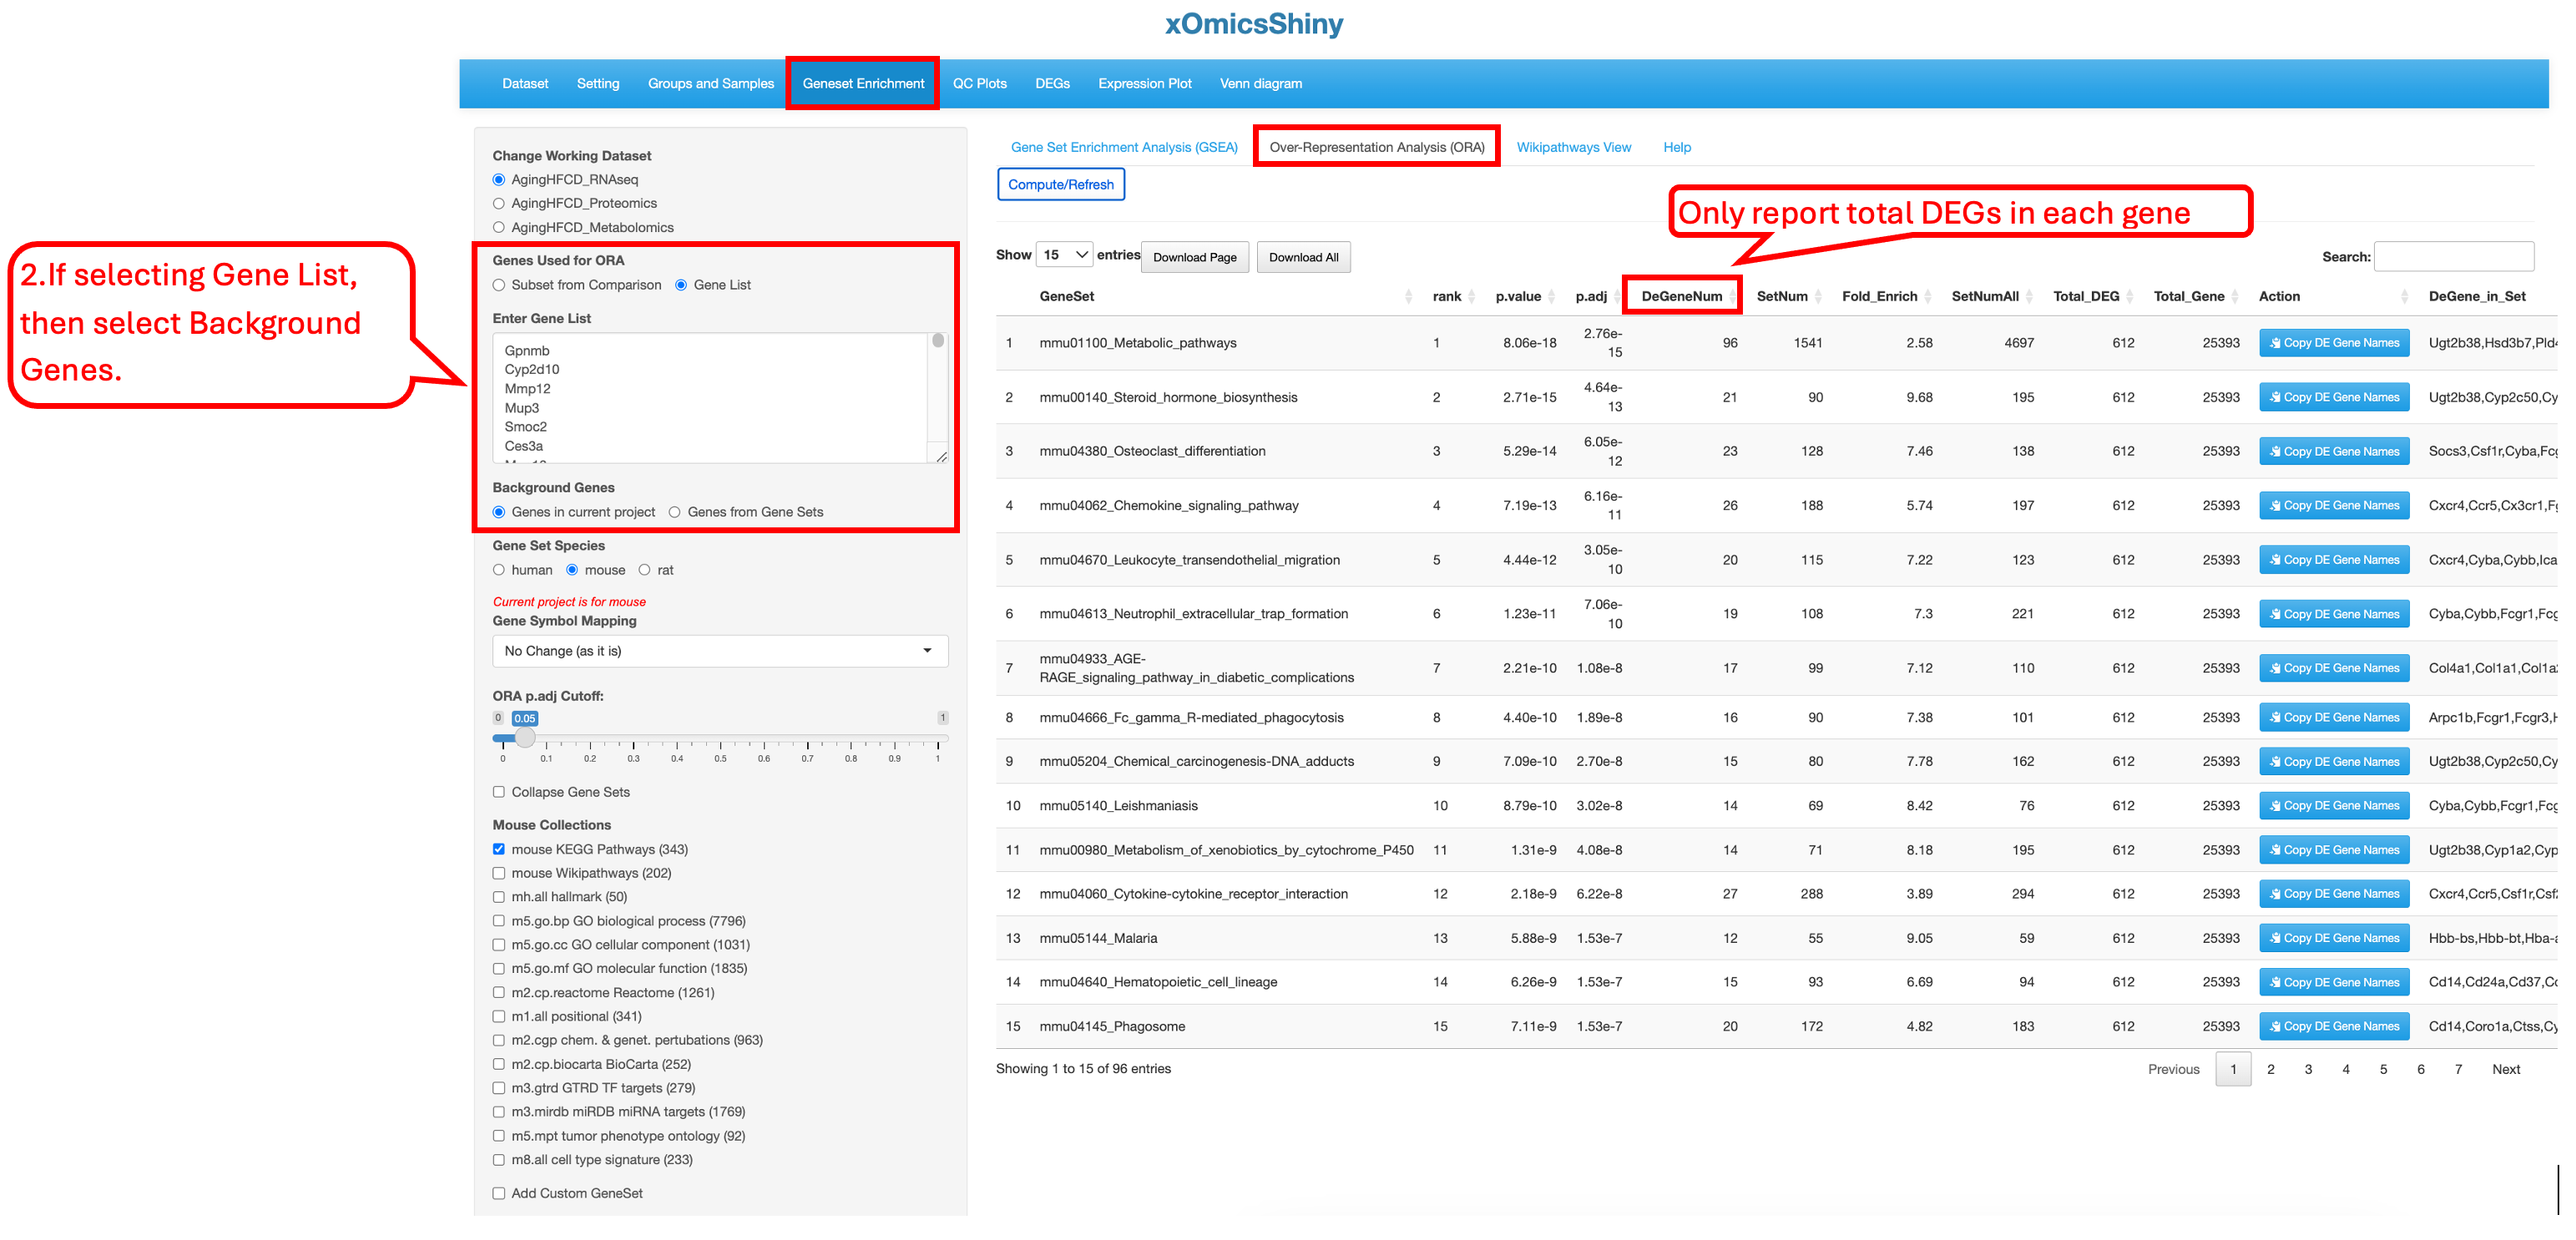
When using a customized gene list, no comparison data is retrieved, so the result summary table reports only the number of total DEGs present in each gene set.
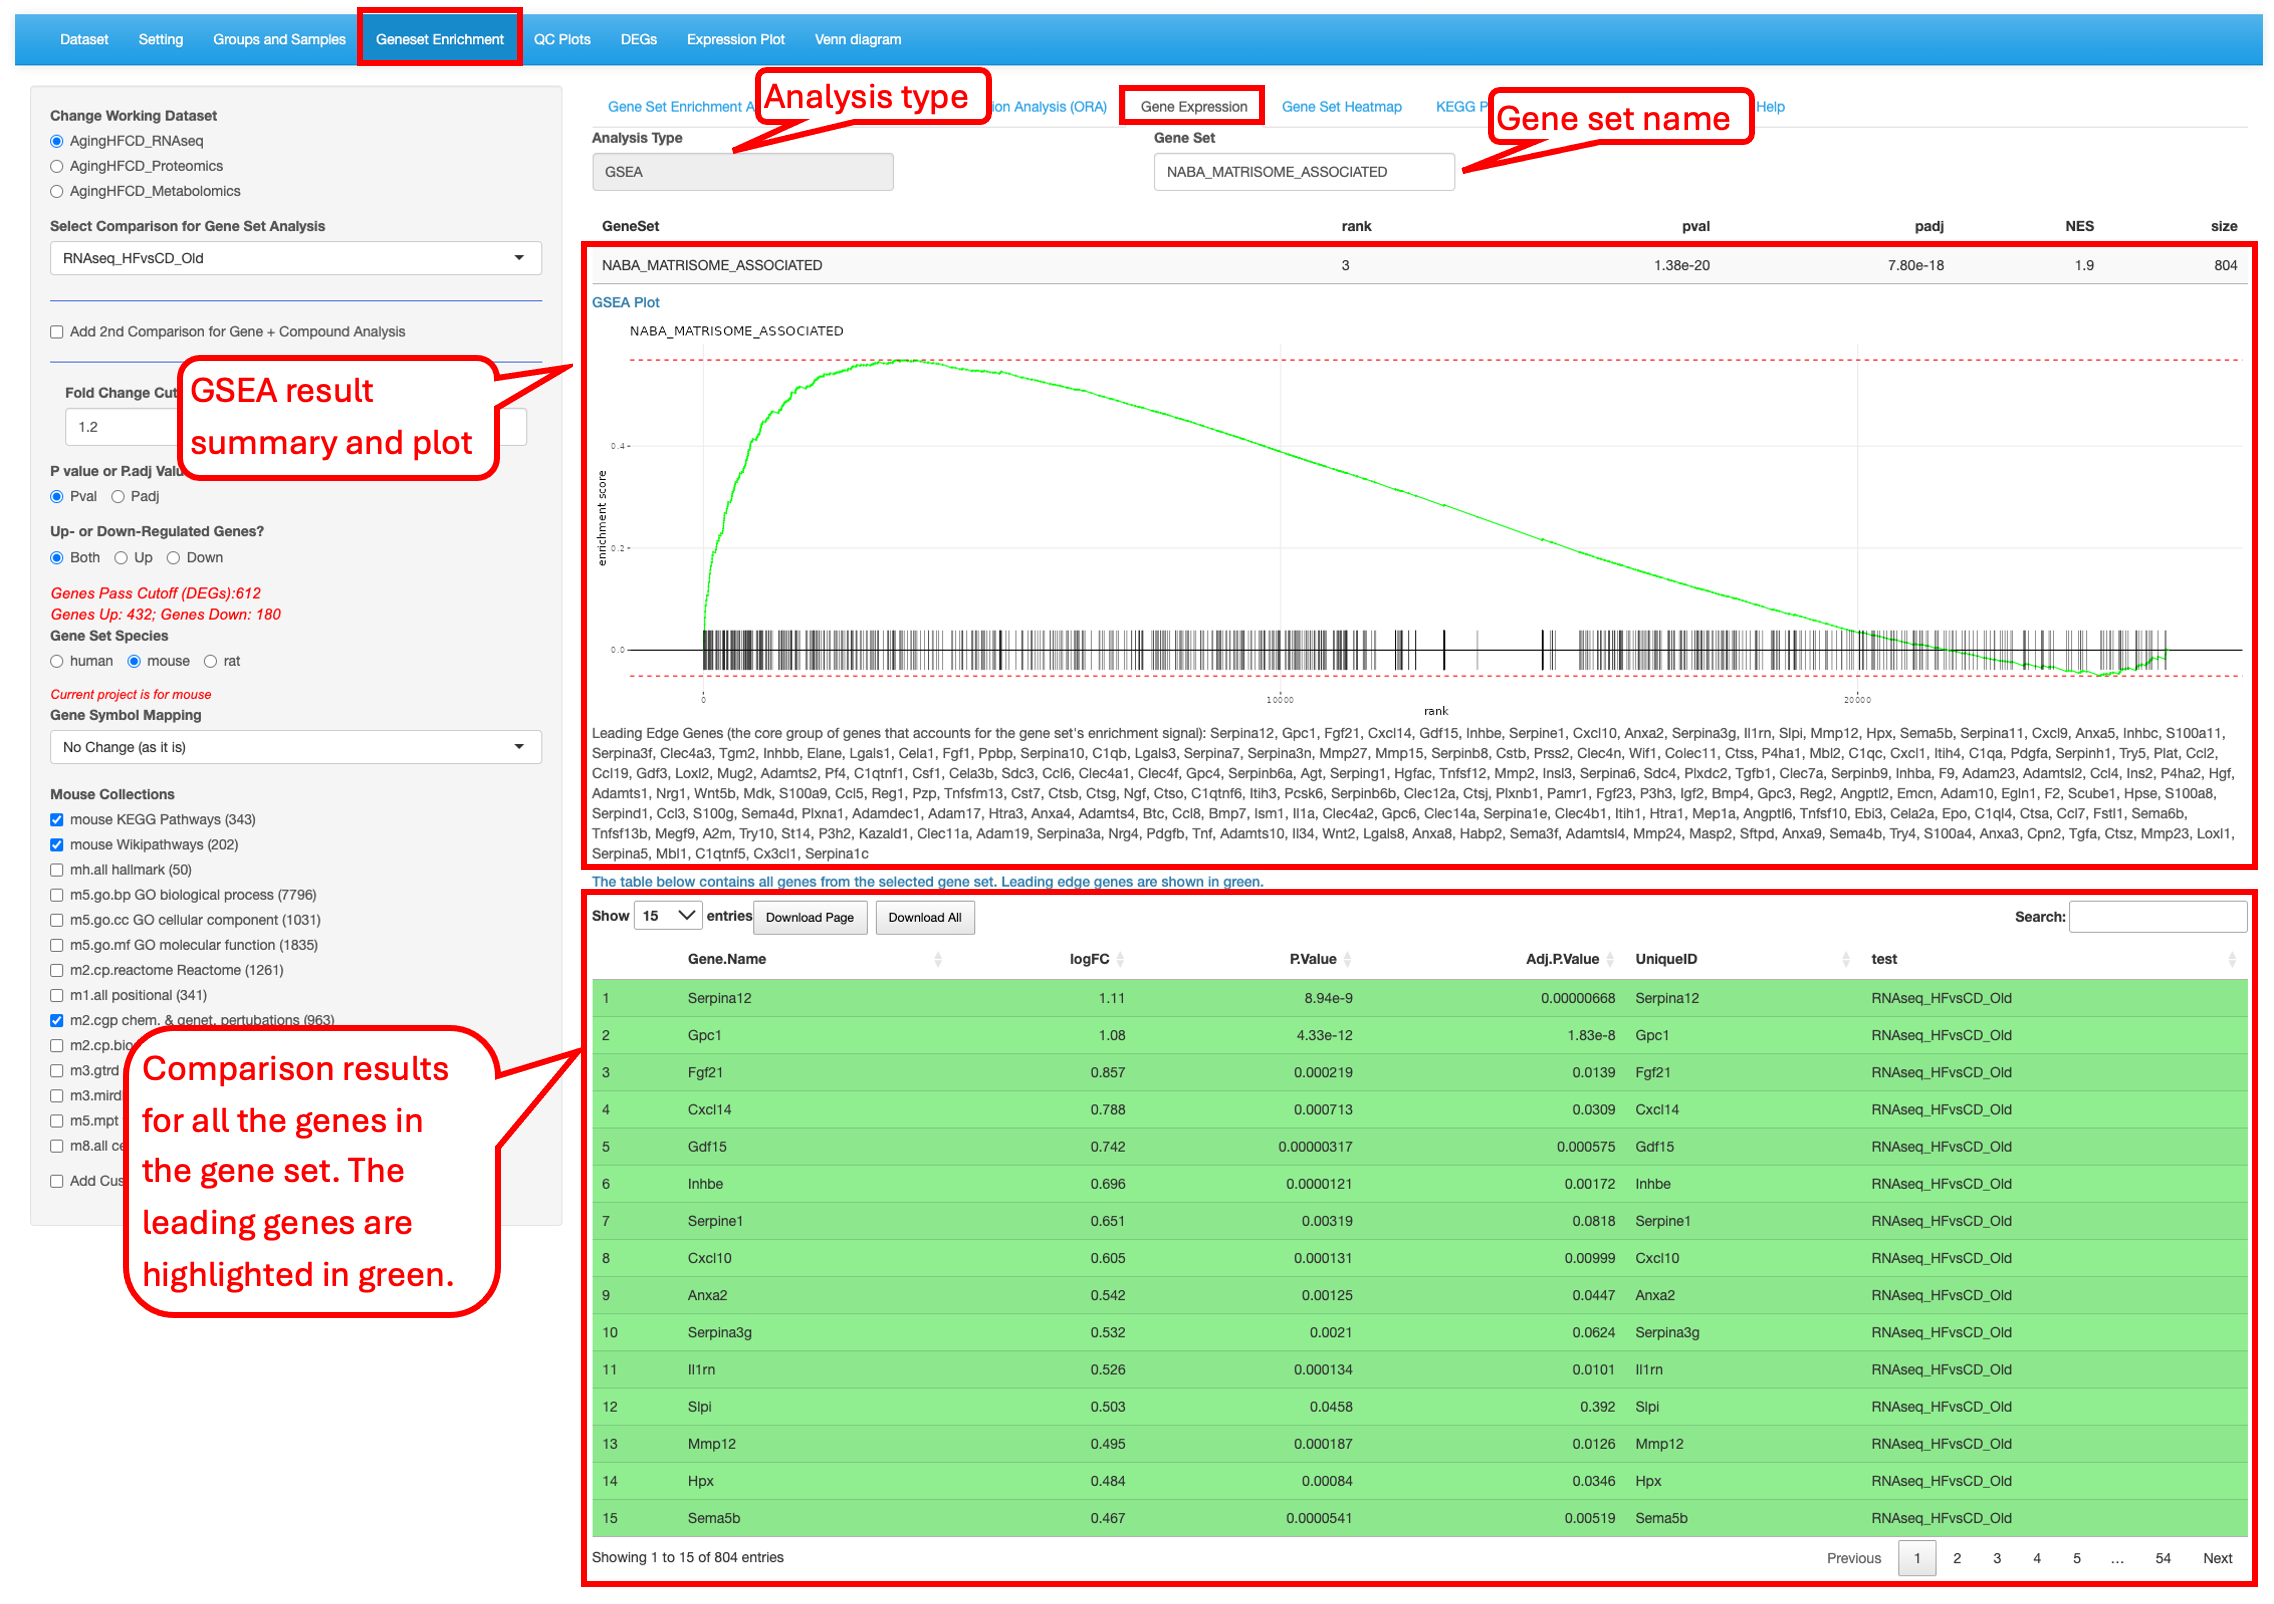
9.3 Gene Expression
For the enriched gene sets identified in the previous tabs (GSEA and ORA), users have the ability to look at the differential values of the genes present in the set. Here we are probing the Naba matrisome associated gene set reported in the reference to show significant difference between the high-fiber and control-diet groups in aged group.
The page looks a bit different for the ORA analysis result. It does not have the enrichment plot.
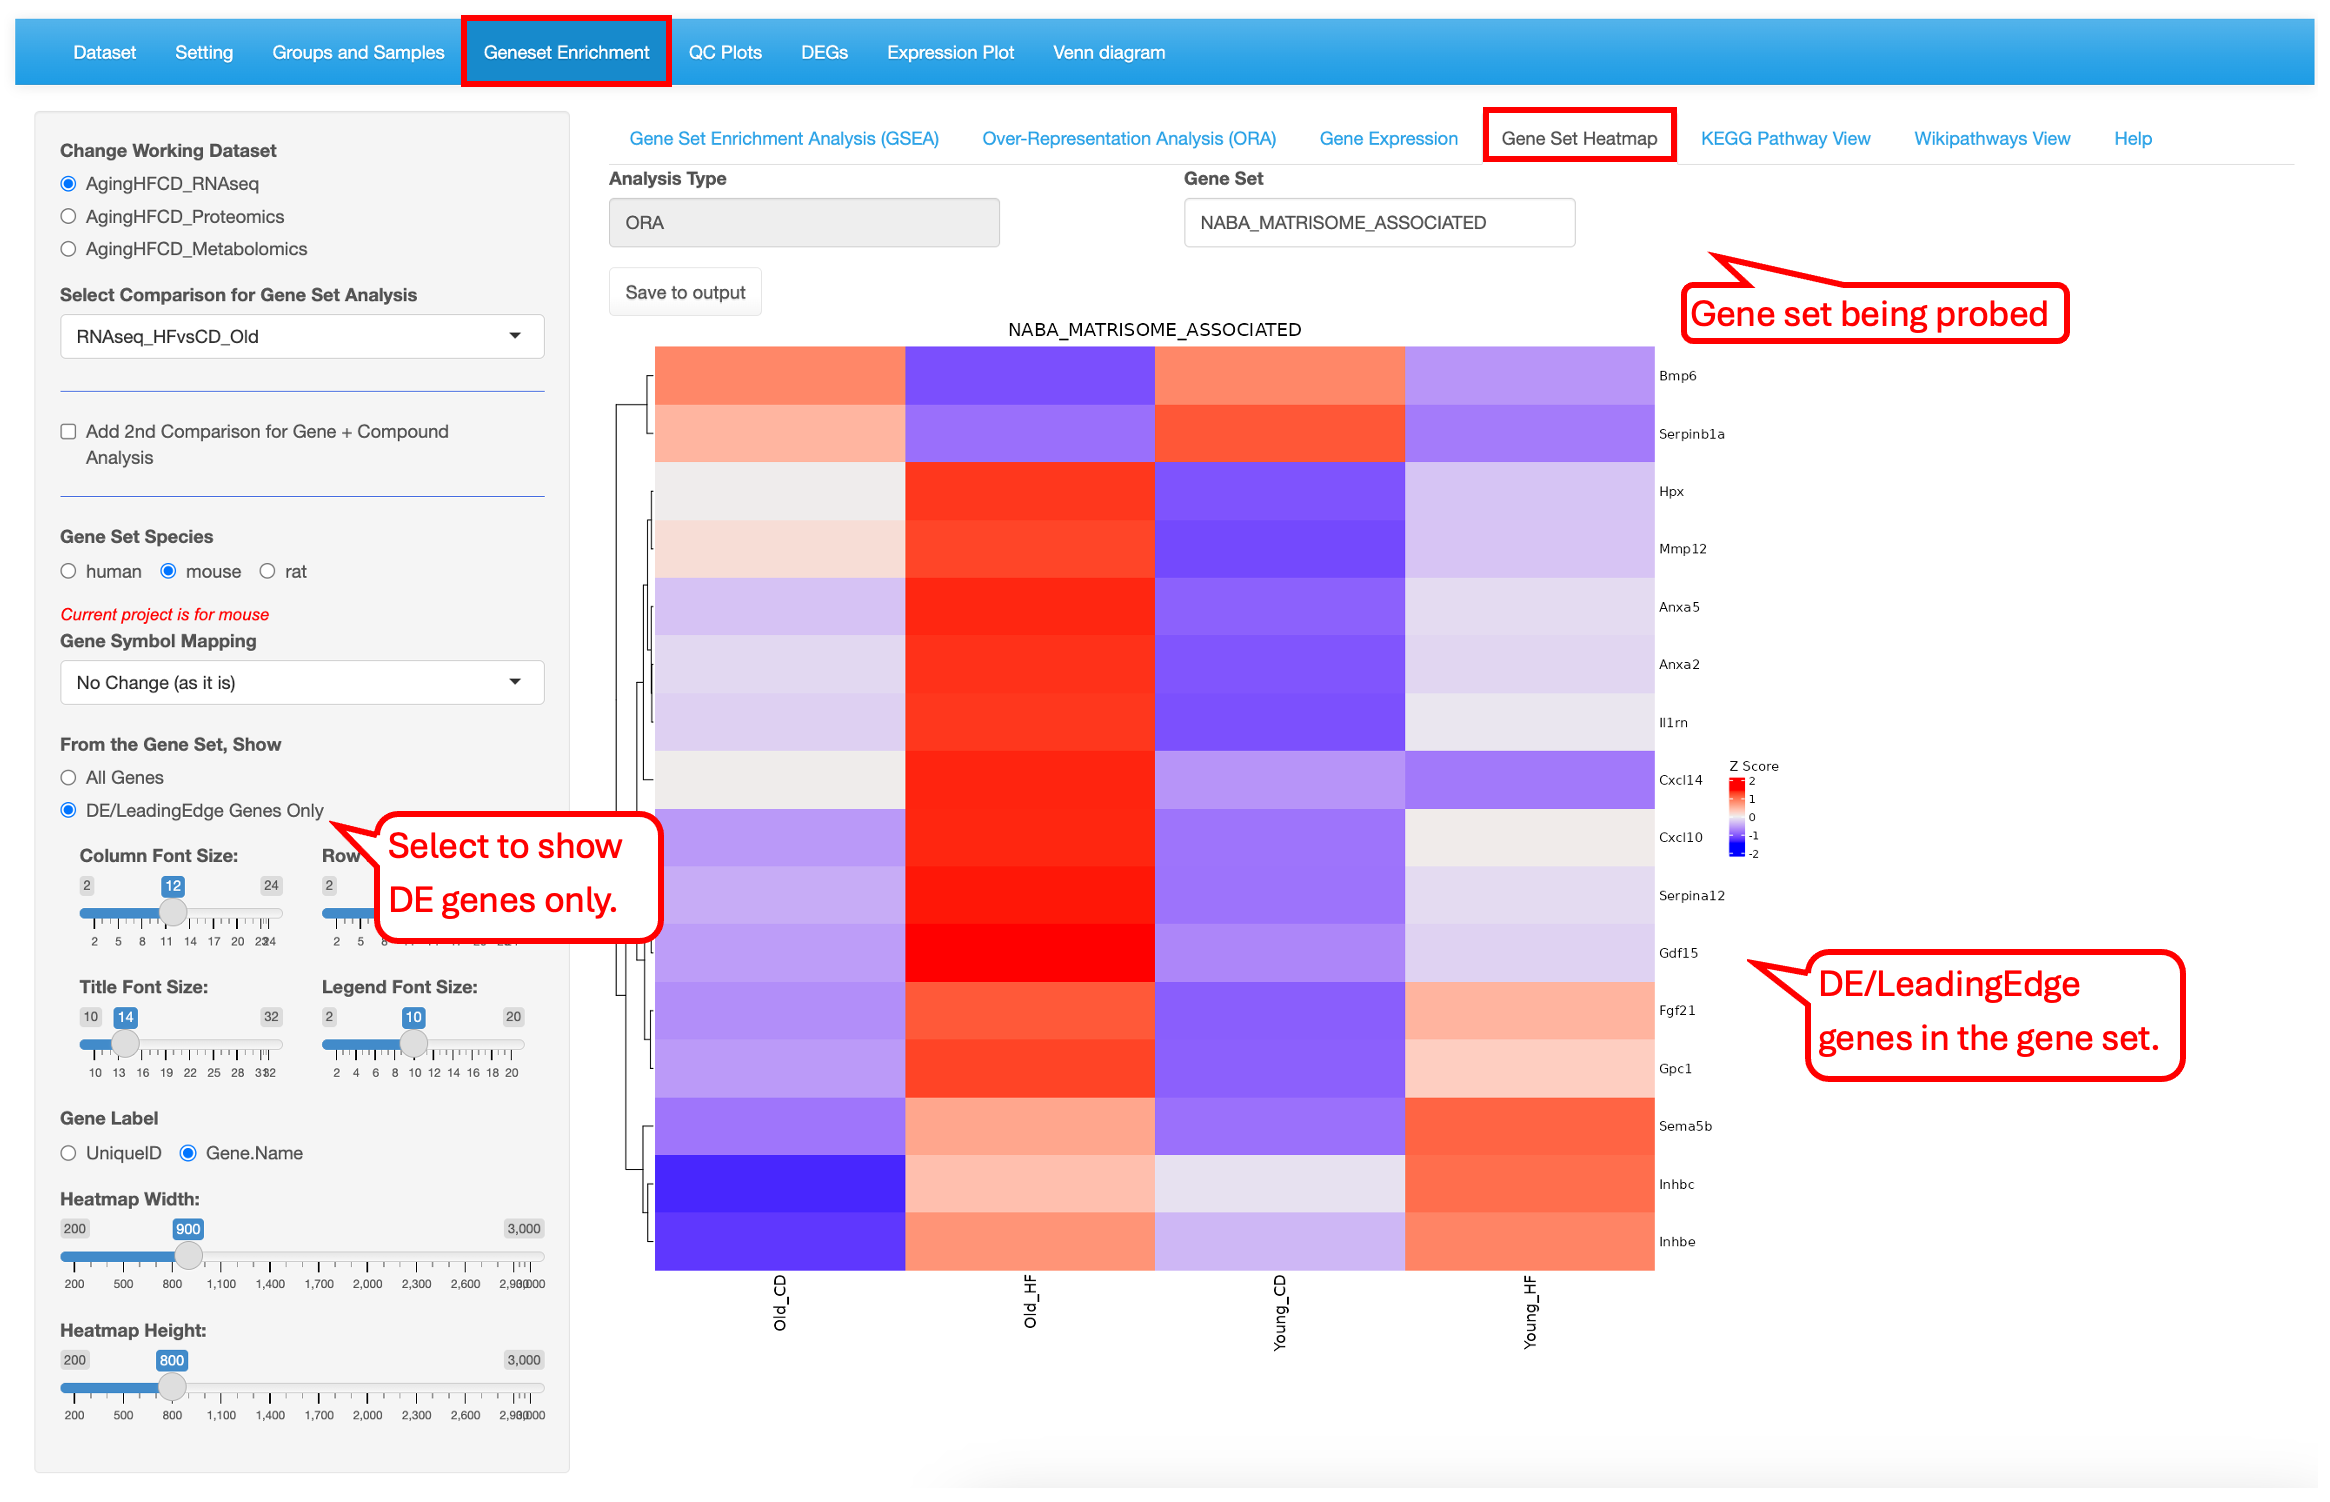
9.4 Gene Set Heatmap
Like the Gene Expression tab, users have the ability to plot expression of the genes in the pathway term selected as a heatmap. The plot can use all the genes in the gene set or just the leading/DE genes.This visualization shows that almost all the Naba_matrisome-associated DE genes are highly expressed in Old_HF group.
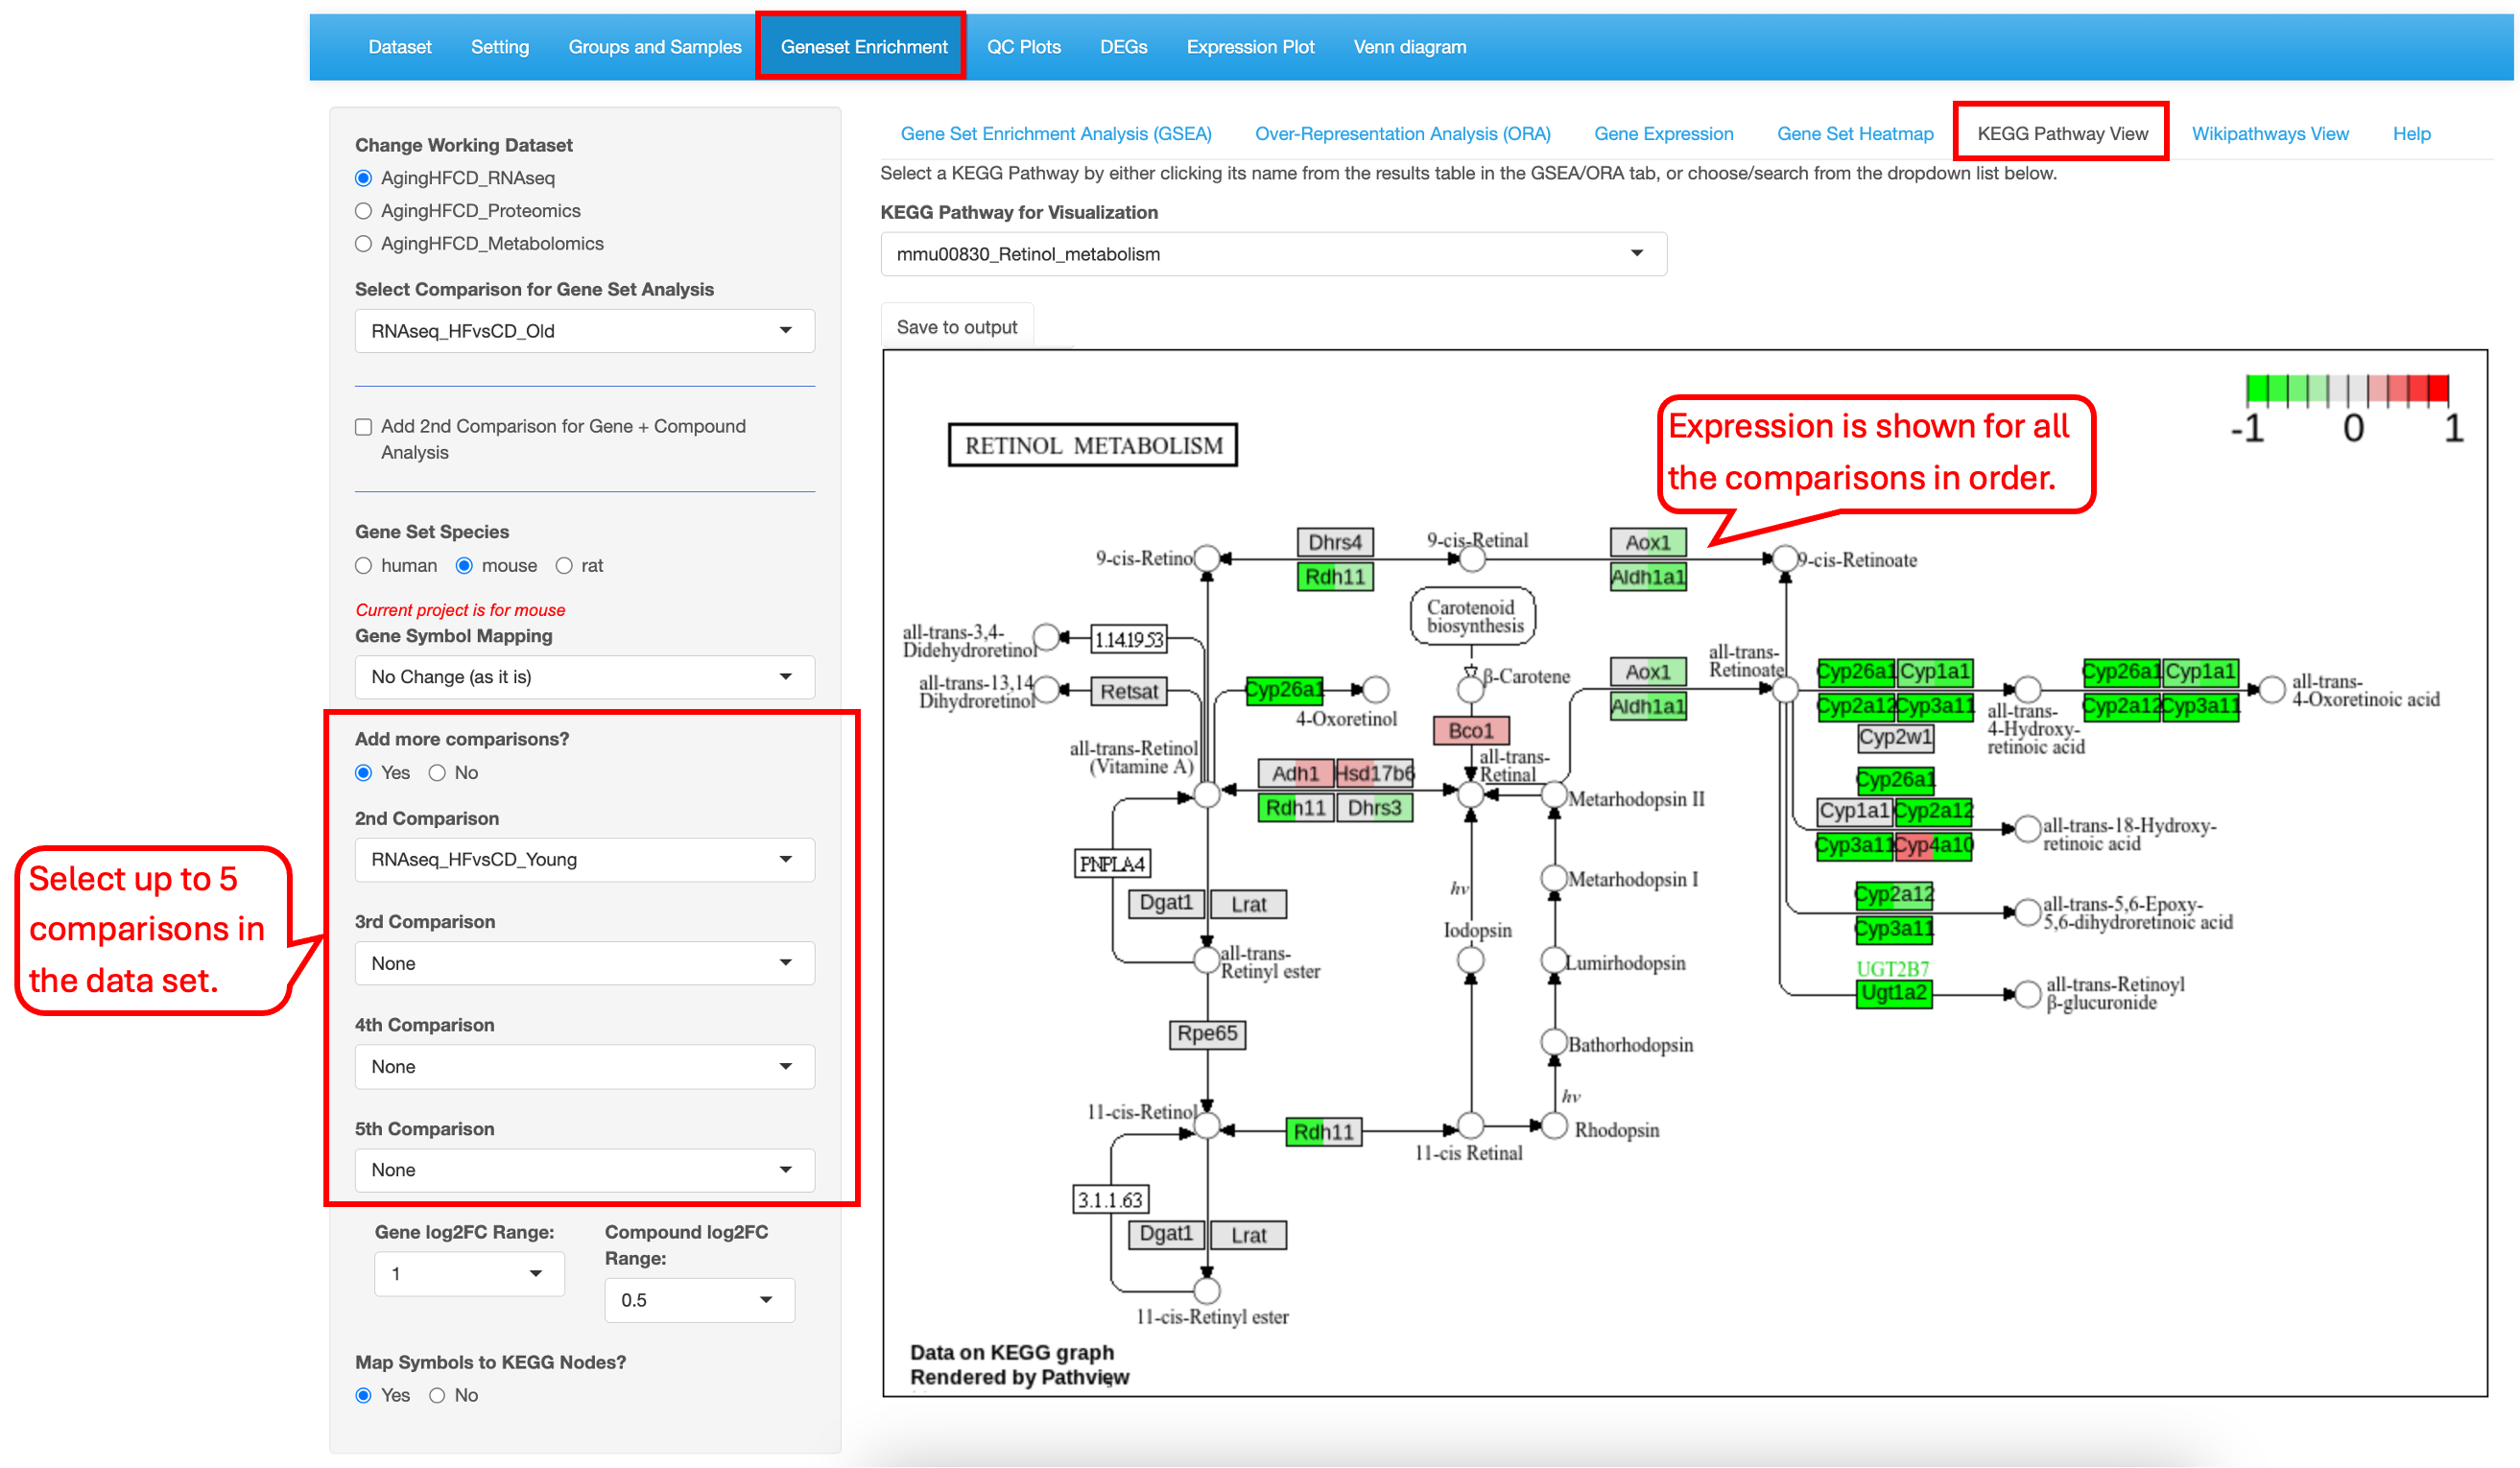
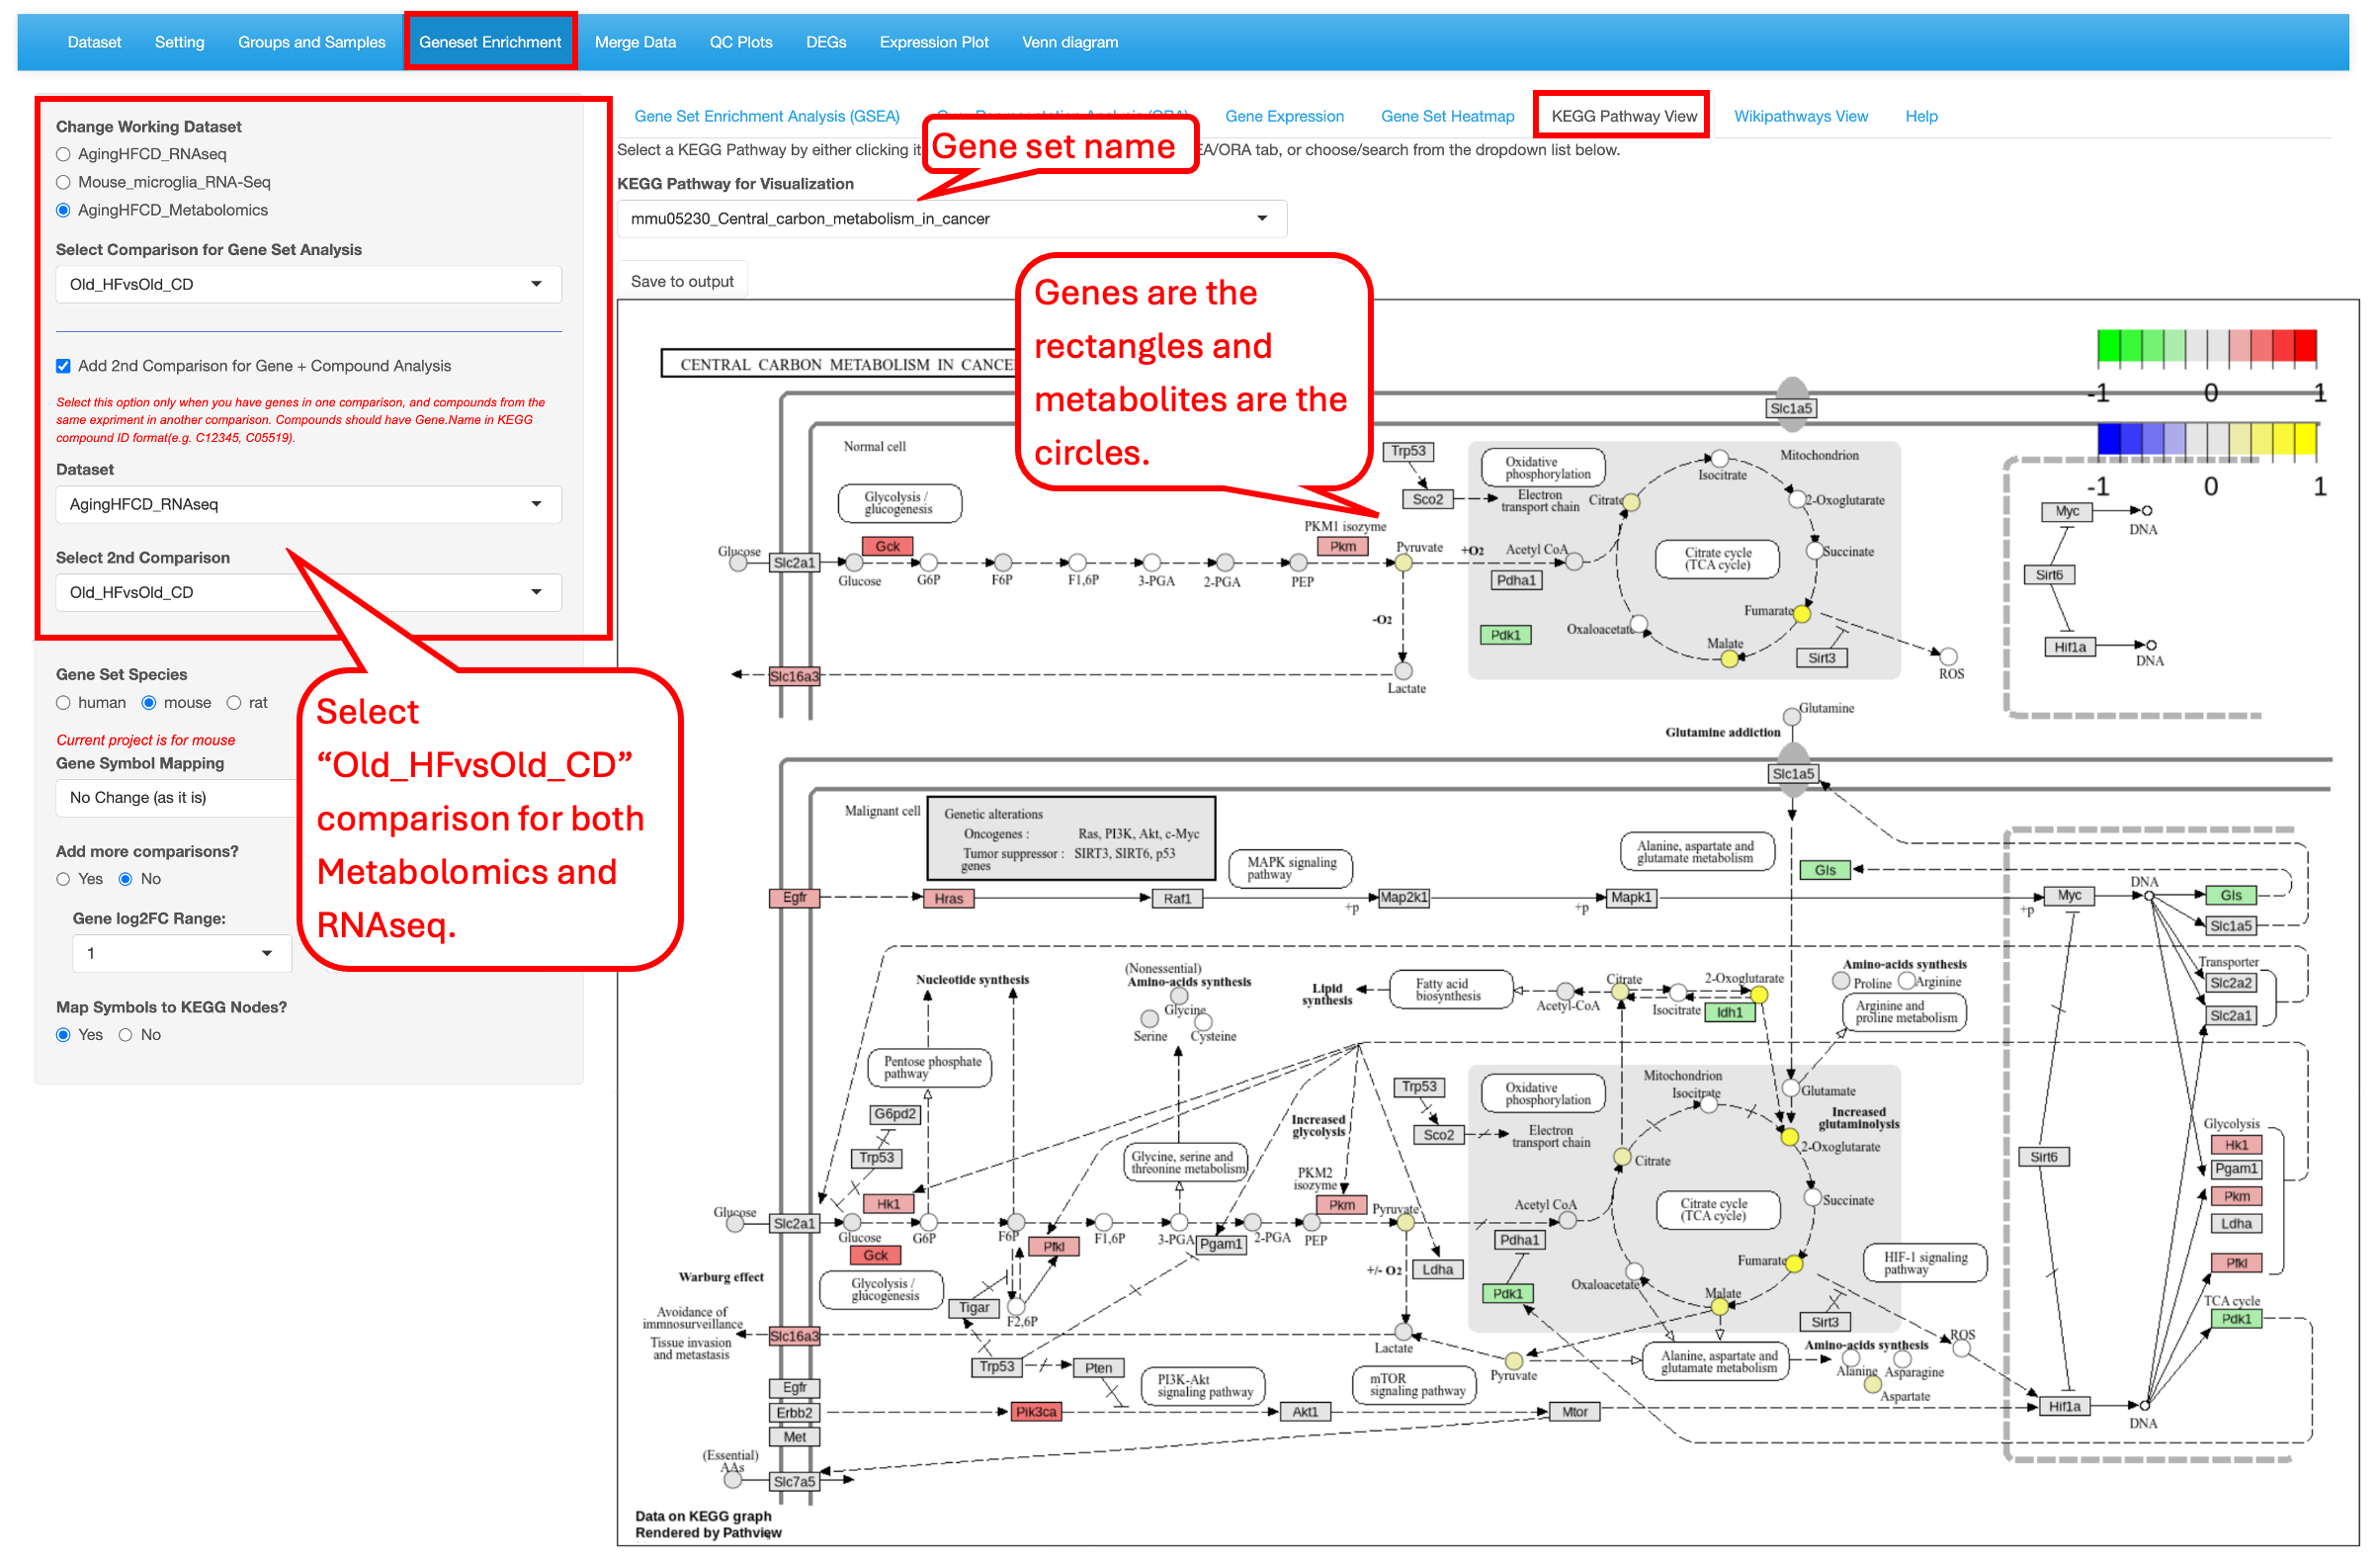
9.5 KEGG Pathway View
This functionality is available only to KEGG pathway terms. Users have the option to view the Fold Change levels of different genes in the KEGG pathway map. If only one type of source comparison is used, users can select for up to 5 comparisons.
Or users can select a comparison from different data sources (RNAseq, proteomics or metabolomics data). In this example we demo the KEGG pathway “mmu05230 central carbon metabolism in cancer” as identified as top 1 gene set in the Metabolite_HFvsCD_Old comparison.
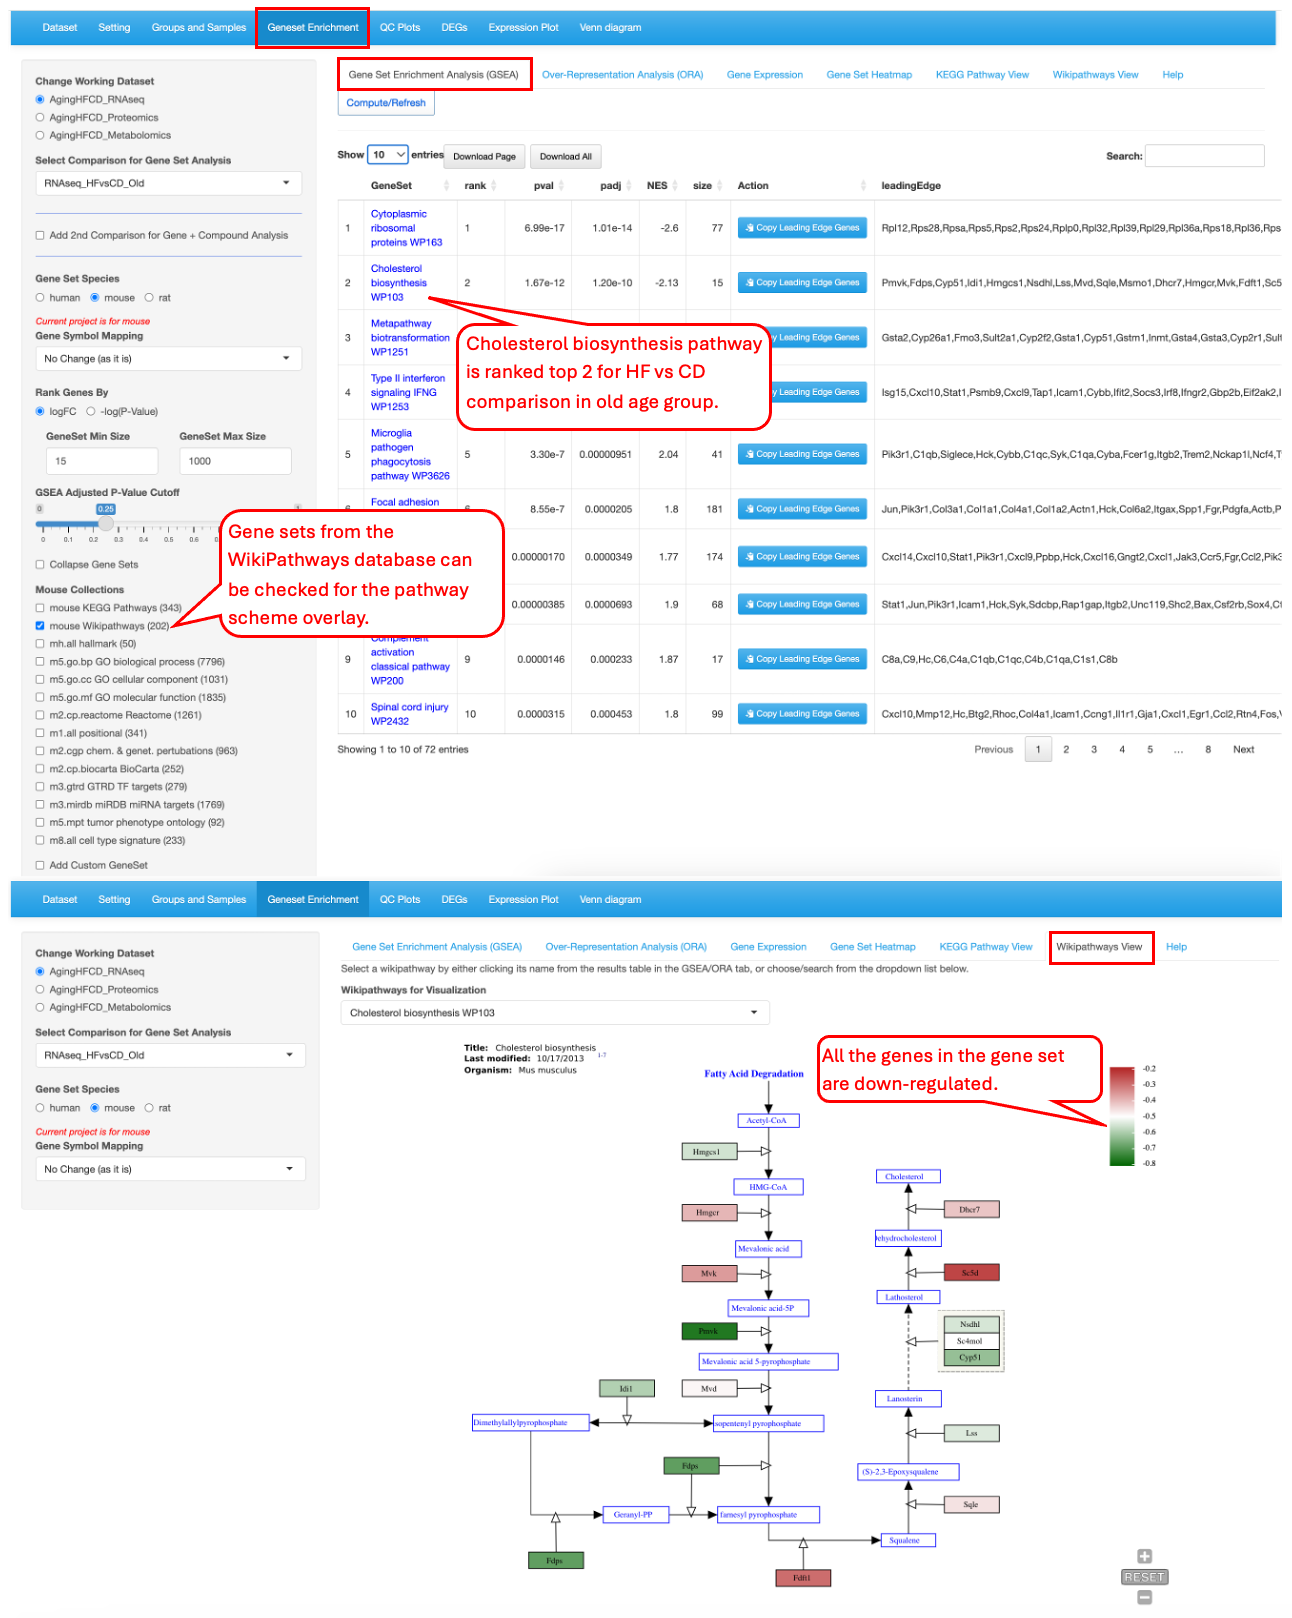
9.6 WikiPathway View
This functionality is similar to the “KEGG Pathway View” but it is for the gene set visualization in the WikiPathways database. In this example we demo the Wiki pathway “Cholesterol biosynthesis WP103” as identified as top 2 gene set in the RNAseq_HFvsCD_Old comparison. It clearly shows that all the genes in the gene set are down-regulated in the high-fiber group.