Chapter 1 Introduction
xOmicsShiny demo version can be accessed via the link https://xomicsshiny.bxgenomics.com/.
XOmicsShiny is an R Shiny application for cross-omics data analysis and pathway mapping. RNAseq, Proteomics and Metabolomics data are supported in both individual and integrated way to visualize statistical analysis results. In order to support metabolomic data, we have built a metabolite database by combining multiple databases and building look-up tables across various ID formats. There are over 263K unique metabolites extracted from databases Pubchem, KEGG, HMDB, SMPDB, Metabolomic Refmet. etc. This tutorial provides a detailed guide on using the different functionalities and customizing the tools to best fit data analysis and plotting needs, using published multiomic dataset as examples (Williams et al., 2022).
1.1 Key features
As an introduction, we summarized the key features of xOmicsShiny, in order to give you a brief overview of this application.
Multi-omics dataset hosting
xOmicsShiny provides a centralized place to host multi-omics data as well as analysis results. Data types such as RNAseq, Proteomics and Metabolomics need to be processed into expression values and differential expression analysis results (i.e., comparison results) before being imported into xOmicsShiny. Users can upload the expression values of genes or compounds, metadata information associated with the study, and the comparison results including fold change (FC) and p-values (or adjusted p-values). More details can be found in Chapter 3.
Flexible data navigation
xOmicsShiny offers plenty of data navigation and visualization tools for you to understand the QC, differential expressed genes/proteins/compounds, and pathway enrichment results. Users can easily use the on-the-fly plot generation functions in the application, with more details provided in Chapter 5, 6, 7, 8, 9, etc.
Easy comparison of DE results
xOmicsShiny has several ways to examine the differential expression (DE) results and compare them directly. For example, as described in Chapter 6.4 and 6.5, scatter plots and side-by-side volcano plots are frequently used.
Comparison result merging
Instead of merging the original data, xOmicsShiny features multi-omics data integration at the comparison level, as illustrated in Chapter 18. The merged result will be treated as a new dataset for visualization.
Pathway mapping
Multi-omics data can be visualized seamlessly using several pathway databases on xOmicsShiny, with more details illustrated in Chapter 9.
Analyses critical to drug development
xOmicsShiny also includes several modules that provide analysis related to drug development, as described in Chapter 15, 16, 17.
Overall, xOmicsShiny provides tremendous flexibility to handle multi-omics data. We suggest users keep the key features mentioned above in mind, and gradually follow this full tutorial to understand these functions step by step.
1.2 Main interface
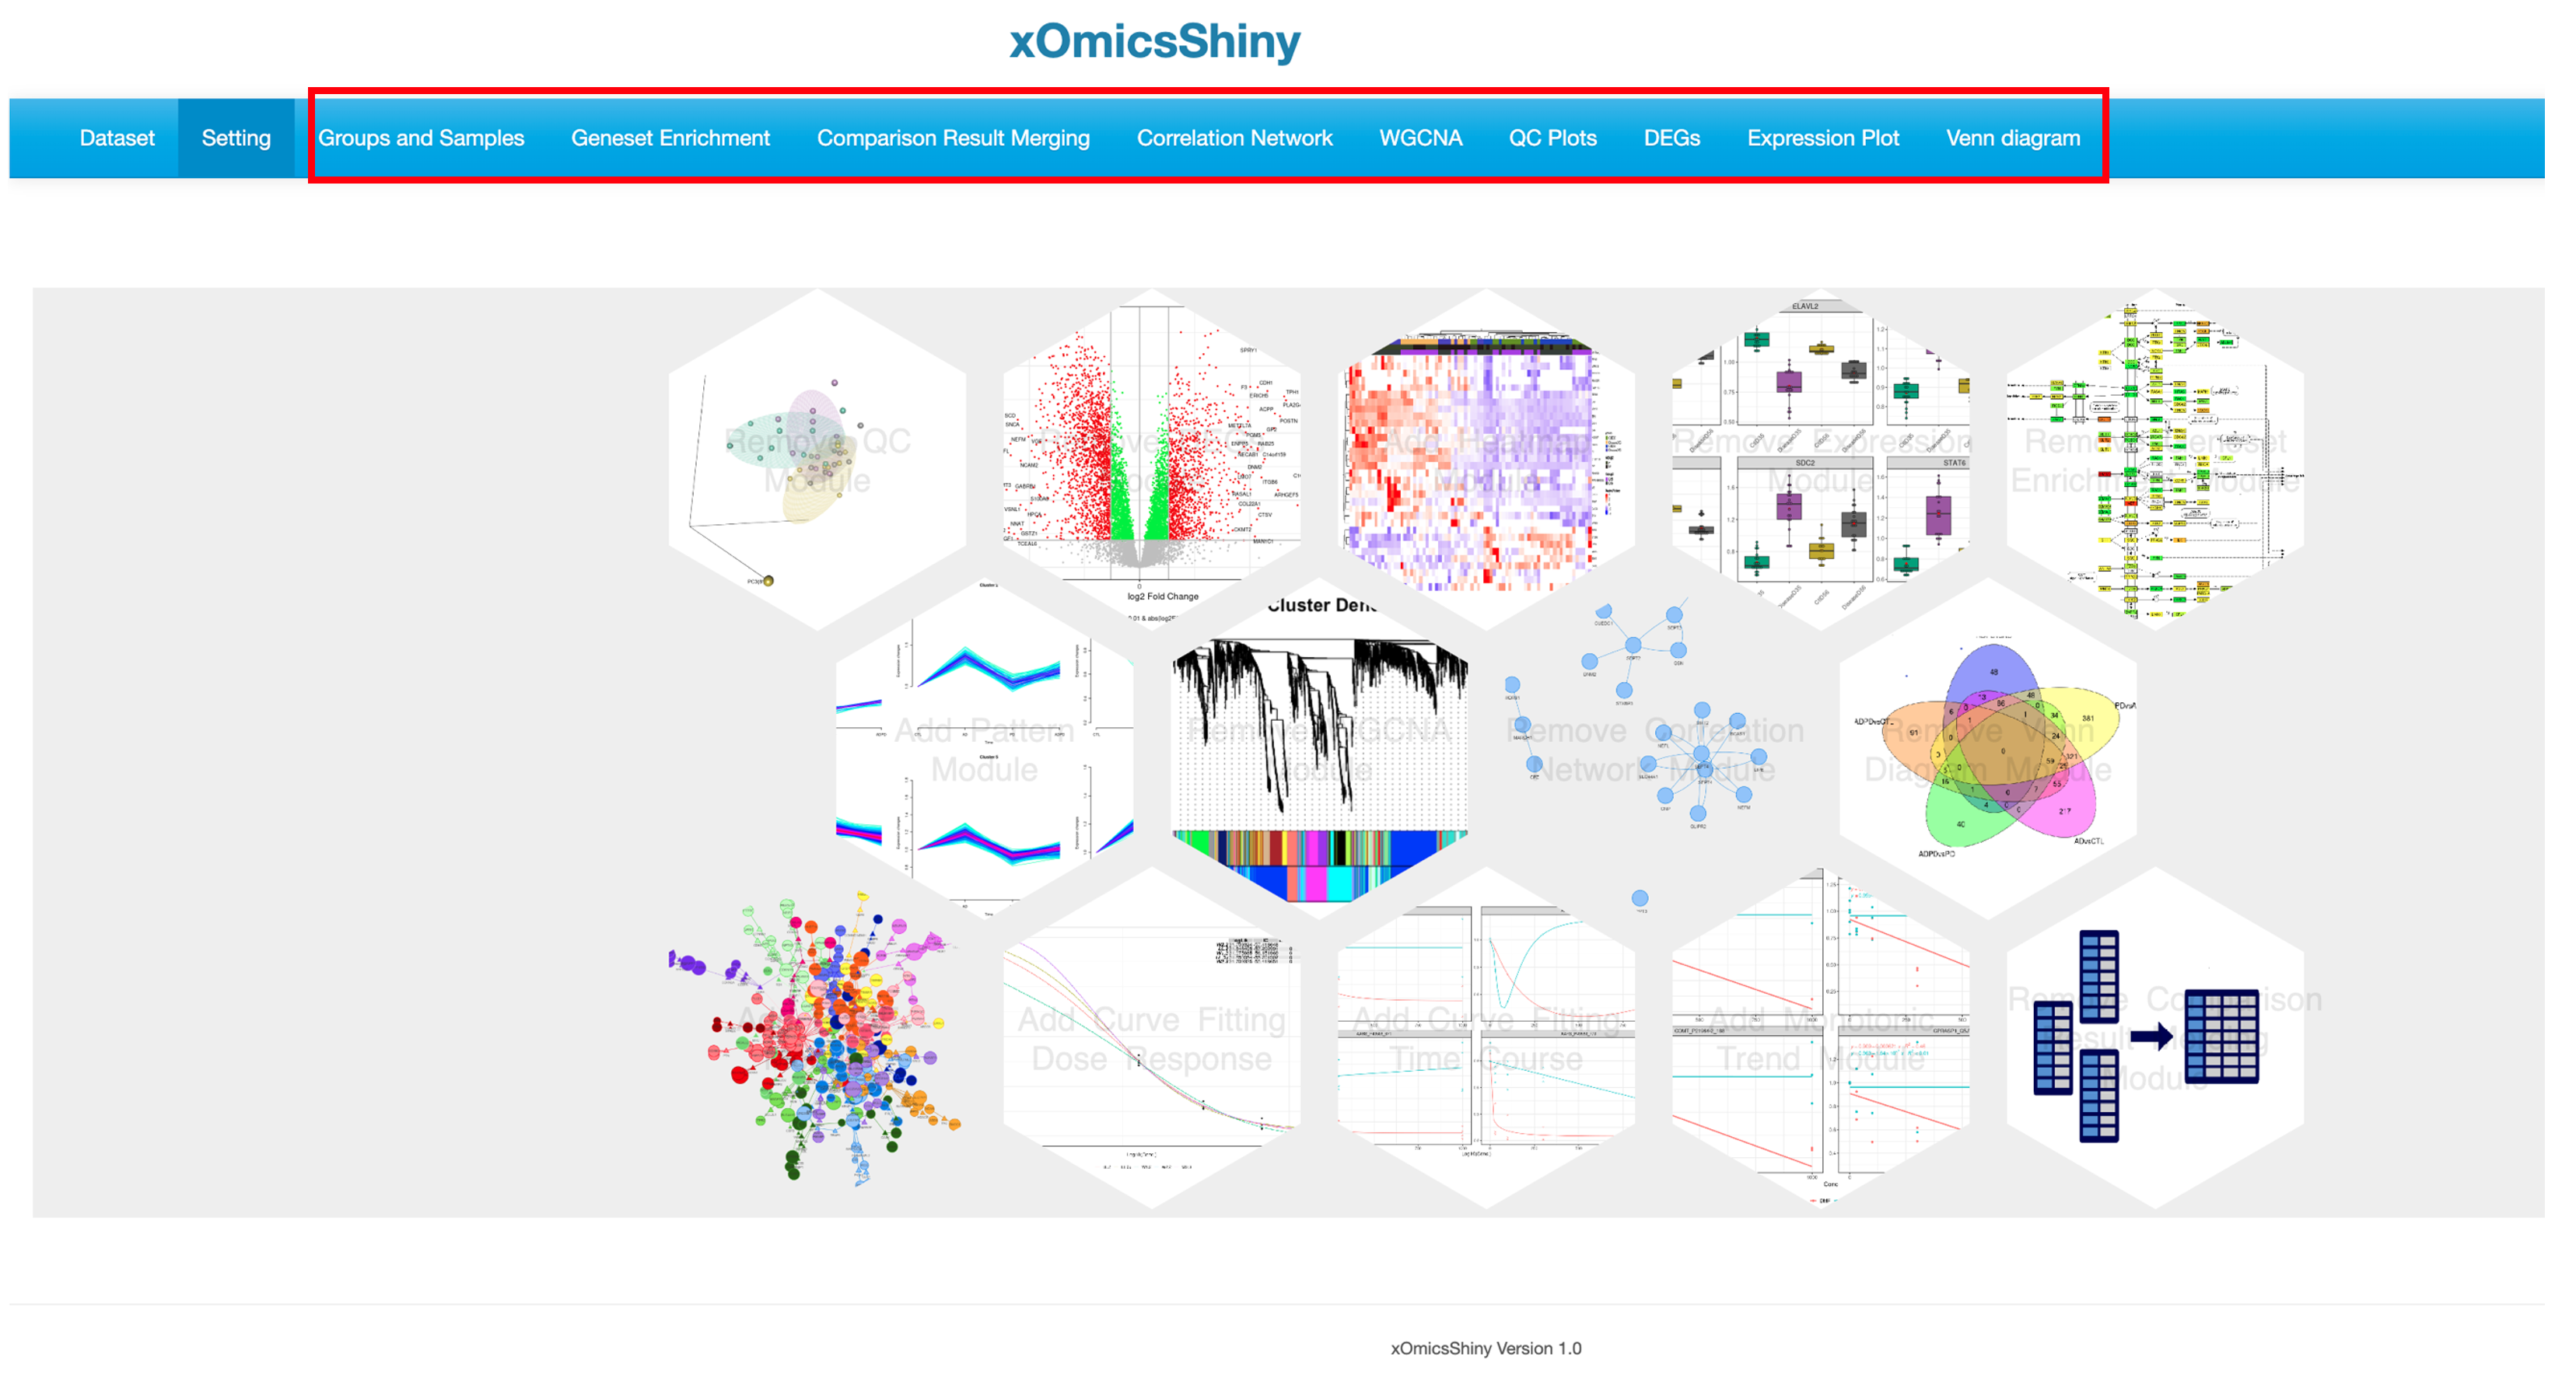
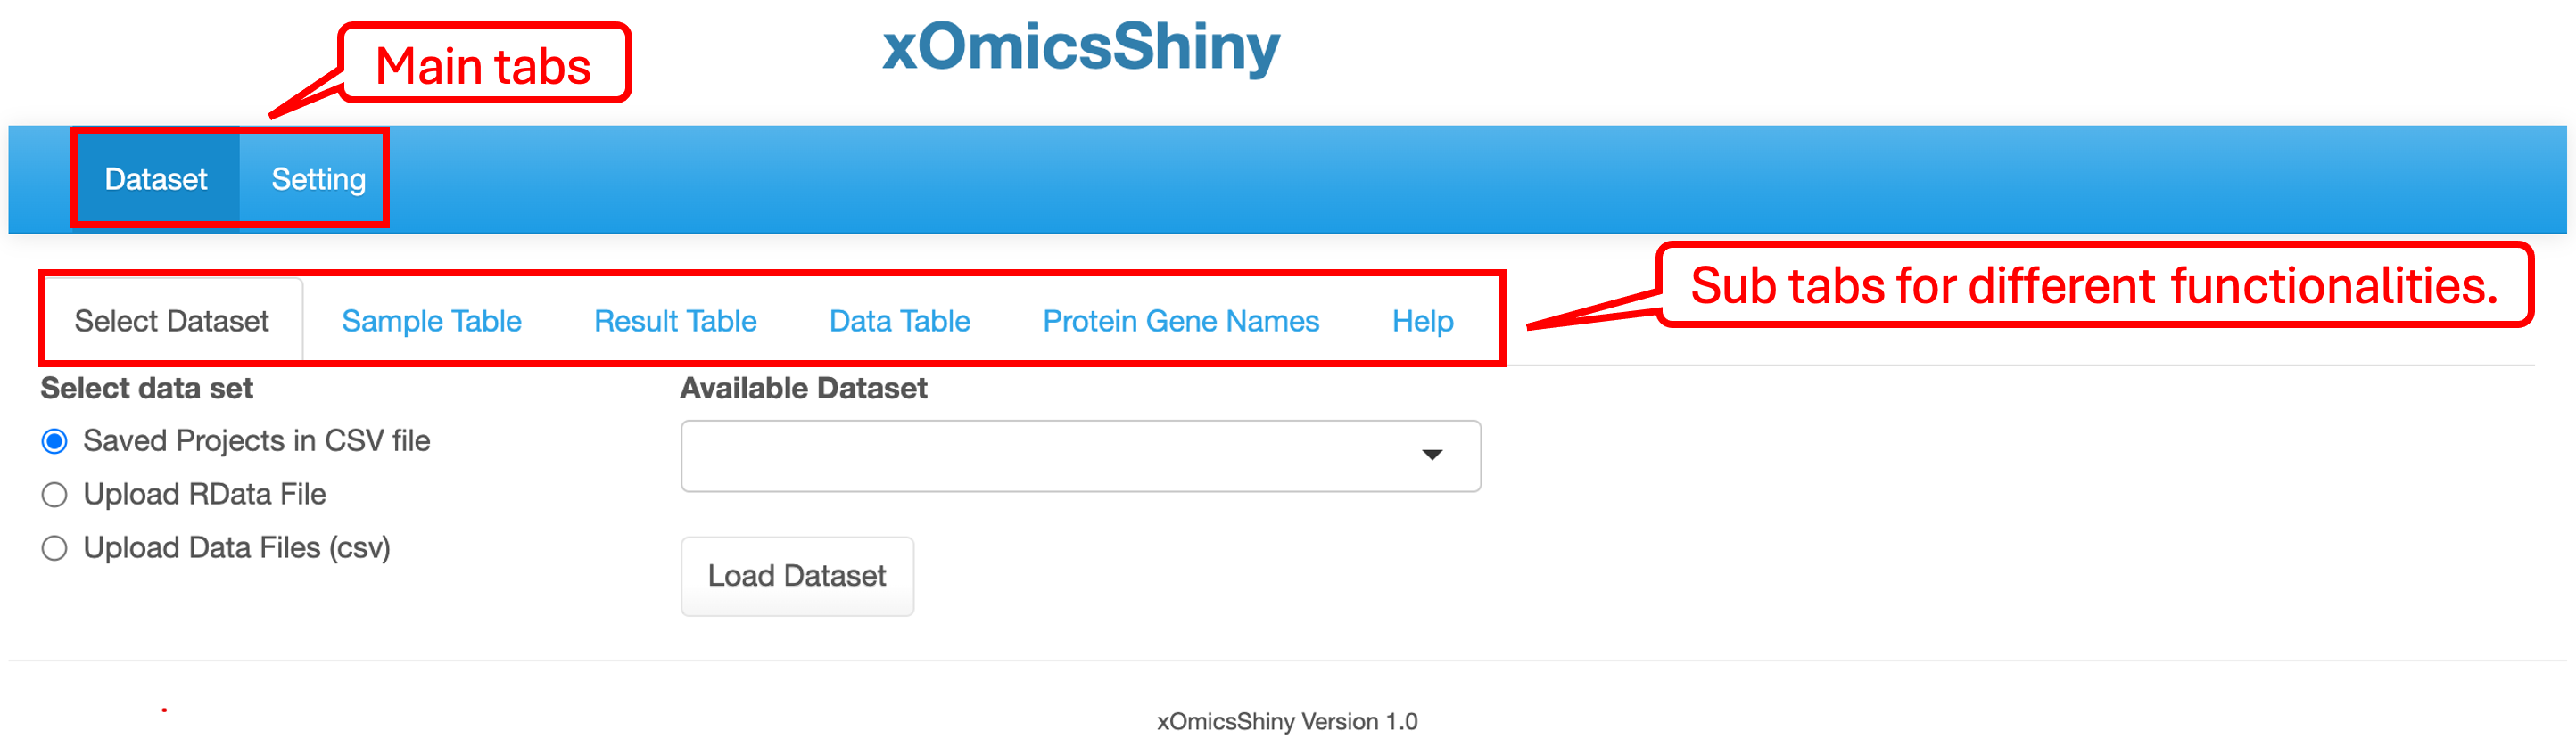
The main interface consists of two tabs: Dataset and Setting. The Dataset page features a multi-tab menu for various functionality modules. Before loading a dataset, the default tabs include Select Dataset, four tabs displaying dataset information, and a Help tab explaining the sub-tab functions.
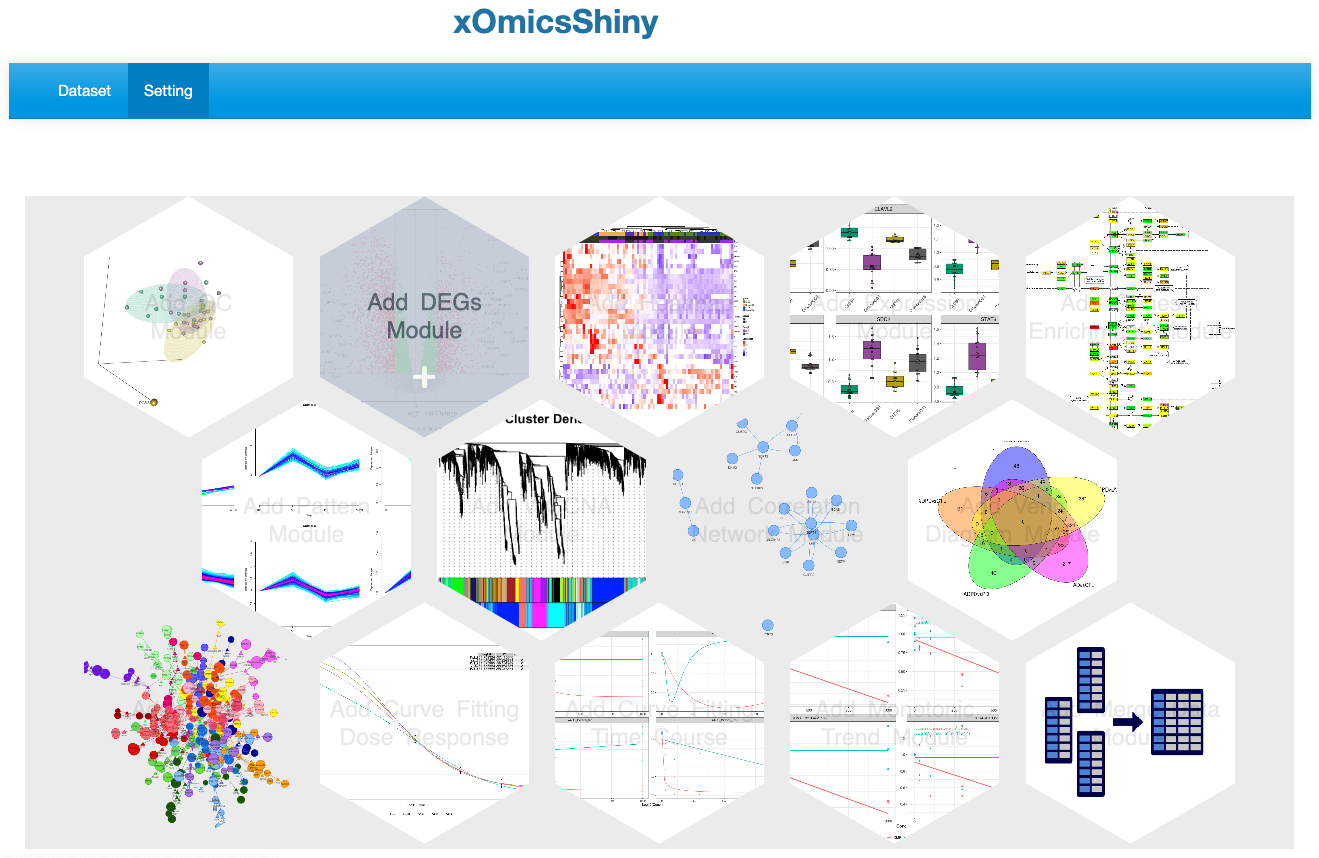
The Setting page lists all available functional modules. Users can select or deselect individual modules by clicking on the module icon, which displays a text prompt on hover. Selected module names will be added as tabs in the multi-tab menu on the Dataset page.