This module enables users to check if the dose-response/time-course effect is monotonic or not.
Fitting Curve
This functionality showed dose-response/time-course plot with linear fitting for individual genes. It contains 3 sub-tabs.
Fitting Curve
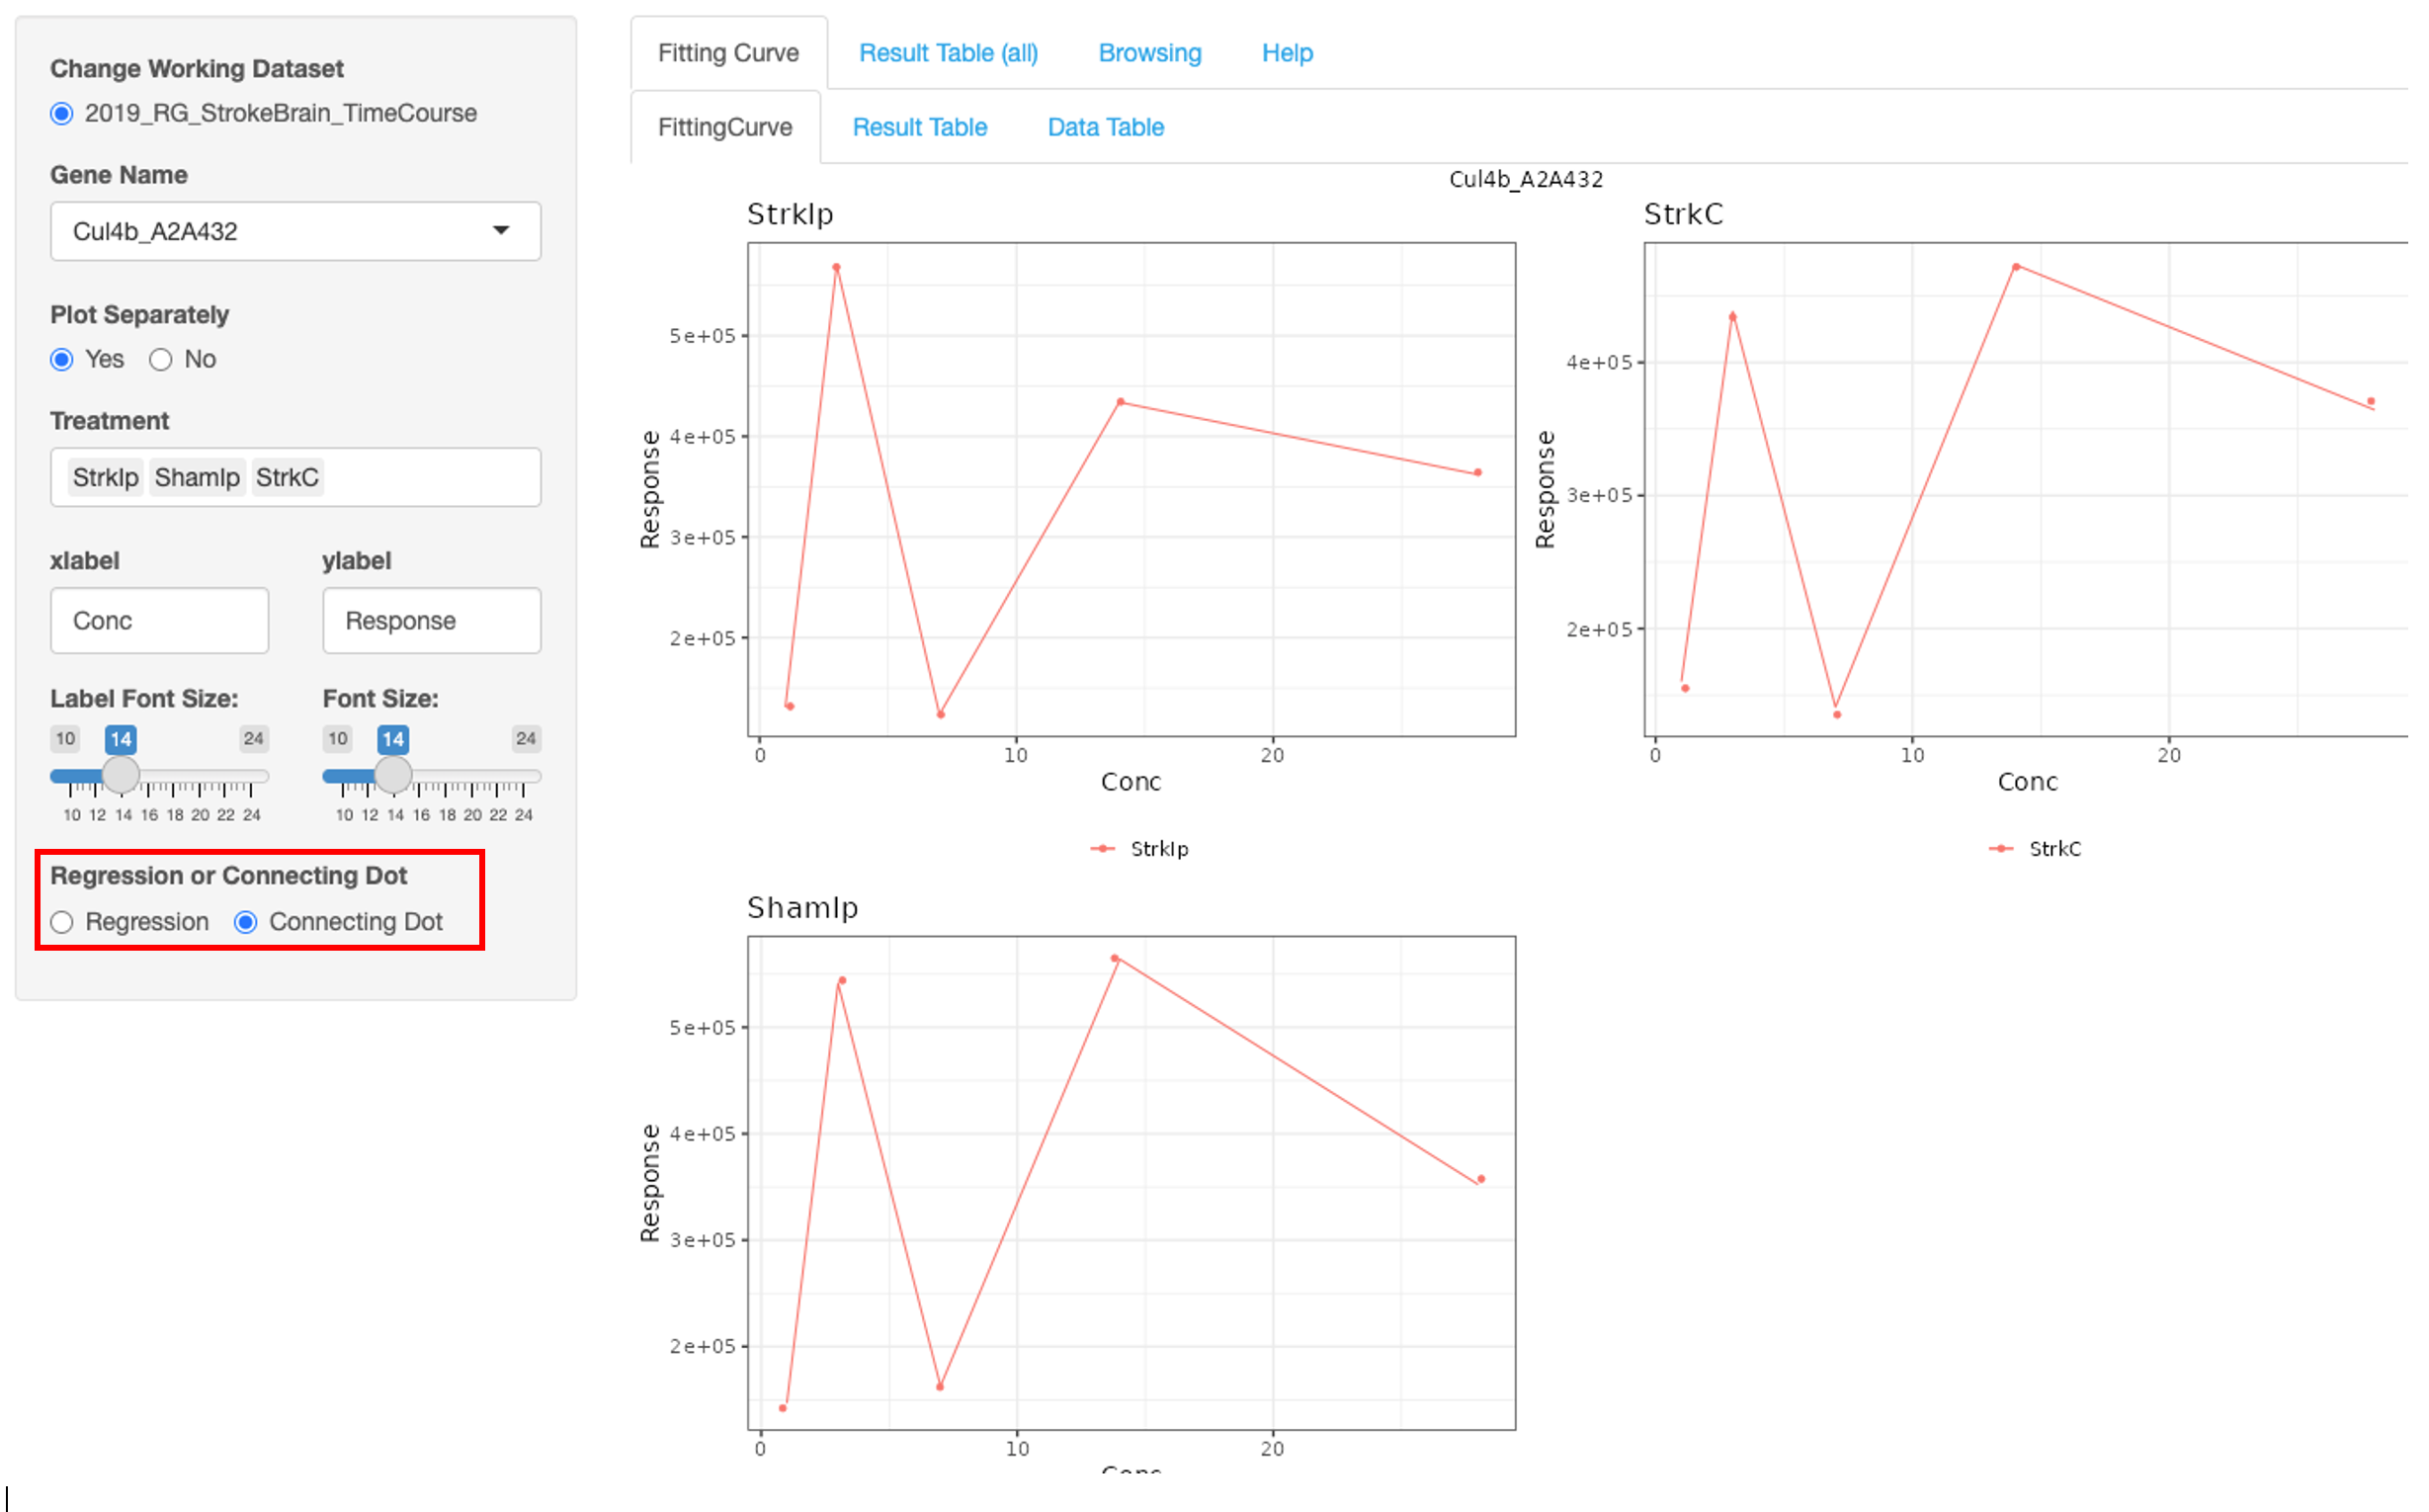
The “Fitting Curve” tab shows the dose response plots.The example below shows that all 3 plots has very low R-square value, which indicate bad fit.
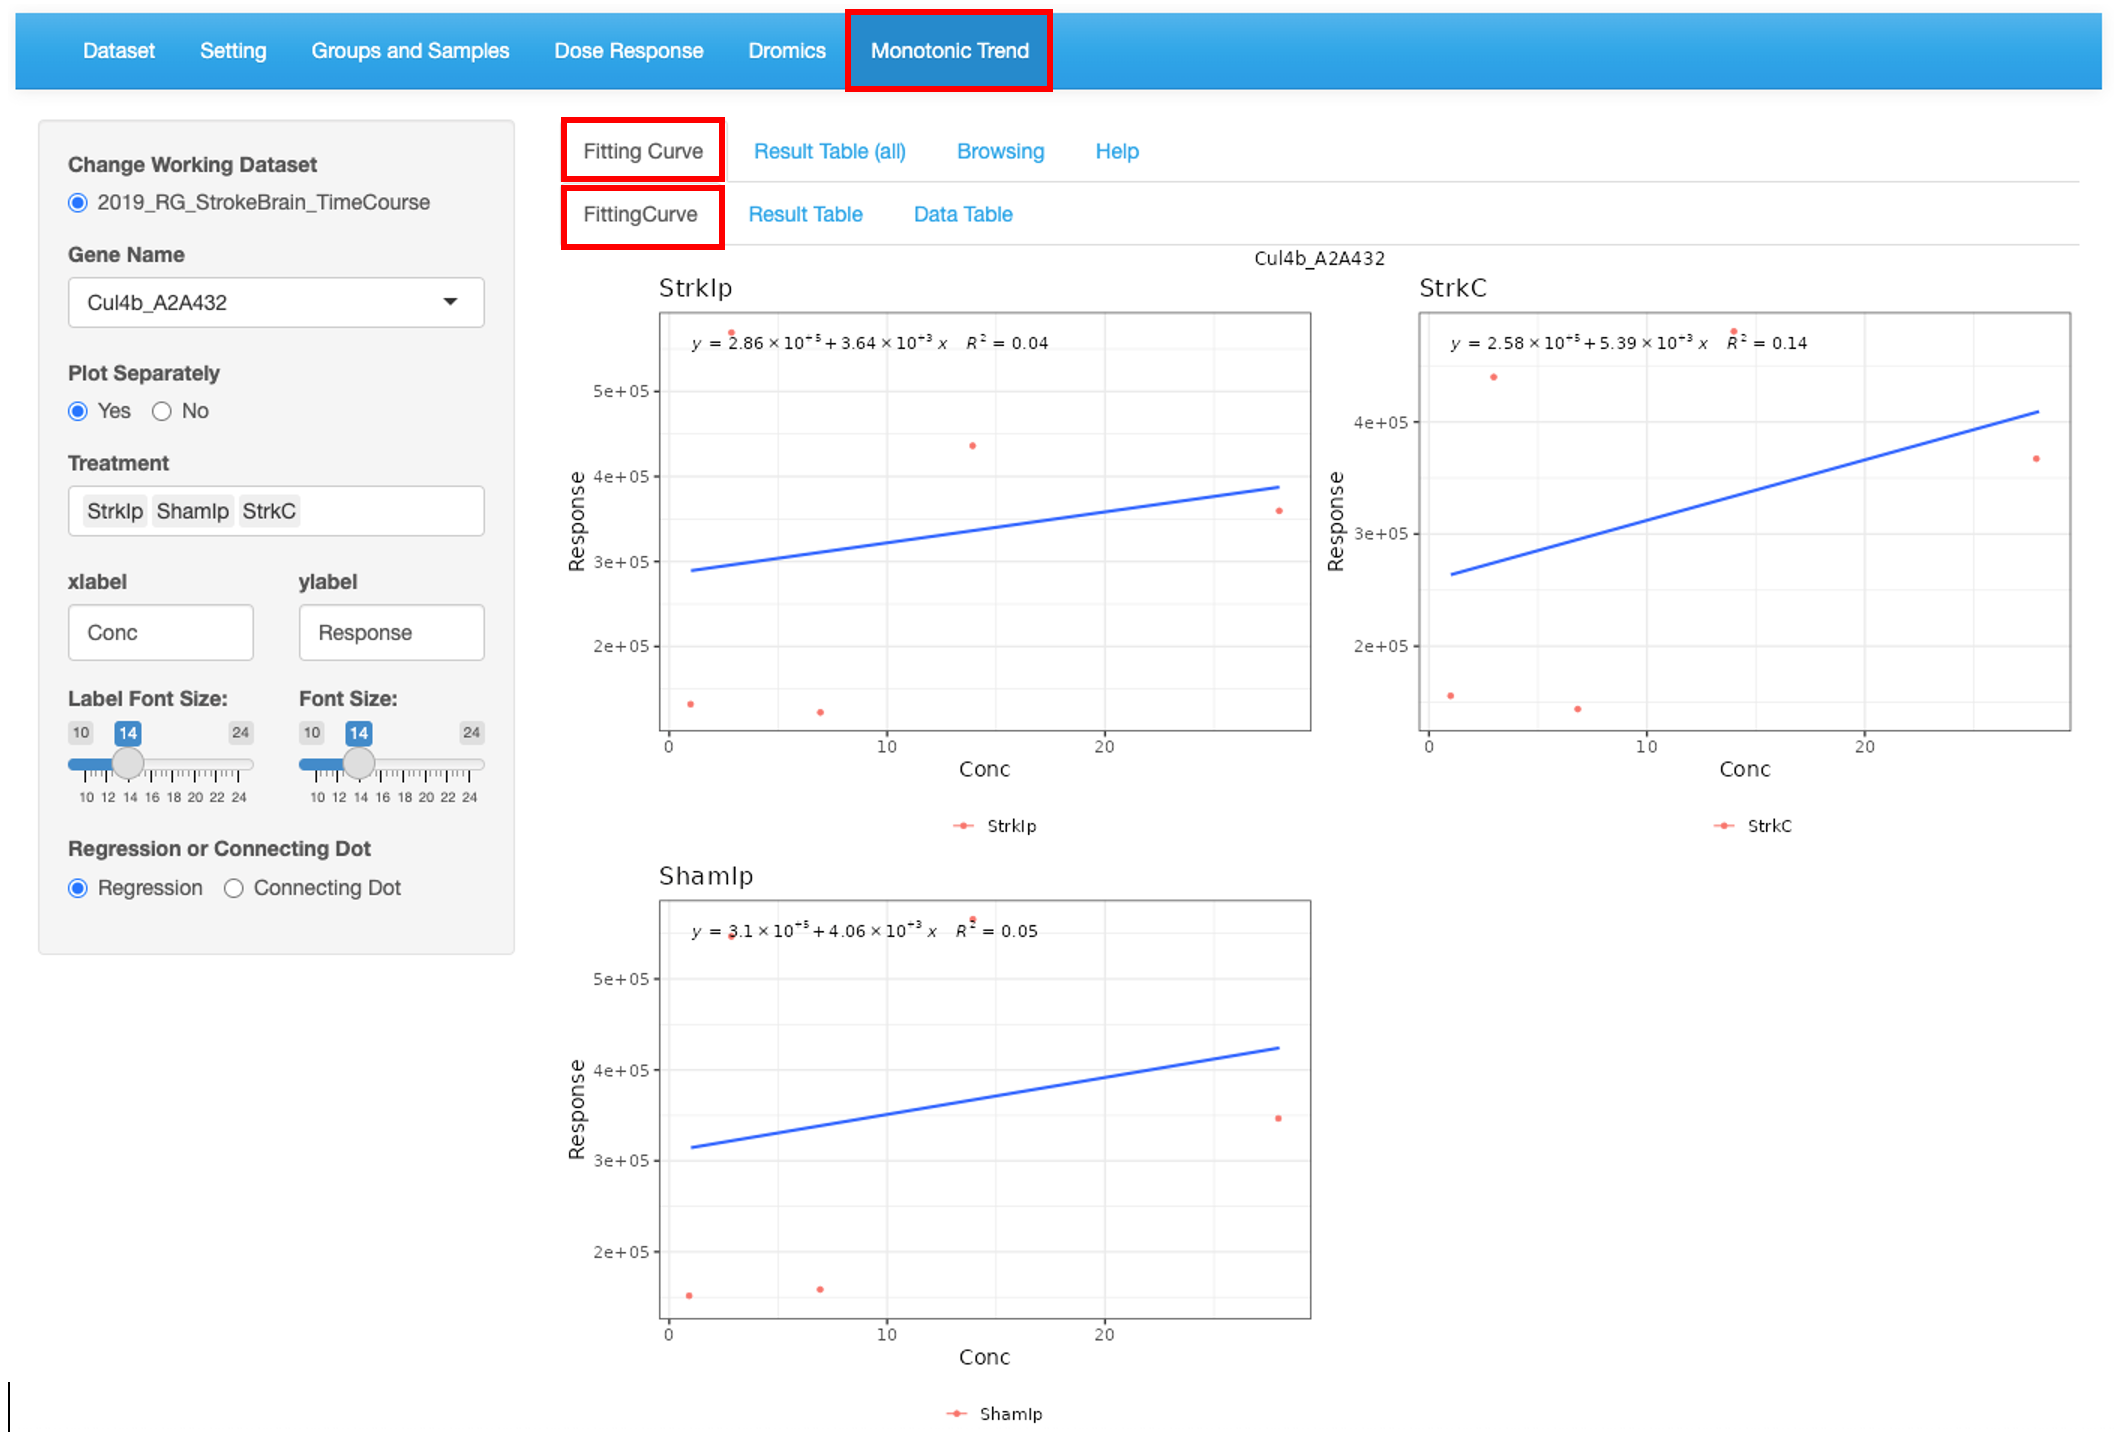
It is very clear that the respone keeps up and down when we change to view “Connecting Dot”.
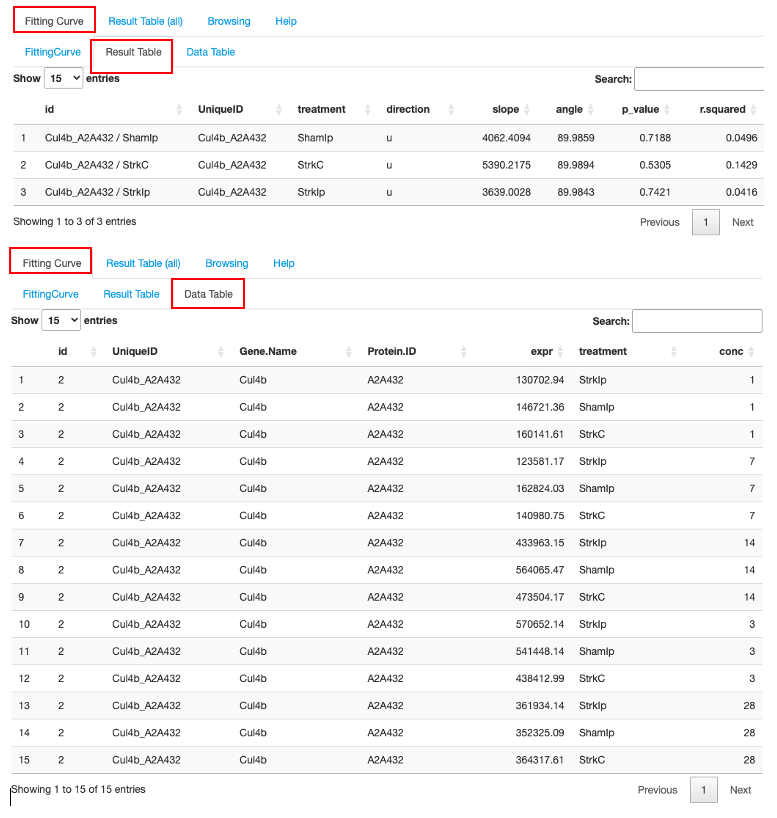
Result Table and Data Table
The “Result Table” shows the fitted results in a searchable table, which are shown as labels in the plots. And the “Data Table” shows the original data of the selected genes.