Chapter 12 Correlation Network Module
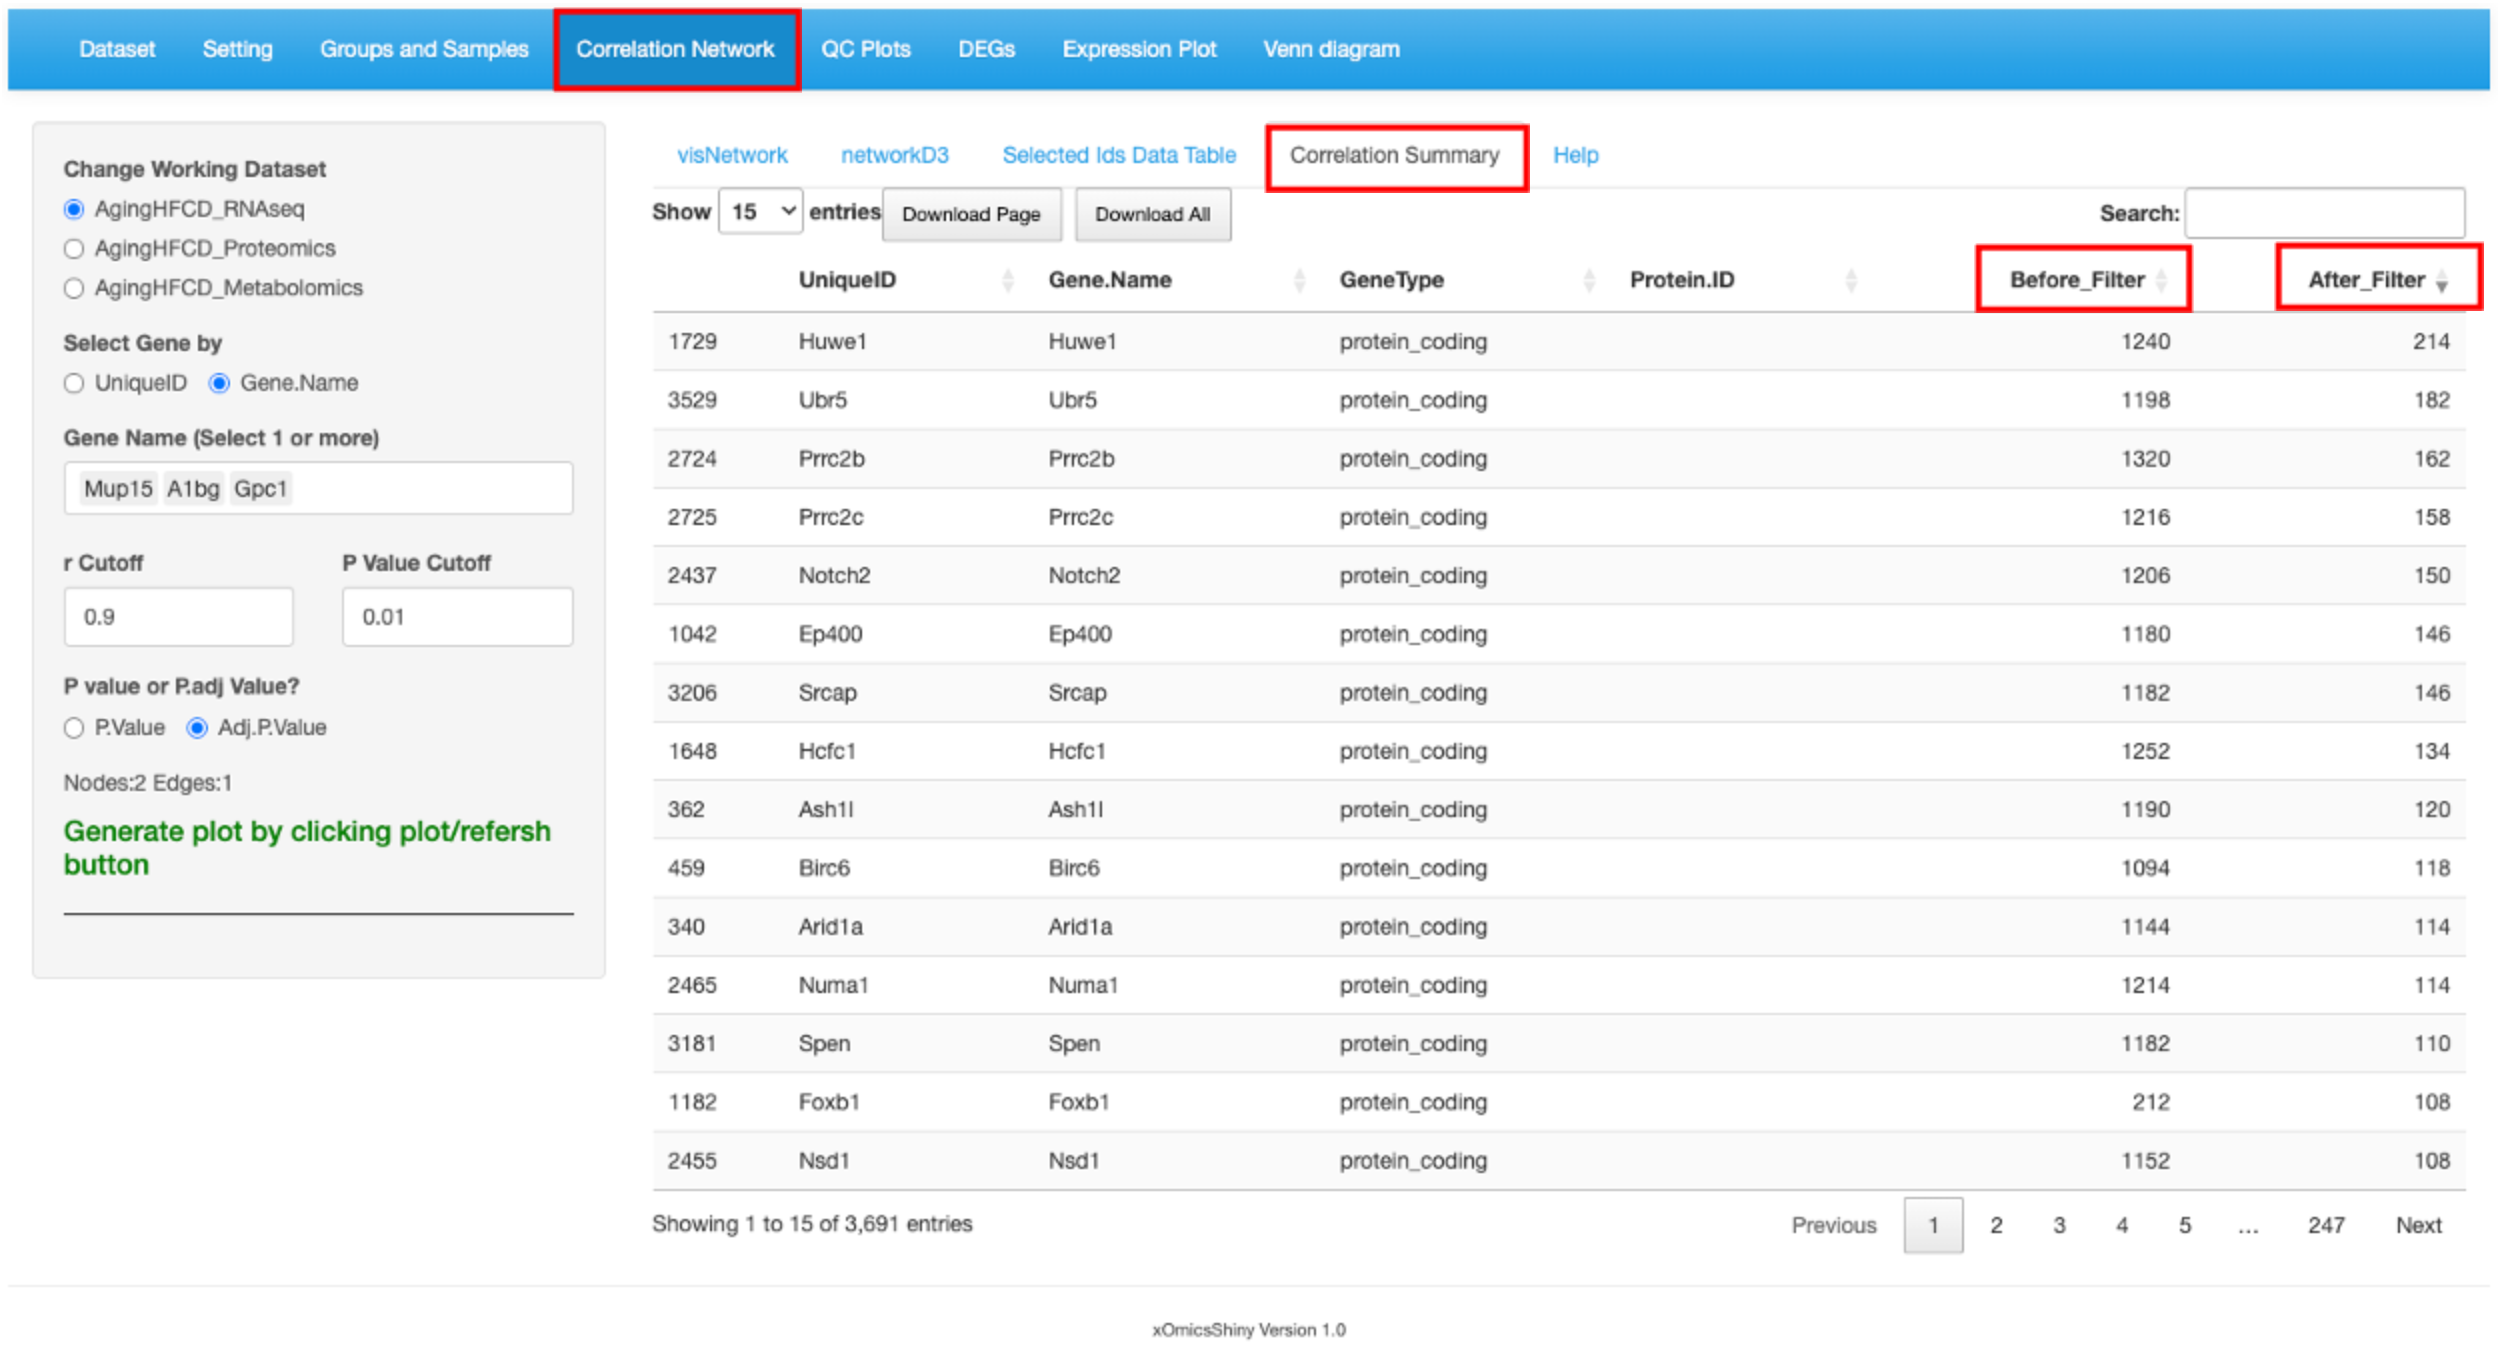
This module helps build co-expression networks based on gene-gene, protein-protein or metabolite-metablote correlations. This is especially useful during co-immunoprecipitation or pulldown proteomics experiments to identify protein partners. Users have the ability to enter 1 or more genes/proteins to identify if their expression is correlated. If users has the interested candidates to check, please check the cisNetwork or networkD3 result directly. If users need the tool to provide the correlation network information, please check the Correlation Summary tab, which providing the whole list of genes/proteins/metablites that has correlated genes/proteins/metablites.
12.1 visNetwork
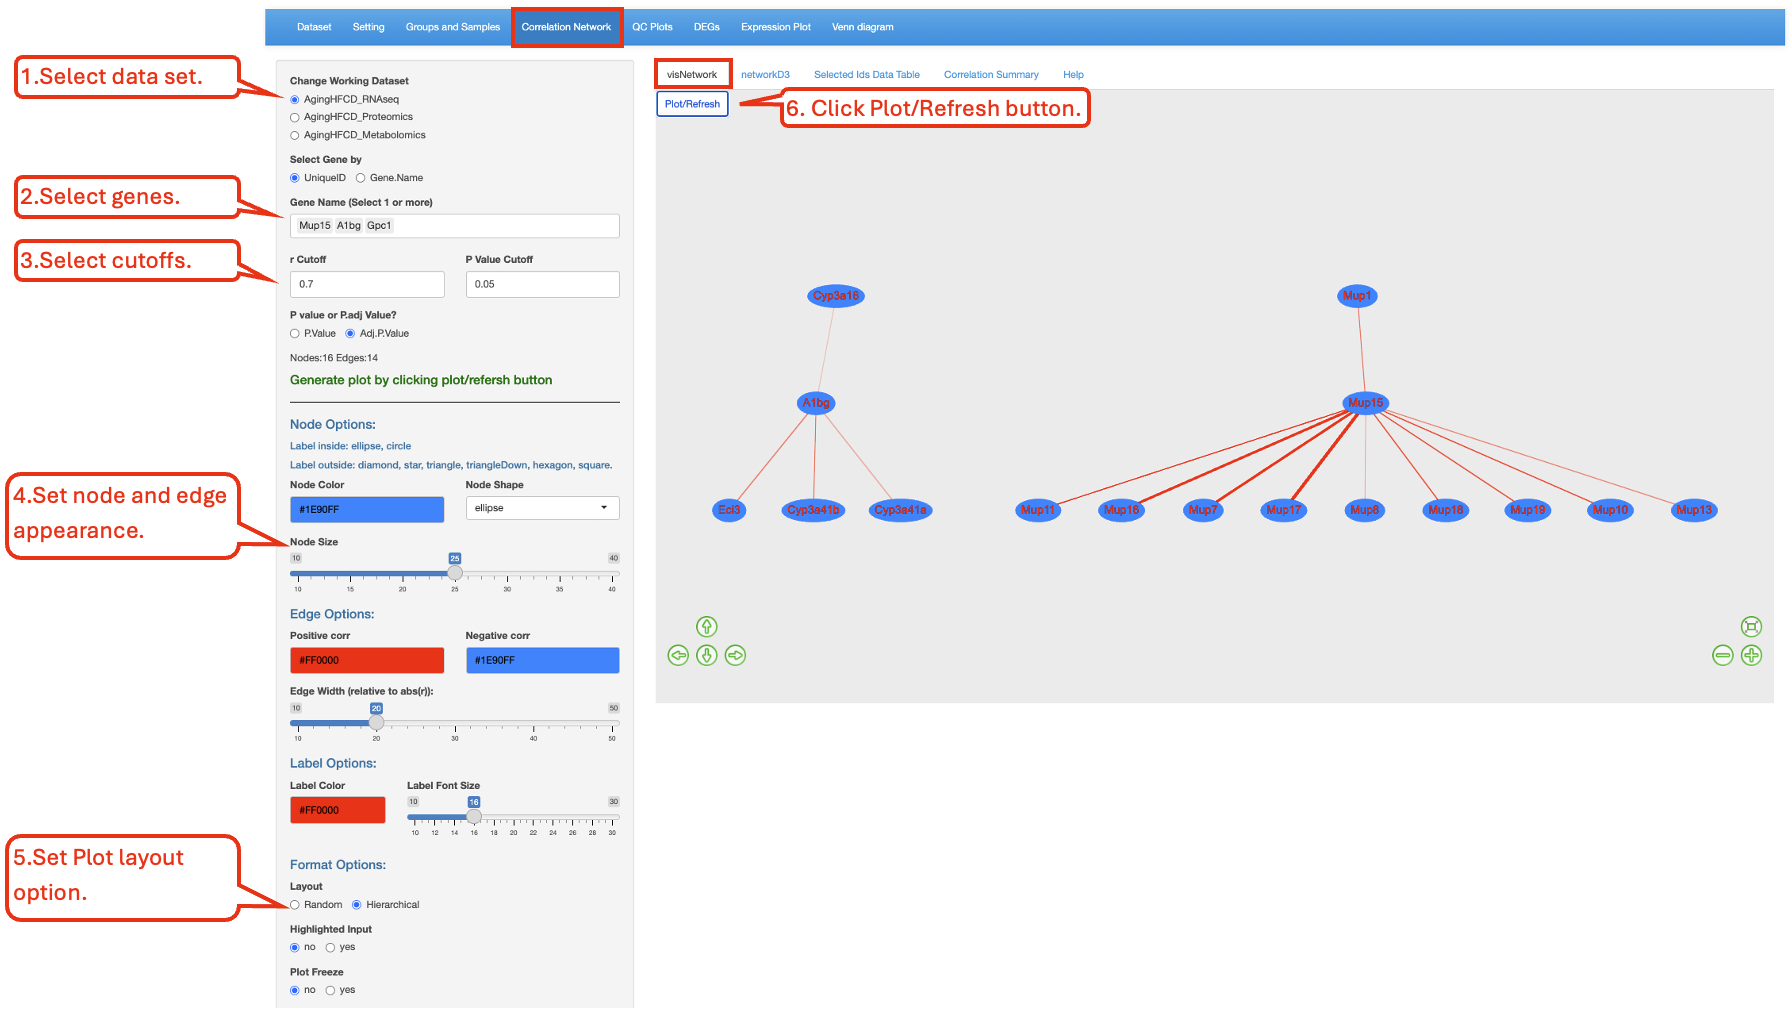
This functionality uses the R package visNetwork to visualize the expression of correlated genes/proteins/metablites. Users have the ability to choose the R and P value cutoff for selecting the correlated genes/proteins. P.Value is the Pearson’s correlation test p-value for each pair of the genes/proteins/metablites. Adj.P.Value is the adjusted p-value obtained using Benjamini-Hochberg method. In this example below, we probe 3 genes and identify the expression of other genes that are correlated with them. The following network plot was produced. Mup15 is part of a large network with multiple genes correlated with it. On the other hand, A1bg was correlated with 2 other genes, while Gpc1 was not correlated with any genes. Larger nodes (genes/proteins/metablites) indicate higher importance within the network. Thicker edges (lines connect the nodes) represent stronger connections between nodes.
12.2 networkD3
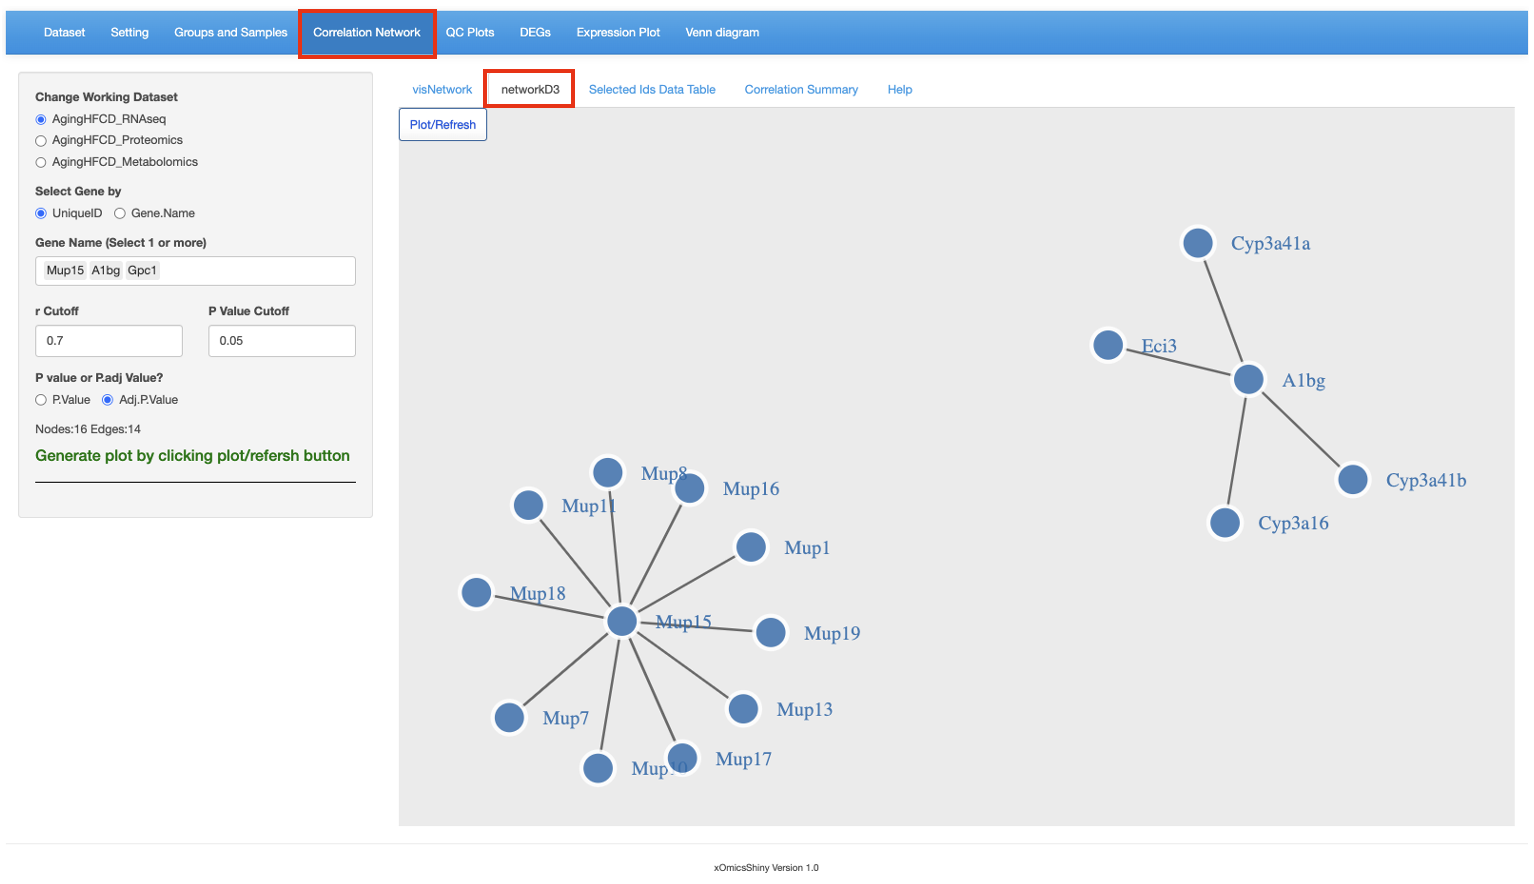
This functionality uses the R package d3Network for creating D3 network graphs. Use the same setup, networkD3 show the following results.
12.3 Selected Ids Data Table
Here is a table here showing the correlation results of the genes/proteins/metablites selected in the previous tabs. Correlation coefficient, p-value, adjusted p-value and correlation direction are reported for each pair of genes/proteins/metablites. Users can perform searches and sort based on correlation statistics.