Chapter 21 Appendix
21.1 Scalability testing
We tested the scalability of xOmicsShiny using the following example data below.
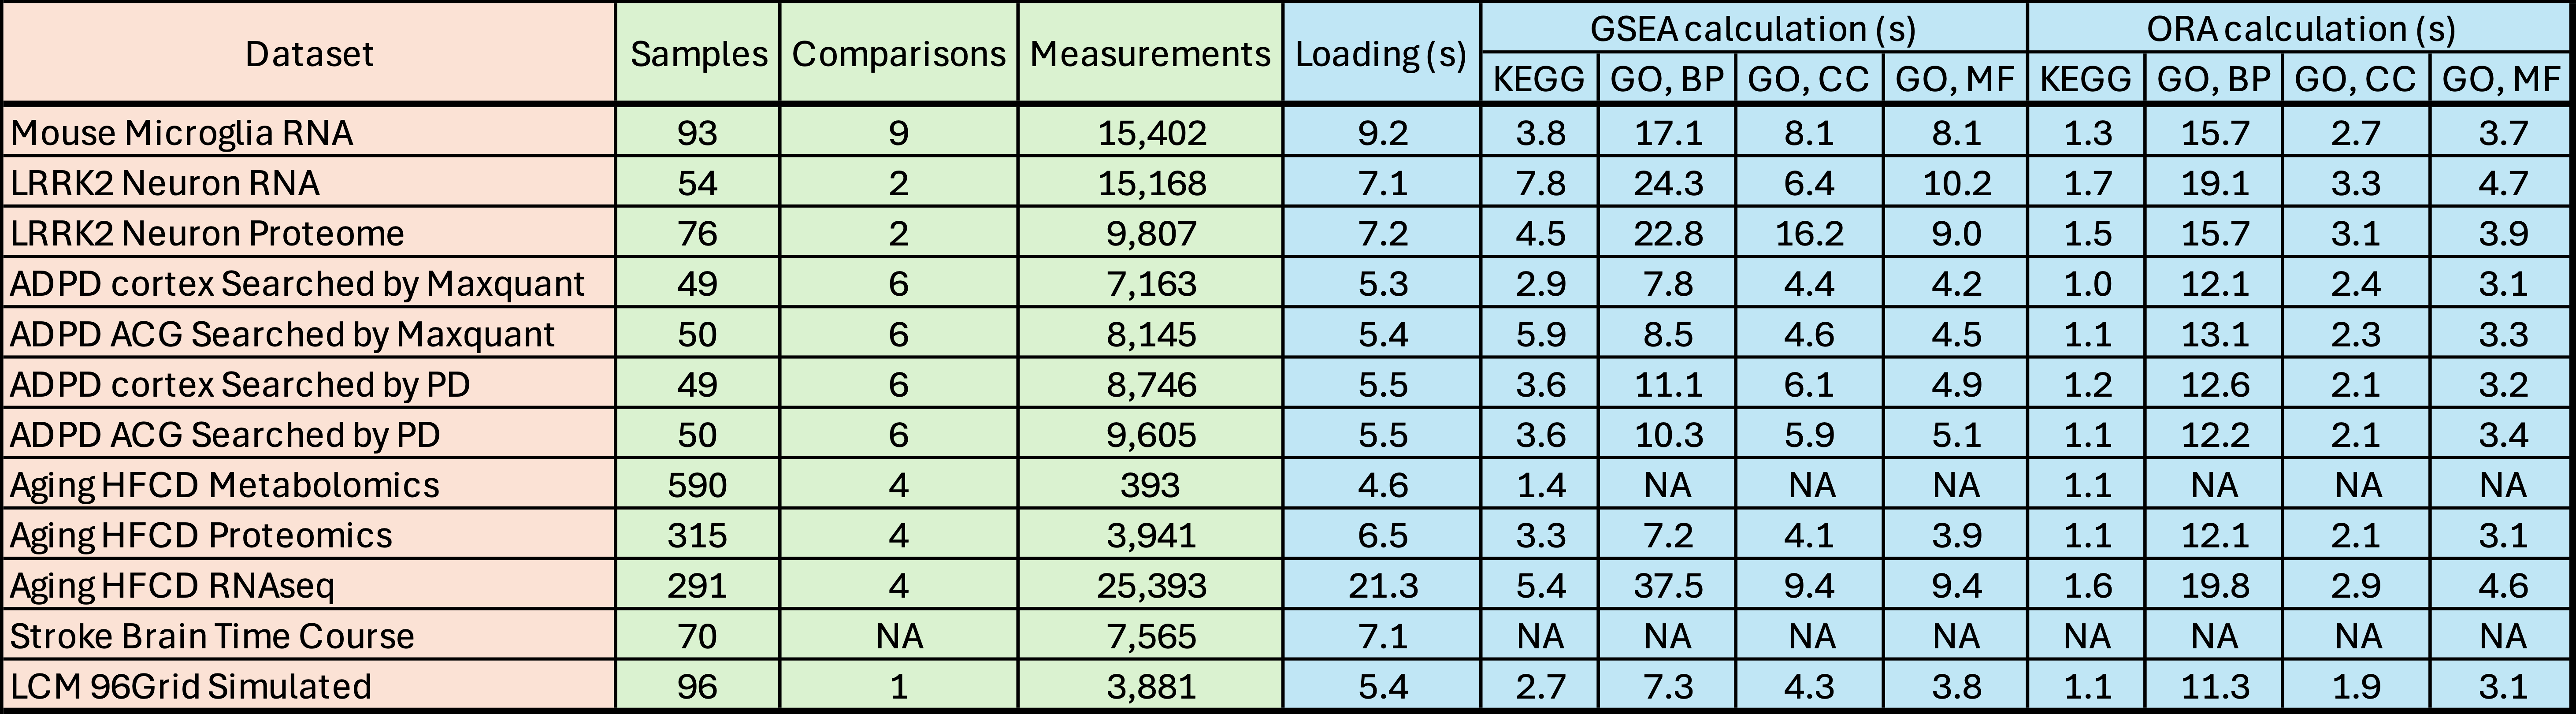
Appendix Table 1: Loading speed test of example datasets. This table shows the number of samples, comparisons, and measurements (genes/proteins/metabolites) in each dataset. The additional columns record the loading speed (in seconds) of the data, time to calculate GSEA (Gene set enrichment analysis) and ORA (Over-representation analysis) results using the KEGG or gene ontology (GO) databases (BP: biological process, CC: cellular component, and MF: molecular function).
21.2 Feature comparison
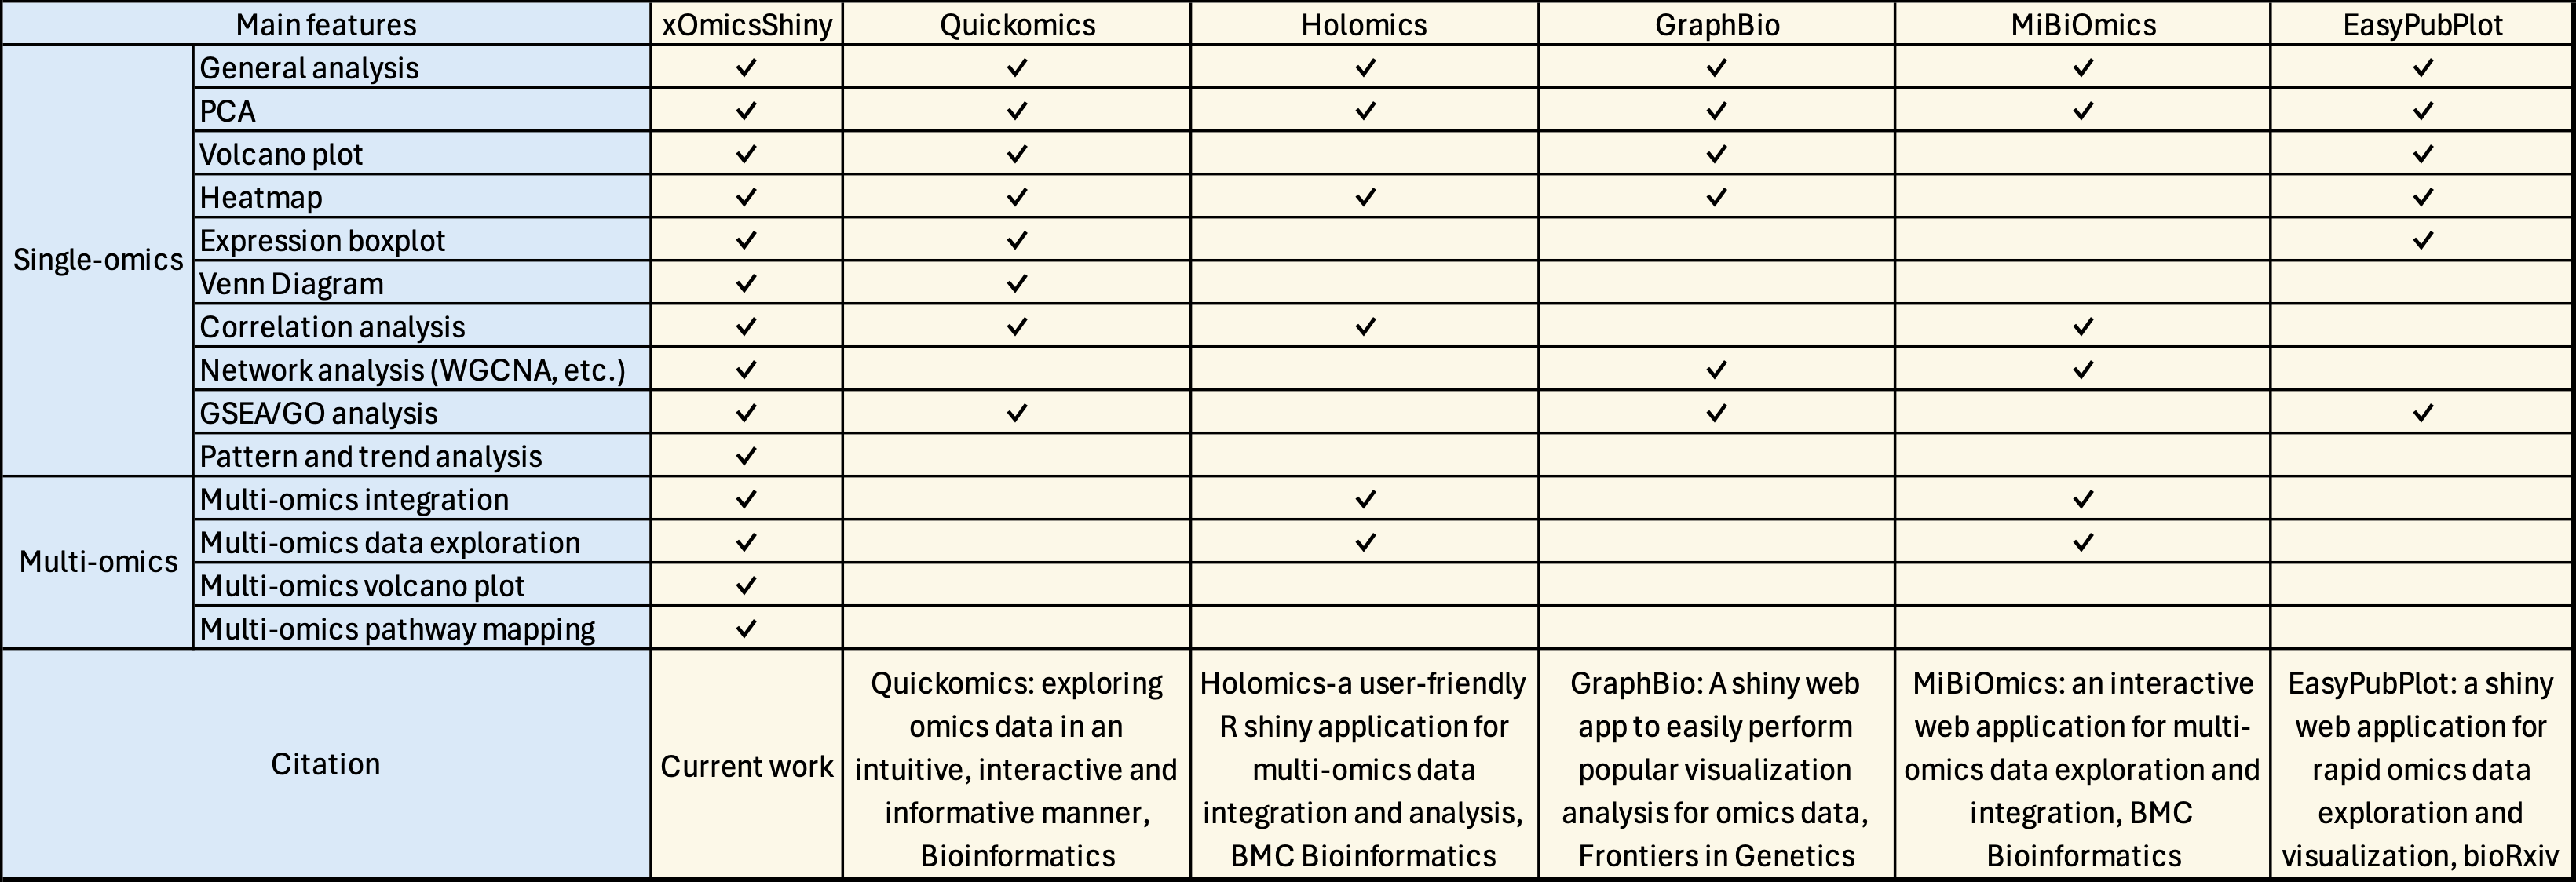
Appendix Table 2: Feature comparison with existing R Shiny applications.
Links to the papers involved in the comparison:
1, Gao et al., Quickomics: exploring omics data in an intuitive, interactive and informative manner, Bioinformatics, 2021
2, Munk et al., Holomics-a user-friendly R shiny application for multi-omics data integration and analysis, BMC bioinformatics, 2024
3, Zhao and Wang., GraphBio: A shiny web app to easily perform popular visualization analysis for omics data, Frontiers in Genetics, 2022
4, Zoppi et al., MiBiOmics: an interactive web application for multi-omics data exploration and integration, BMC Bioinformatics , 2021
5, Tien et al., EasyPubPlot: a shiny web application for rapid omics data exploration and visualization, bioRxiv, 2024