Chapter 10 Pattern Clustering Module
This functional module in xOmicsShiny helps cluster genes/proteins/metabolites based on their expression/measurement profiles across different sample groups. Three different algorithms, soft (fuzzy) clustering, k-means and partitioning around medoids (PAM), are implemented.
10.1 Clustering of Centroid Profiles
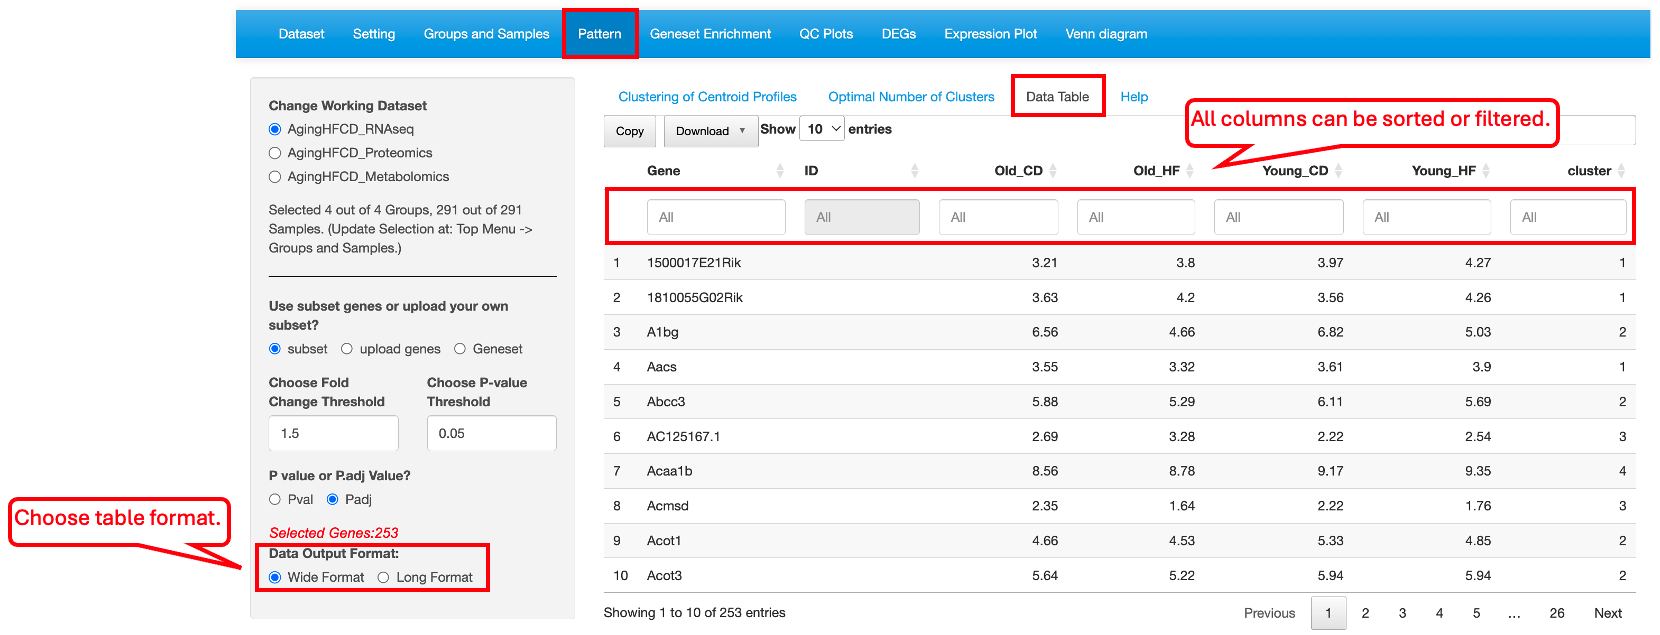
Users can choose to select DEGs/DEPs/DEMs as the list of genes/proteins/metabolites for clustering (subset), upload a custom gene list (upload genes), or select a gene set (Geneset). When the subset option is chosen, DEGs/DEPs/DEMs are selected based on all comparisons, and cutoffs can be applied to limit the number of genes. In the example below, we use the top DEGs and DEPs with a fold change cutoff of 1.5 and an adjusted p-value cutoff of 0.05 to identify four clusters of genes in the AgingHFCD_RNAseq data set.
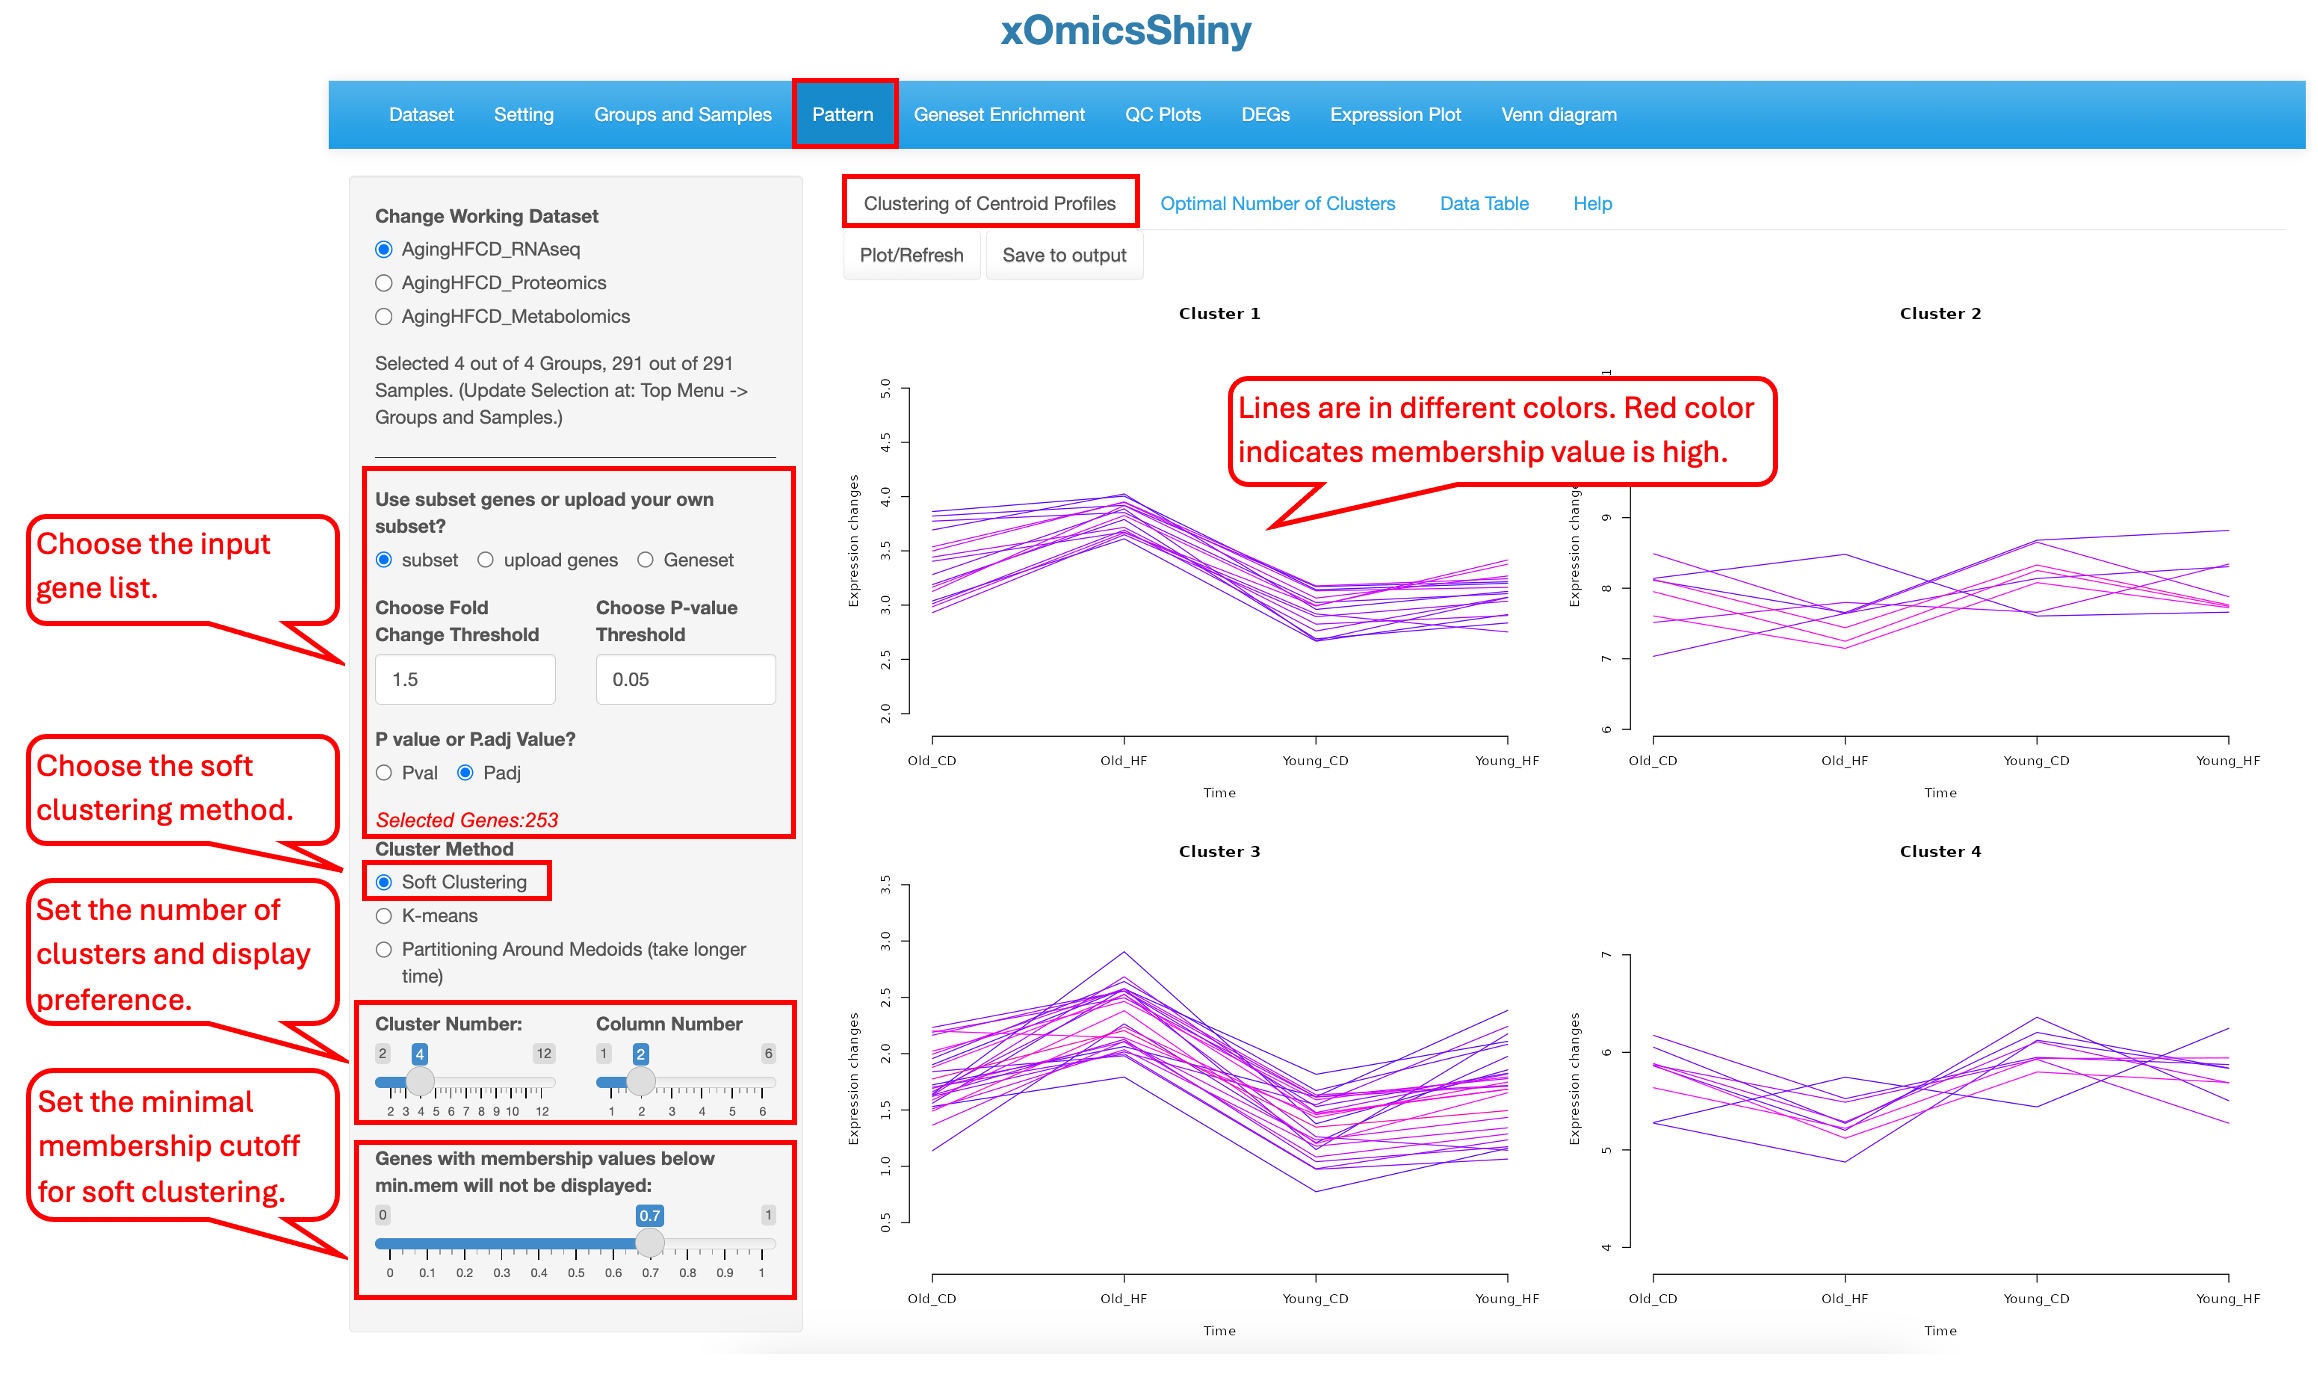
Soft clustering differs from hard clustering in that clusters can overlap. This means elements, such as genes, proteins, or metabolites, can be grouped into more than one cluster if the data are not well separated. Each element is assigned a membership value for each cluster it belongs to. These membership values indicate how well the element is represented by a specific cluster. Low values indicate poor representation, while high values indicate a strong correlation with the cluster centroid.
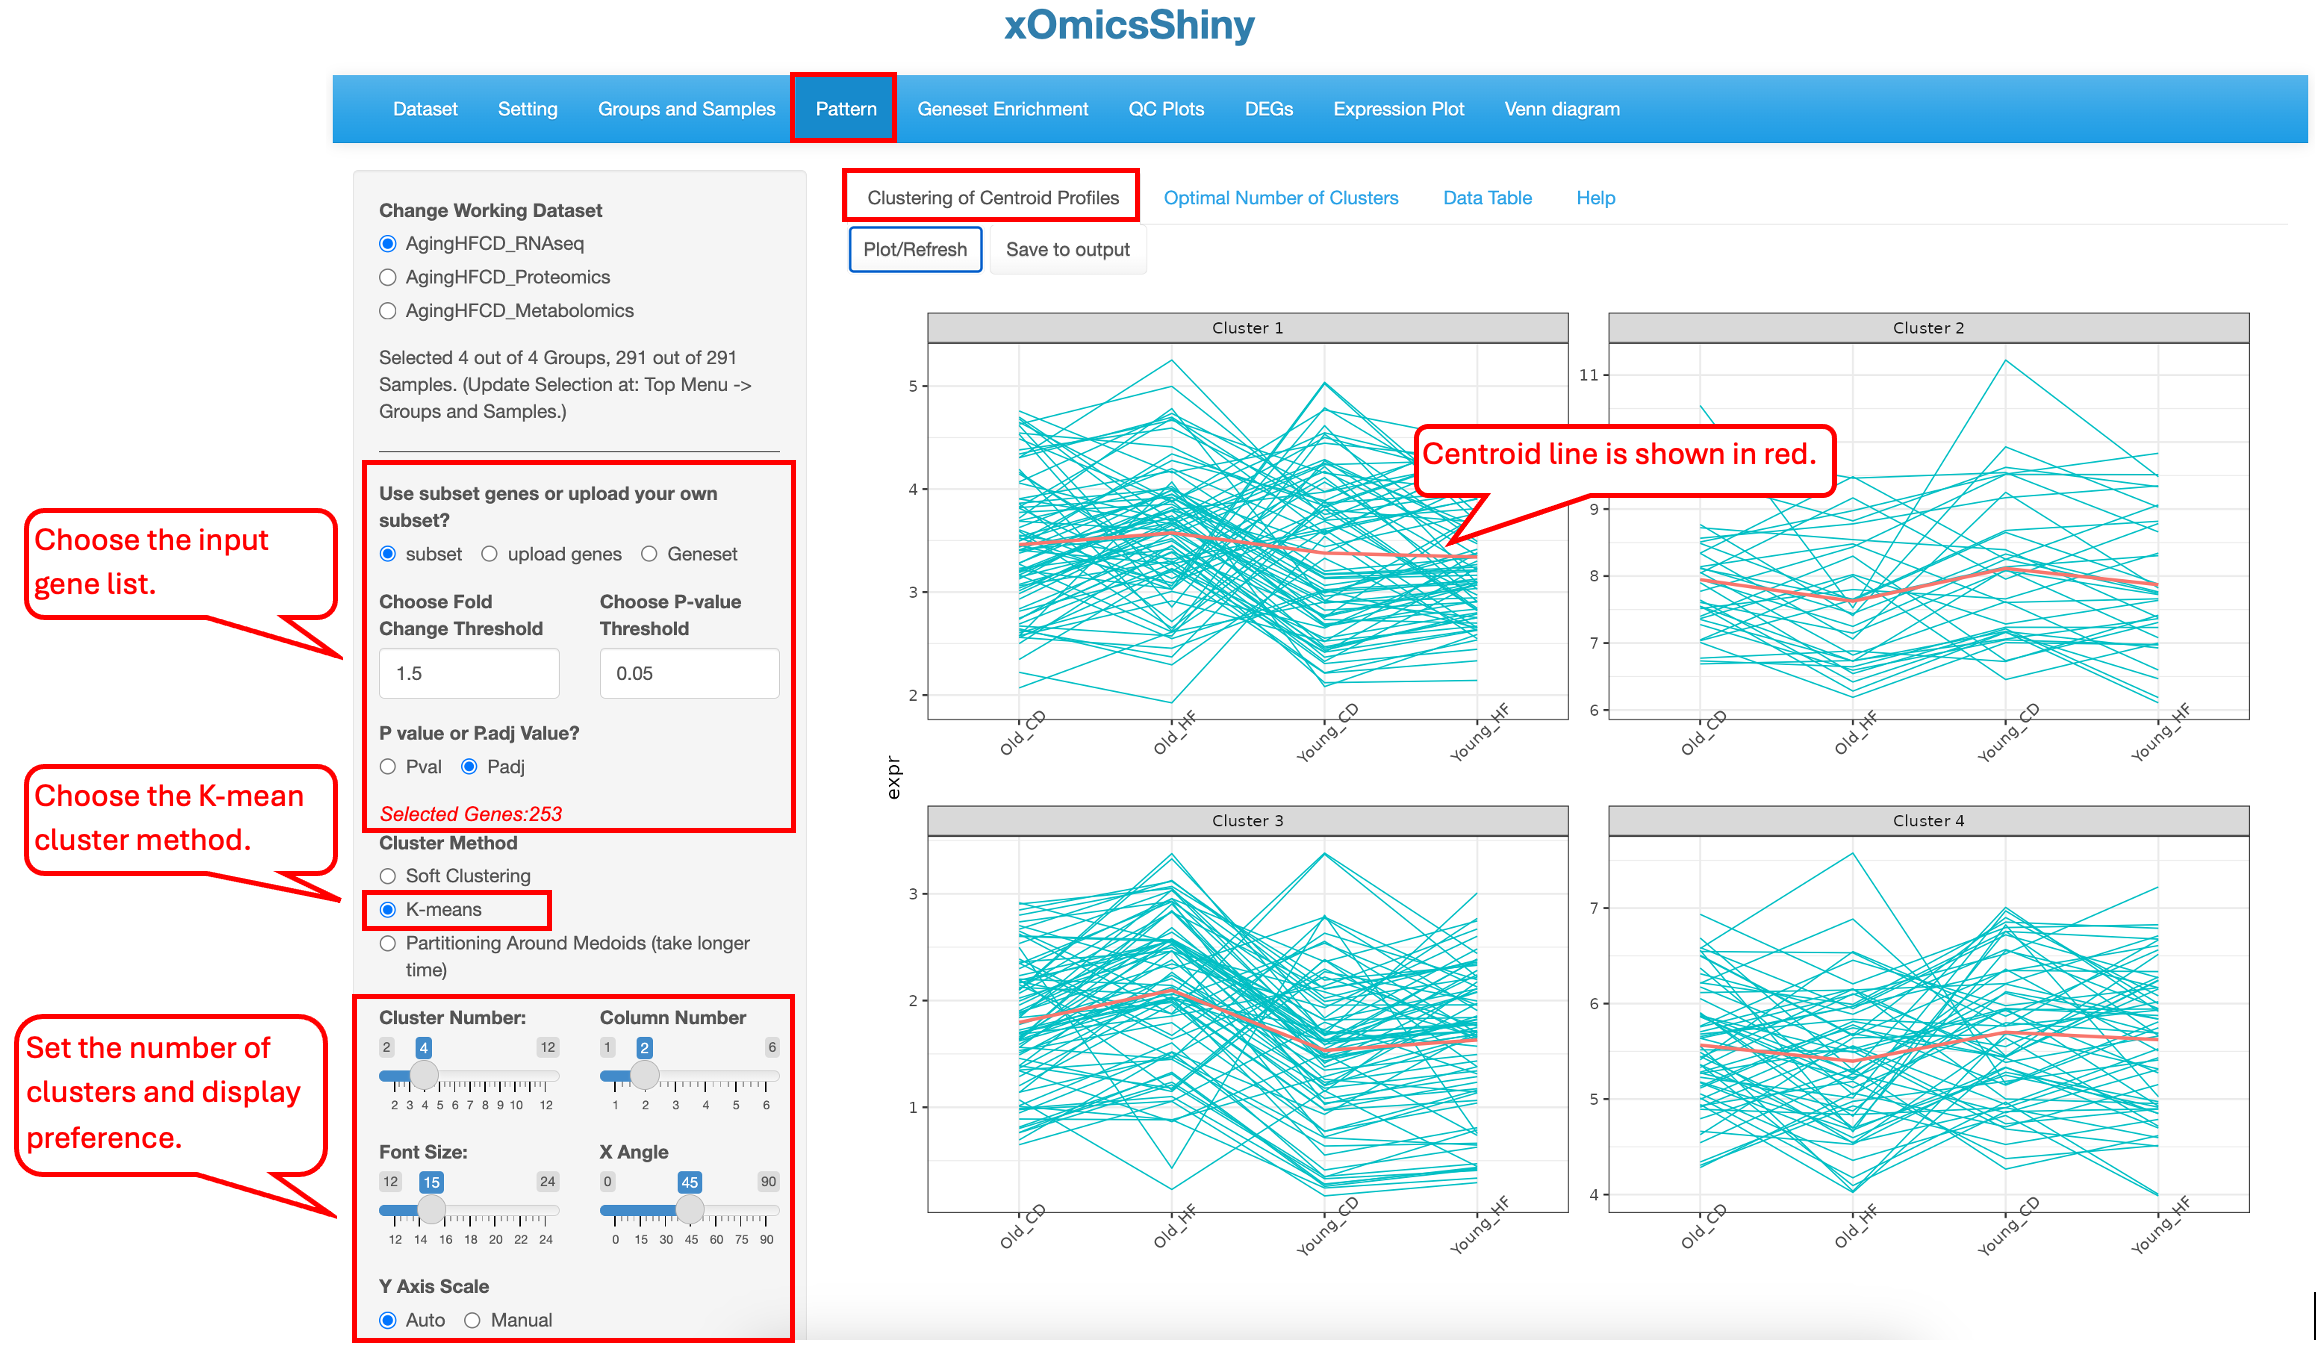
K-means clustering is a hard clustering algorithm. With a pre-defined number of centroids (same number of clusters), it allocates every data point to the nearest cluster.
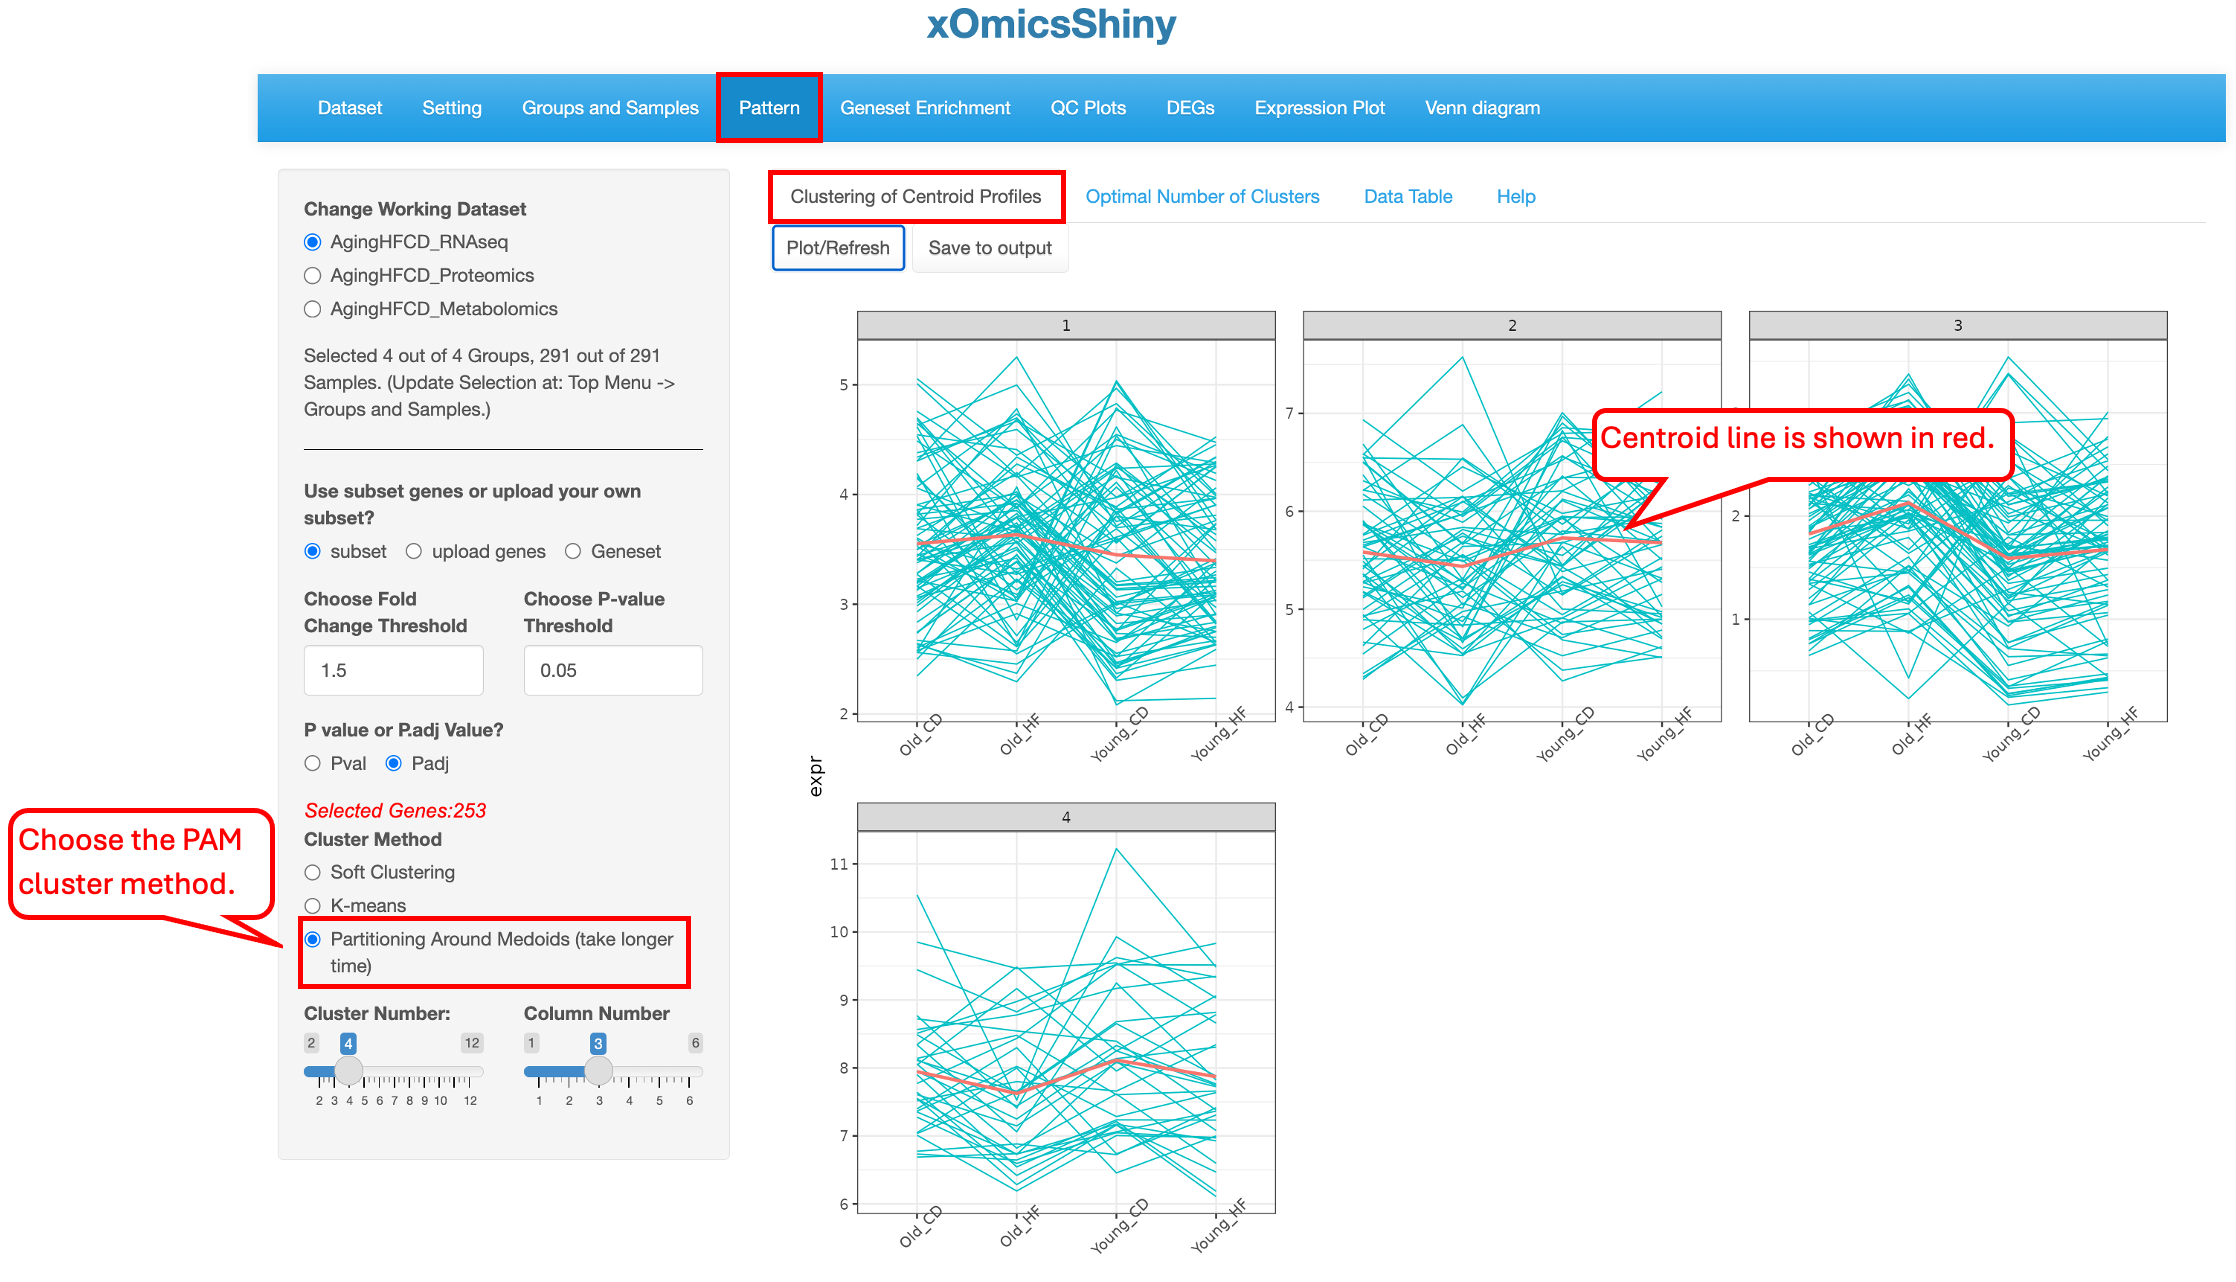
partitioning around medoids clustering is another hard clustering. It differs from K-means clustering in that it uses the real data point as the medoids and it’s less sensitive to the outliers. This algorithm is more complex and takes longer time than K-means clustering.
10.2 Optimal Number of Clusters
This functionality helps users to determine the optimal number of clusters. Three different methods, silhouette (average silhouette), wss (within cluster sums of squares) and gap_stat (gap statistics), are provided.
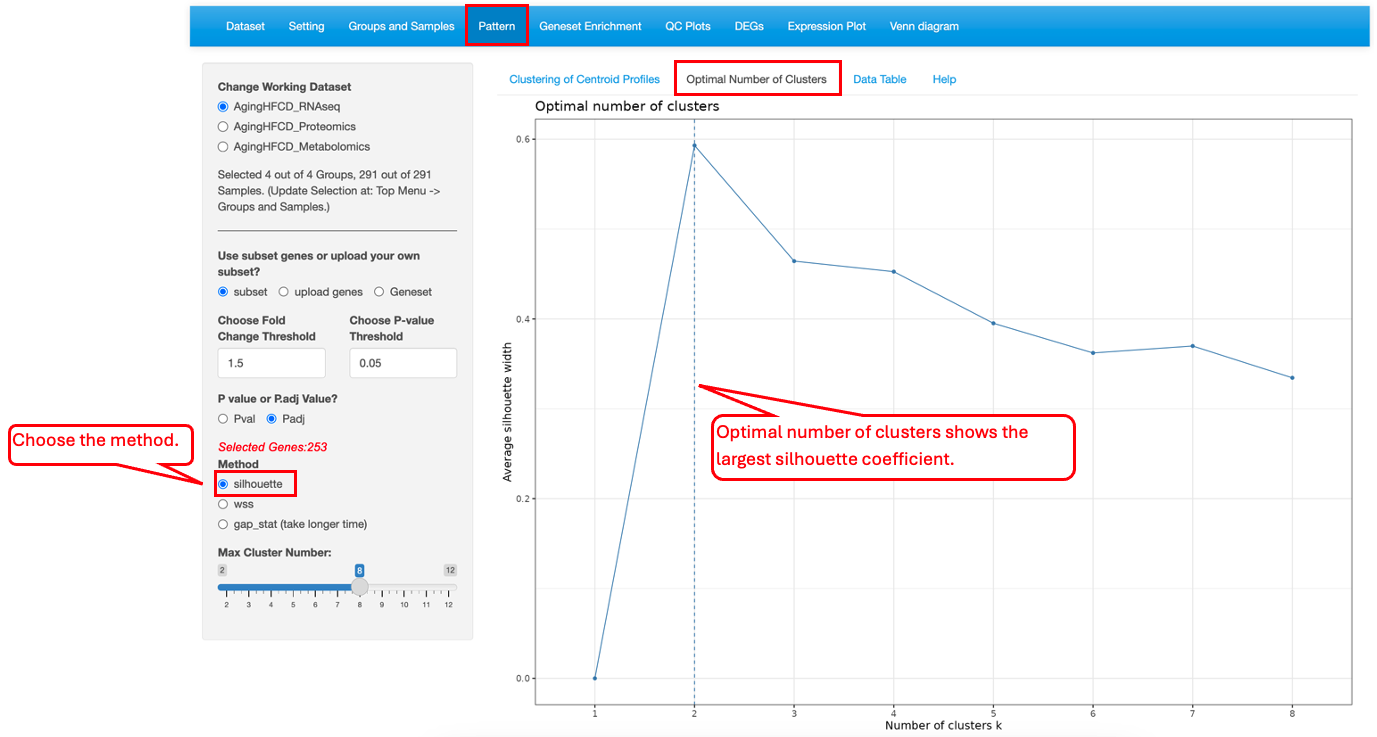
For silhouette method, the optimal number of clusters are the X-axis value that shows the maximum Y-axis value (silhouette coefficient).
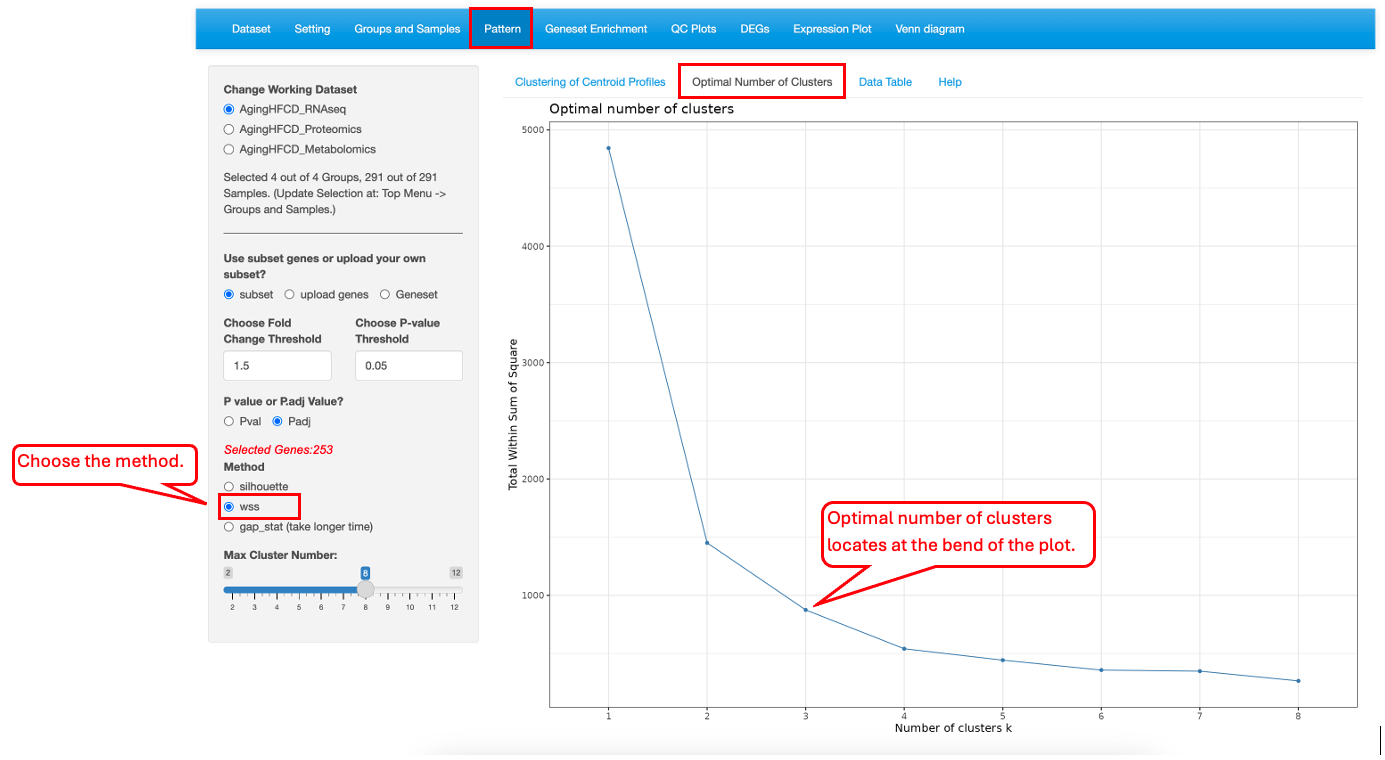
For wss method, the optimal number of clusters can be determined by the location of a bend(knee) in the plot.
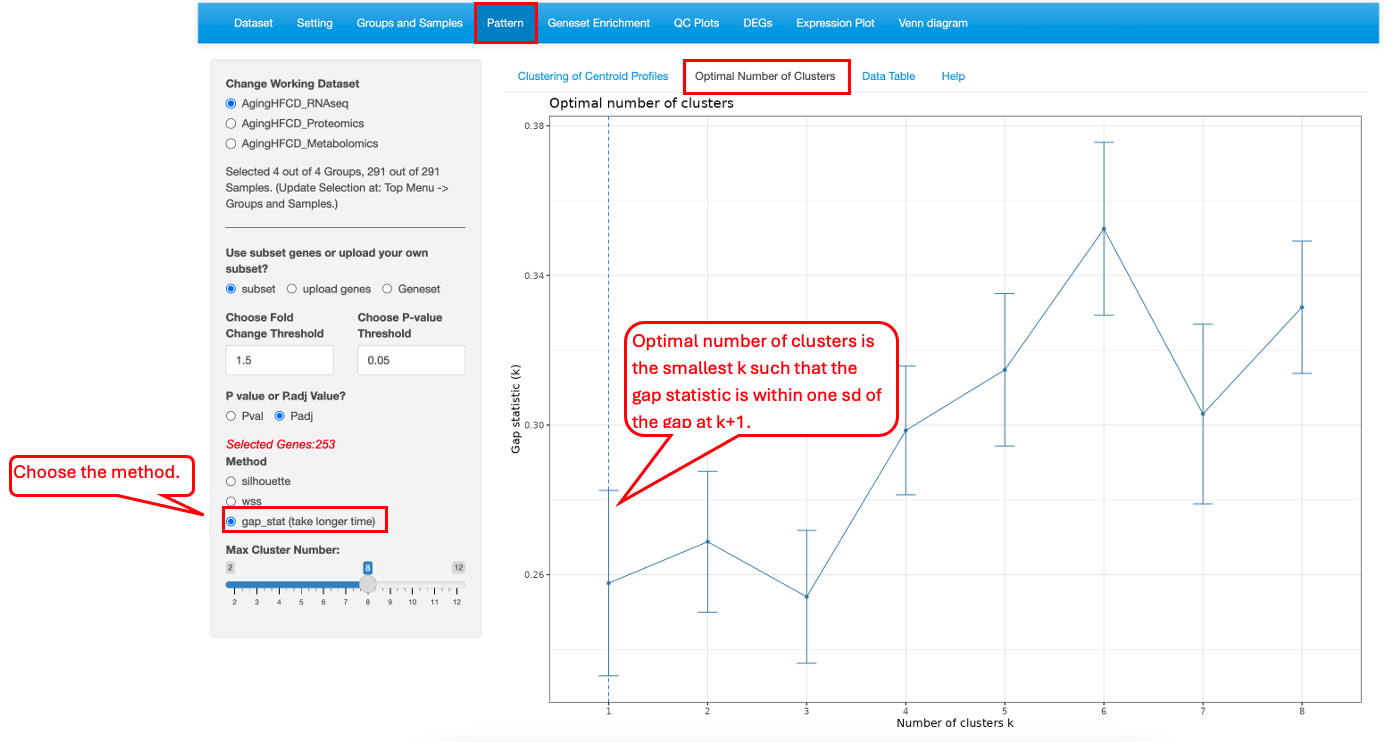
For gap_stat methods, the optimal number of clusters can be chosen as the smallest value of k such that the gap statistic is within one standard deviation of the gap at k+1. Sometimes the gap function starts to rise again after dropping as k increase, which indicates the data has subclusters within the larger main clusters.