Chapter 18 Comparison Result Merging Module
This module enable users to combine multi-omics data analysis results at the comparison level (i.e., the differential expression analysis result). This function is designed for the users when they have different datasets from the same or similar study and would like to navigate them together. However, unlike other tools such as MOFA, our tool does not integrate the datasets at the raw data level. Users need to process the data and acquire differential expression comparison results before using xOmicsShiny.
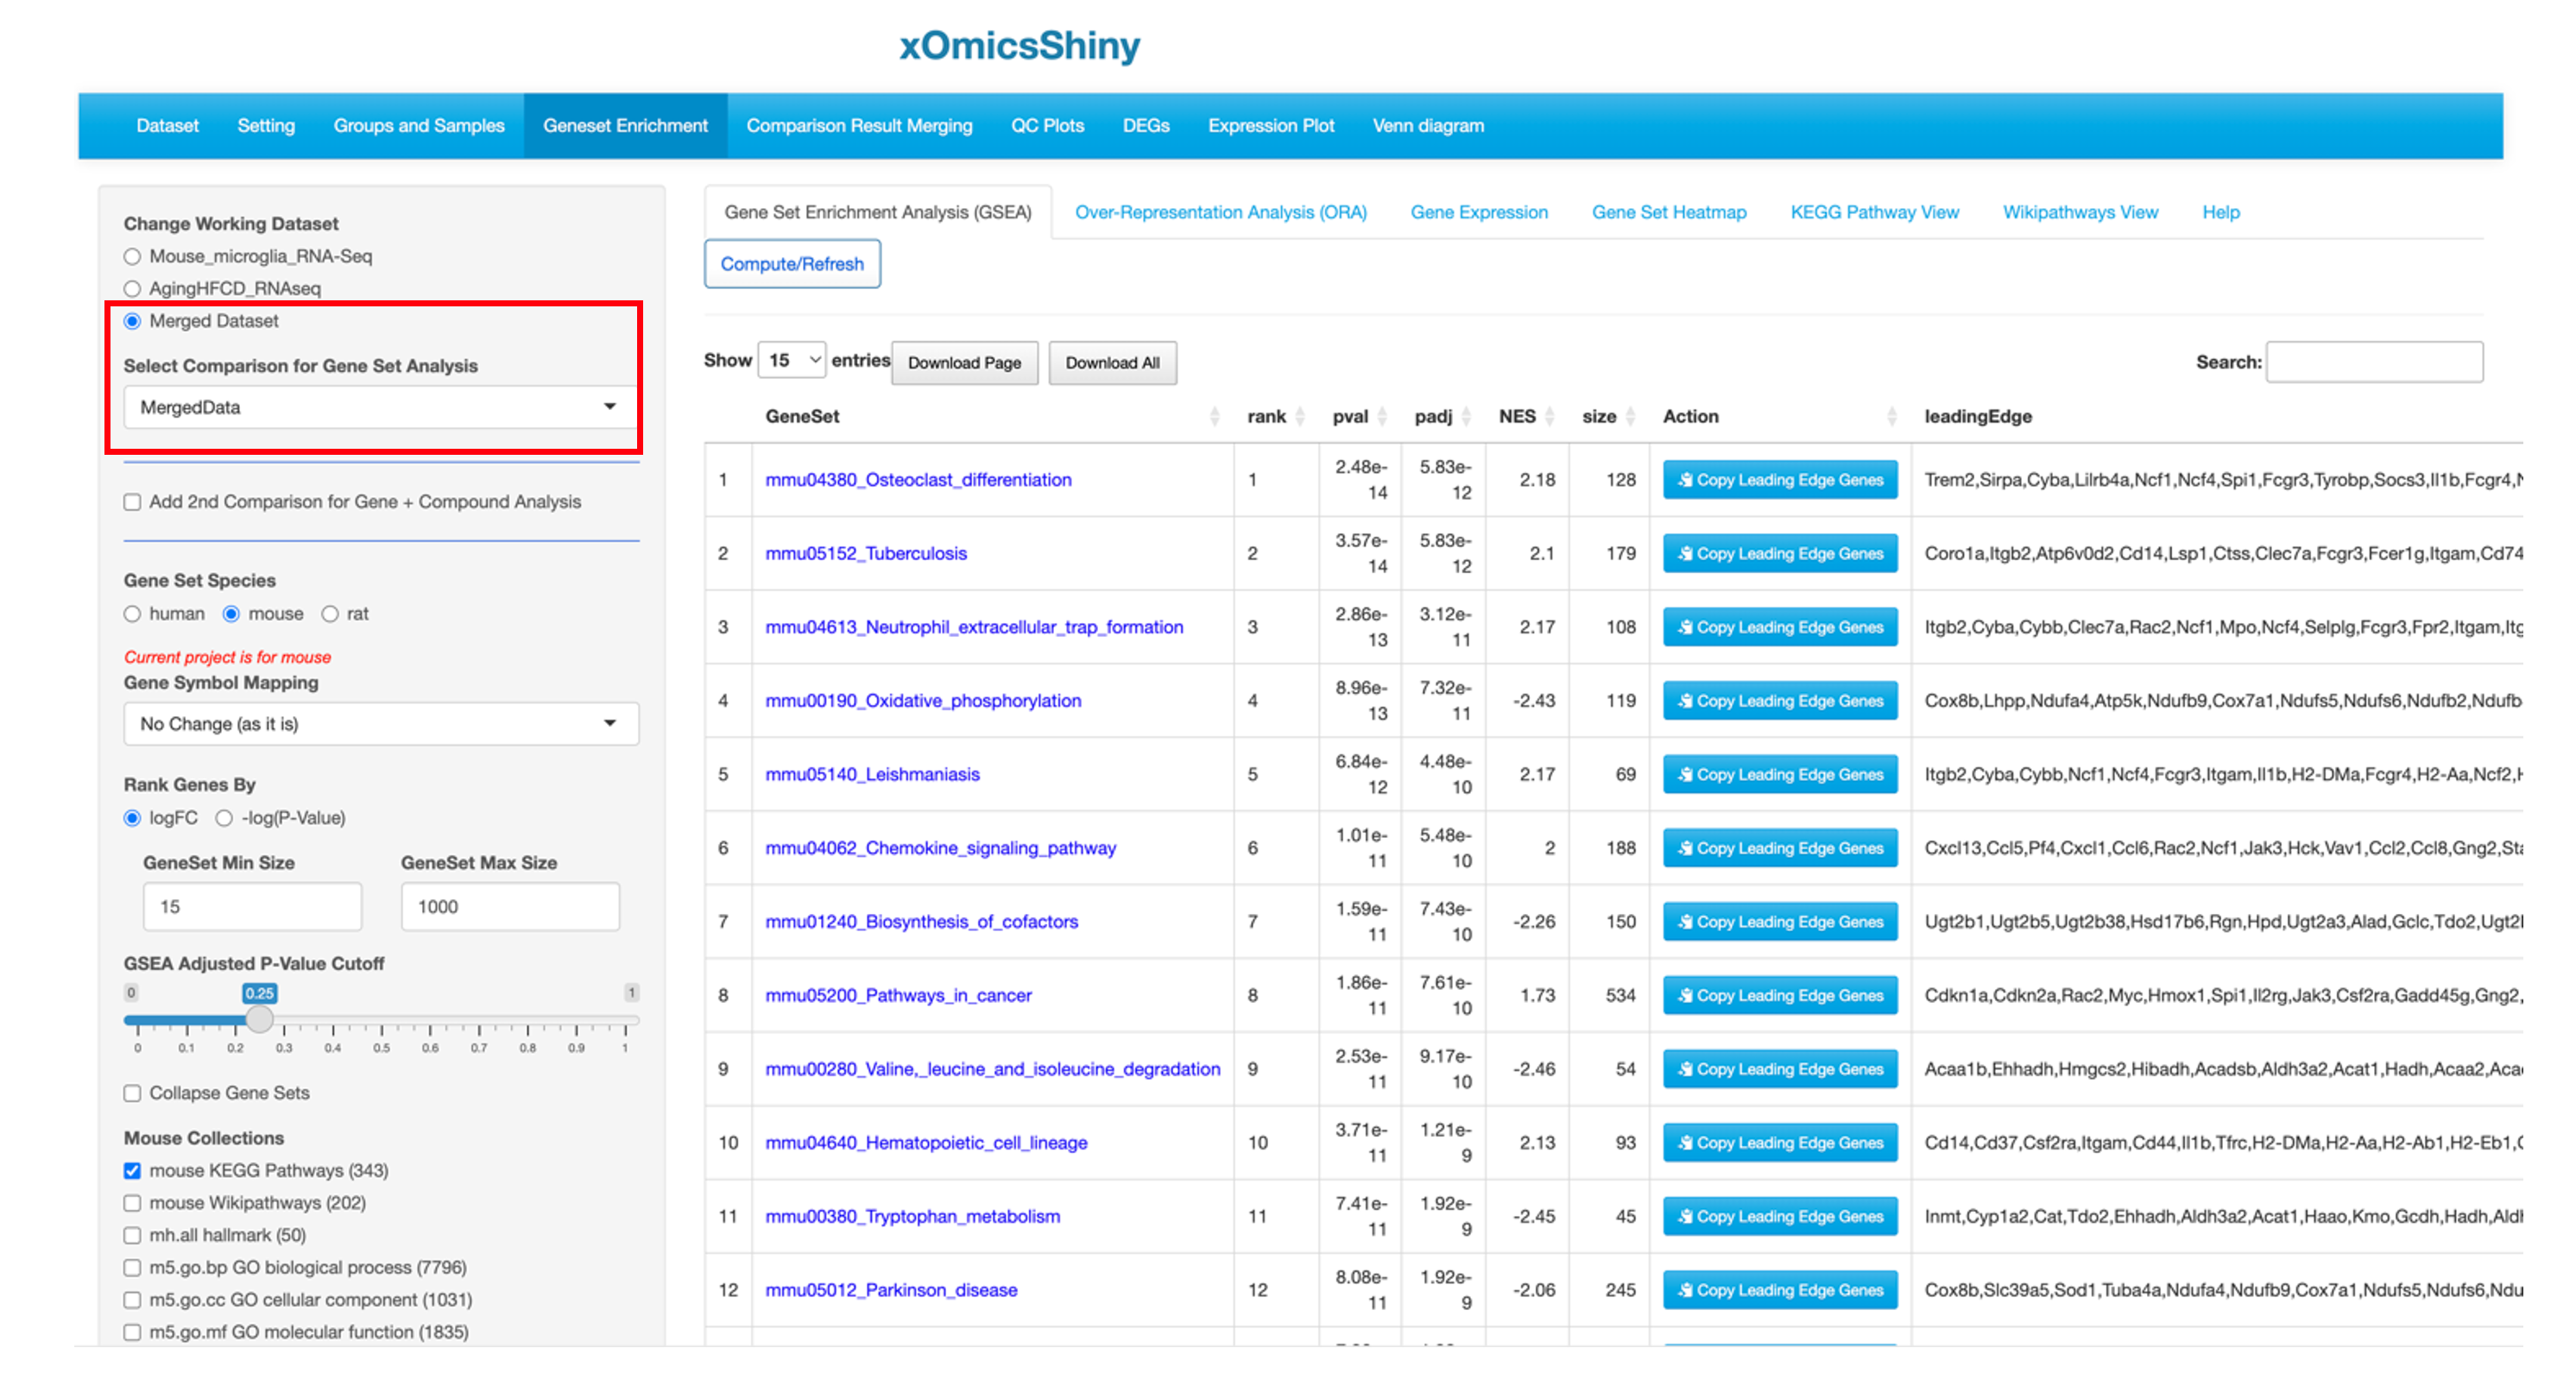
The merged output can be considered as a new comparison, and it does not have raw data values. Thus, after merging the comparison results, users can apply the modules that don’t require raw data to this merged result. For example, users can visualize the merged output using many functions that described previously in the tutorial, such as the aforementioned DEG visualization in Chapter 6, Venn diagram in Chapter 13, and pathway enrichment analysis in Chapter 9, etc.
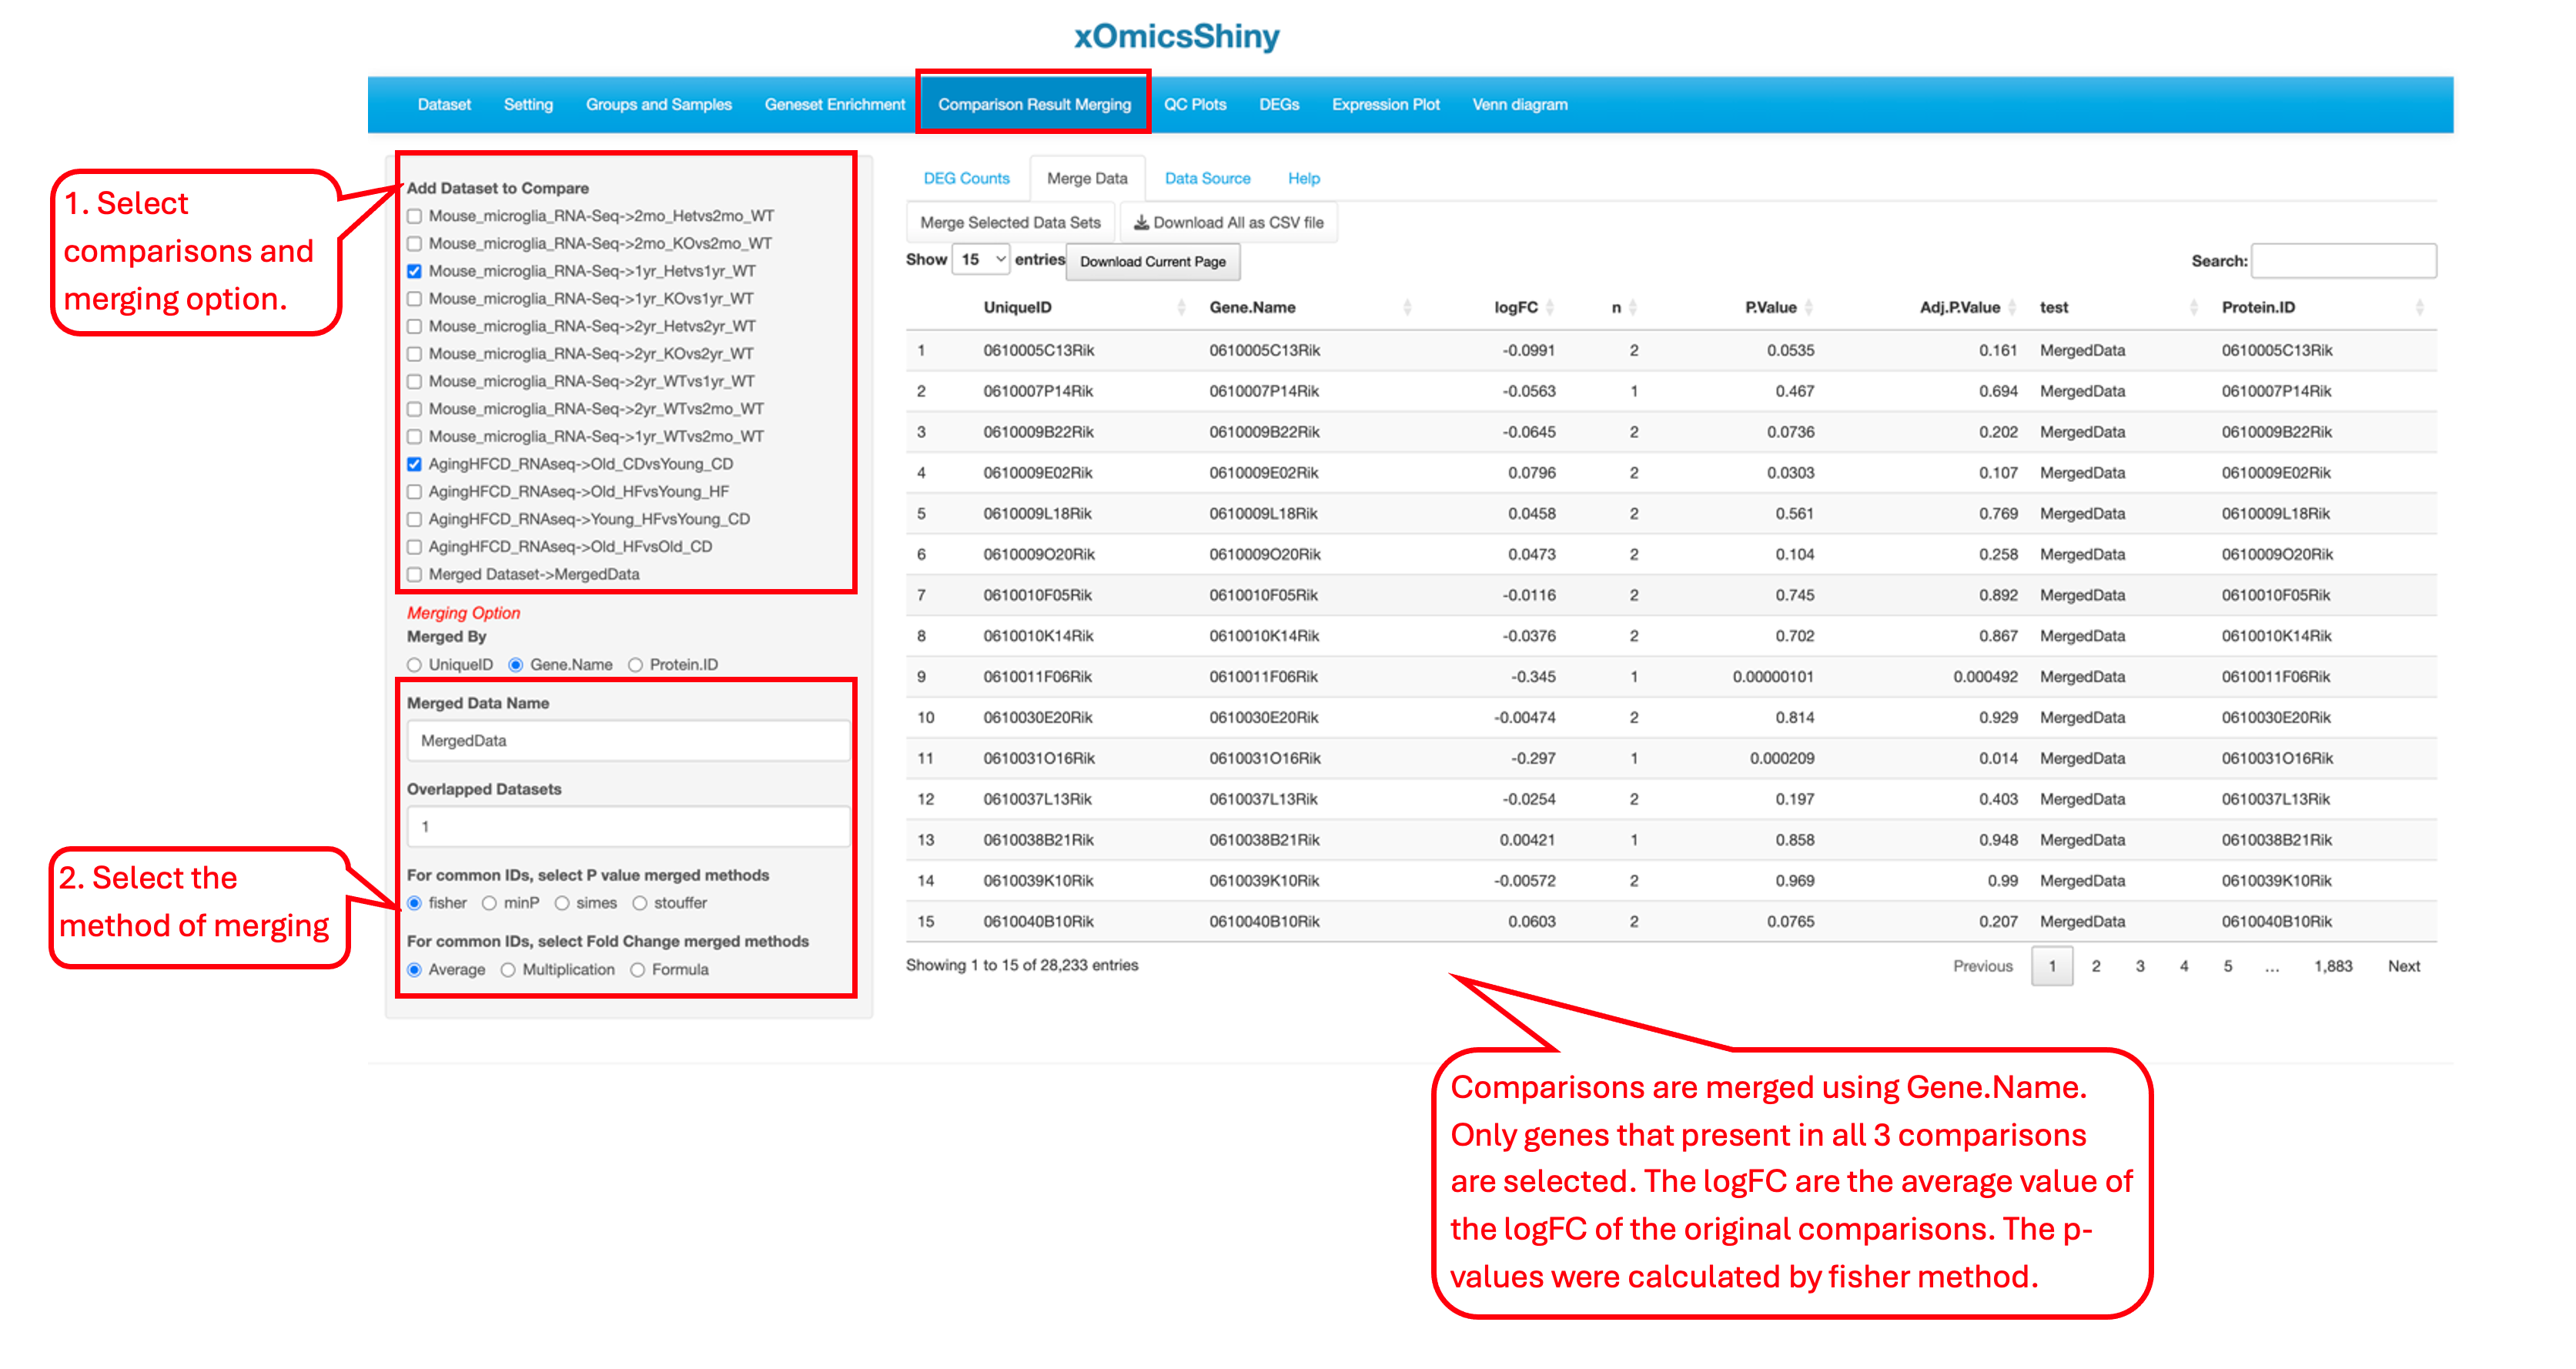
18.1 Merge Comparisons
The comparisons in the pre-loaded datasets can be merged using one of four methods: union, overlap (intersect), distinct, and simple append. Depending on the chosen method, users need to set the Overlapped Datasets cutoff to retain only the genes that appear in a number of comparisons equal or greater than the cutoff. If the merging process involves the same gene from different comparisons, we offer four methods for merging p-values: Fisher (χ²-based method), minP (minimum p-value), Simes (uses ordered p-values to determine significance), and Stouffer (applies the inverse standard normal cumulative distribution function to p-values). Additionally, there are three methods for merging fold change values: average, multiplication, and formula (a linear combination of the fold changes).