Chapter 10 Correlation Analysis Module
This module measures how closely two things change together across the samples. Four types of correlation are offered under “Correlation Type”. Gene-Gene, Sample-Sample and Group-Group correlate each pair of the selected genes, samples or groups (Section 10.1). Gene-Target correlates every gene with one target, which can be a gene or a sample attribute such as Age (Section 10.2).
To see the correlation of all samples at once, use the sample correlation heatmap in the QC Plots module (Chapter 4). This module uses the samples selected in the “Groups and Samples” module (Chapter 3). Each tab has a green link that opens a short guide.
10.1 Gene-Gene, Sample-Sample and Group-Group
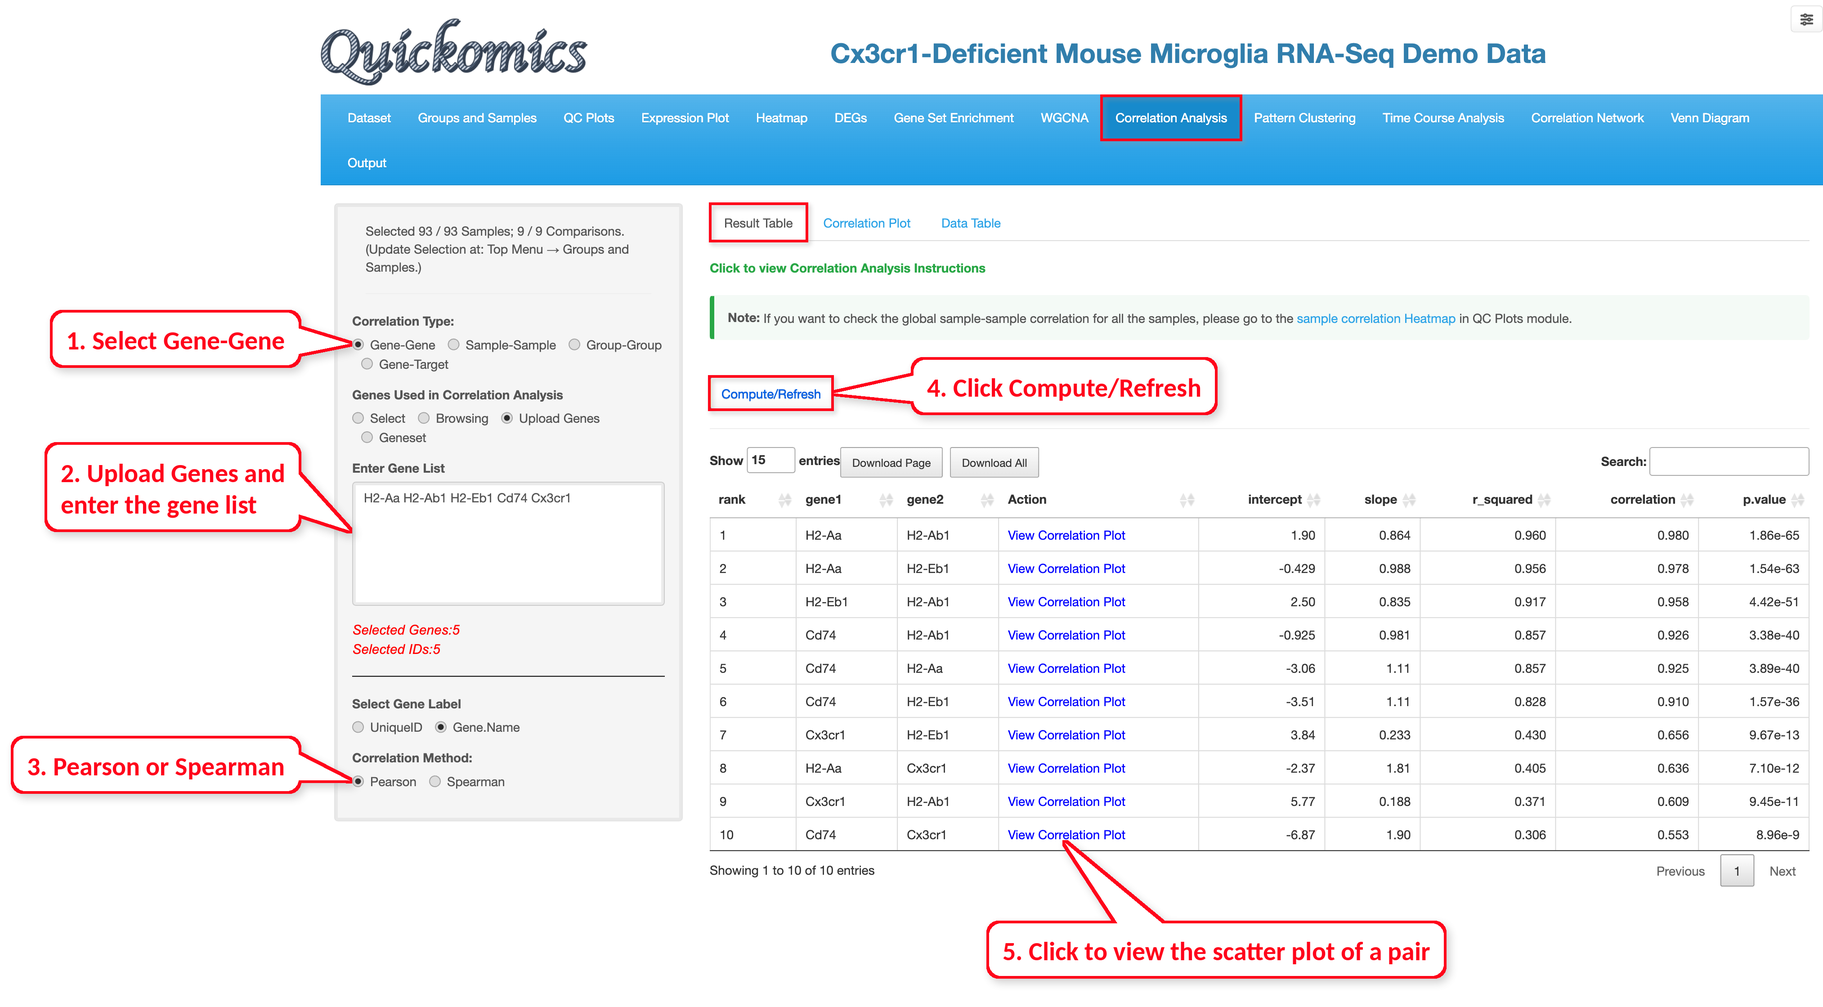
Select the correlation type and the genes, samples or groups to compare, choose Pearson for linear relationships or Spearman for relationships that go in one direction but need not be linear, and click “Compute/Refresh”. Genes can be selected by name, browsed (“Browsing” takes the DEGs/DEPs of one of the selected comparisons that pass the fold change and P value or adjusted P value cutoffs, all of them or only the up- or down-regulated ones), entered as a list with “Upload Genes”, or taken from a gene set.
The “Result Table” lists every pair with its correlation, R squared and P value, ranked from the strongest correlation. In the example below, we entered the MHC class II genes H2-Aa, H2-Ab1, H2-Eb1 and Cd74 together with Cx3cr1. The MHC class II genes are highly correlated with each other, with correlations from 0.91 to 0.98, while their correlations with Cx3cr1 are lower, between 0.55 and 0.66.
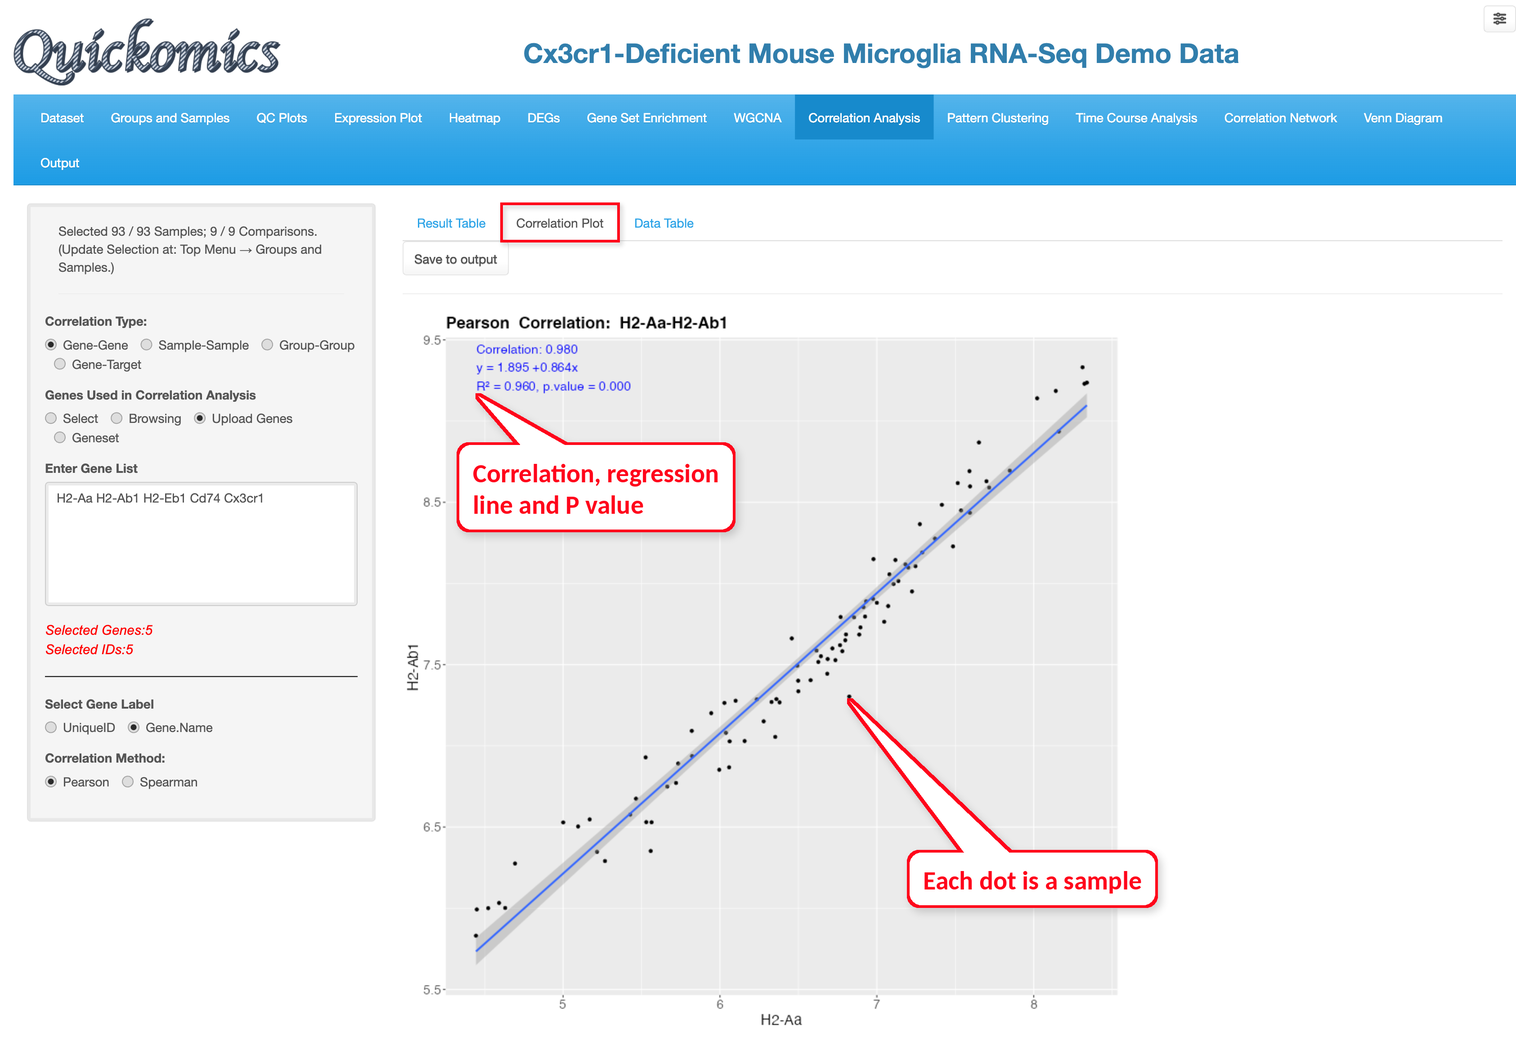
Clicking “View Correlation Plot” in a row opens the “Correlation Plot” tab with the scatter plot of that pair. Each dot is a sample, and the plot shows the correlation, the regression line and its equation, and the P value. Below is the plot for H2-Aa and H2-Ab1, with a correlation of 0.980. The “Data Table” tab lists the values used.
Sample-Sample and Group-Group correlations are set up in the same way, by selecting at least two samples, or an attribute and at least two of its groups. These correlations are computed over the genes chosen under “Genes Used in Correlation Analysis”: all genes (the default), or the genes from Browsing, Upload Genes or a gene set. Group-Group correlations use the mean expression of each group.
10.2 Gene-Target
Gene-Target correlates every gene with one target across the individual samples, to find the genes that go up and down with it.
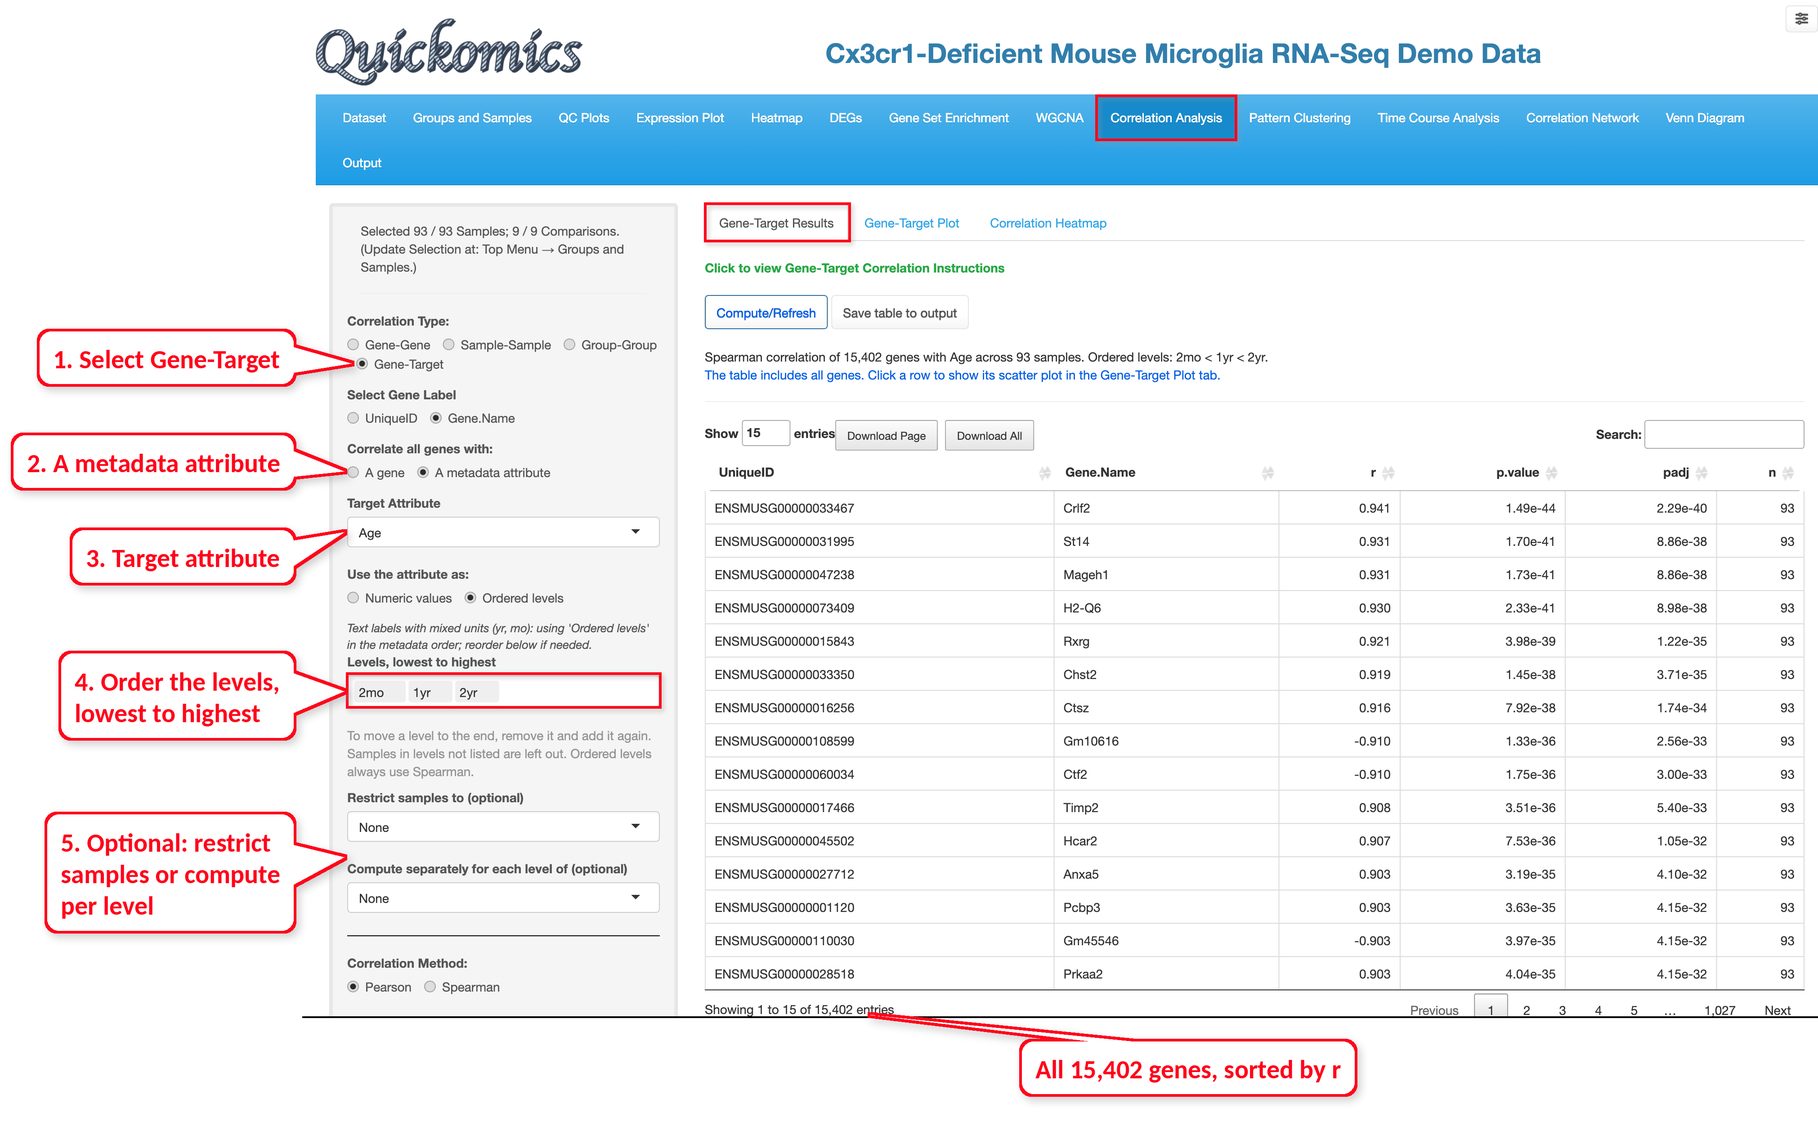
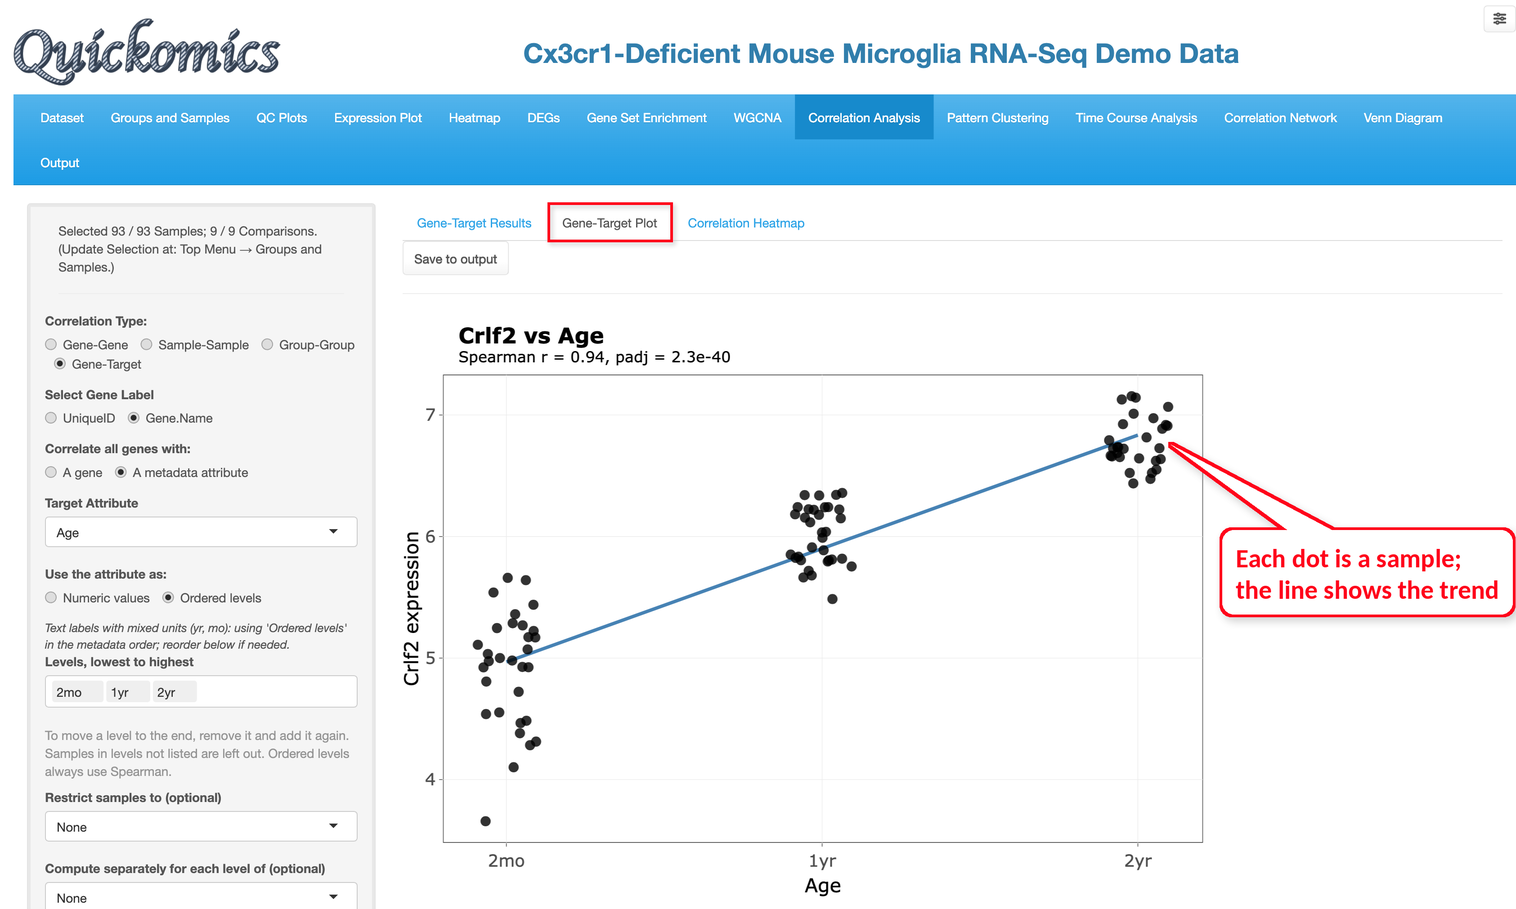
The target can be a gene or a sample attribute. Numeric attributes, such as a dose or a score, are used as they are. For text levels with an order, choose “Ordered levels” and list the levels from lowest to highest; Spearman correlation is then used. Because the ages of the demo dataset are given in different units (2mo, 1yr and 2yr), the app uses “Ordered levels” for Age, and we put the levels in the order 2mo, 1yr, 2yr.
After clicking “Compute/Refresh”, the table lists all 15,402 genes sorted by their correlation with Age. Crlf2, St14, Mageh1 and H2-Q6 have the highest correlations, above 0.93, while genes such as Gm10616 and Ctf2 have negative correlations, so they decrease with age.
The samples can also be limited to some levels of an attribute with “Restrict samples to”. The table can be saved with “Save table to output”.
Clicking a row in the table shows the gene in the “Gene-Target Plot” tab. Each dot is a sample, and the line shows the trend. Crlf2 increases steadily from 2mo to 1yr to 2yr, with a Spearman correlation of 0.94.
With “Compute separately for each level of”, the correlation is computed separately within each level of another attribute, and the table gets one set of columns per level.
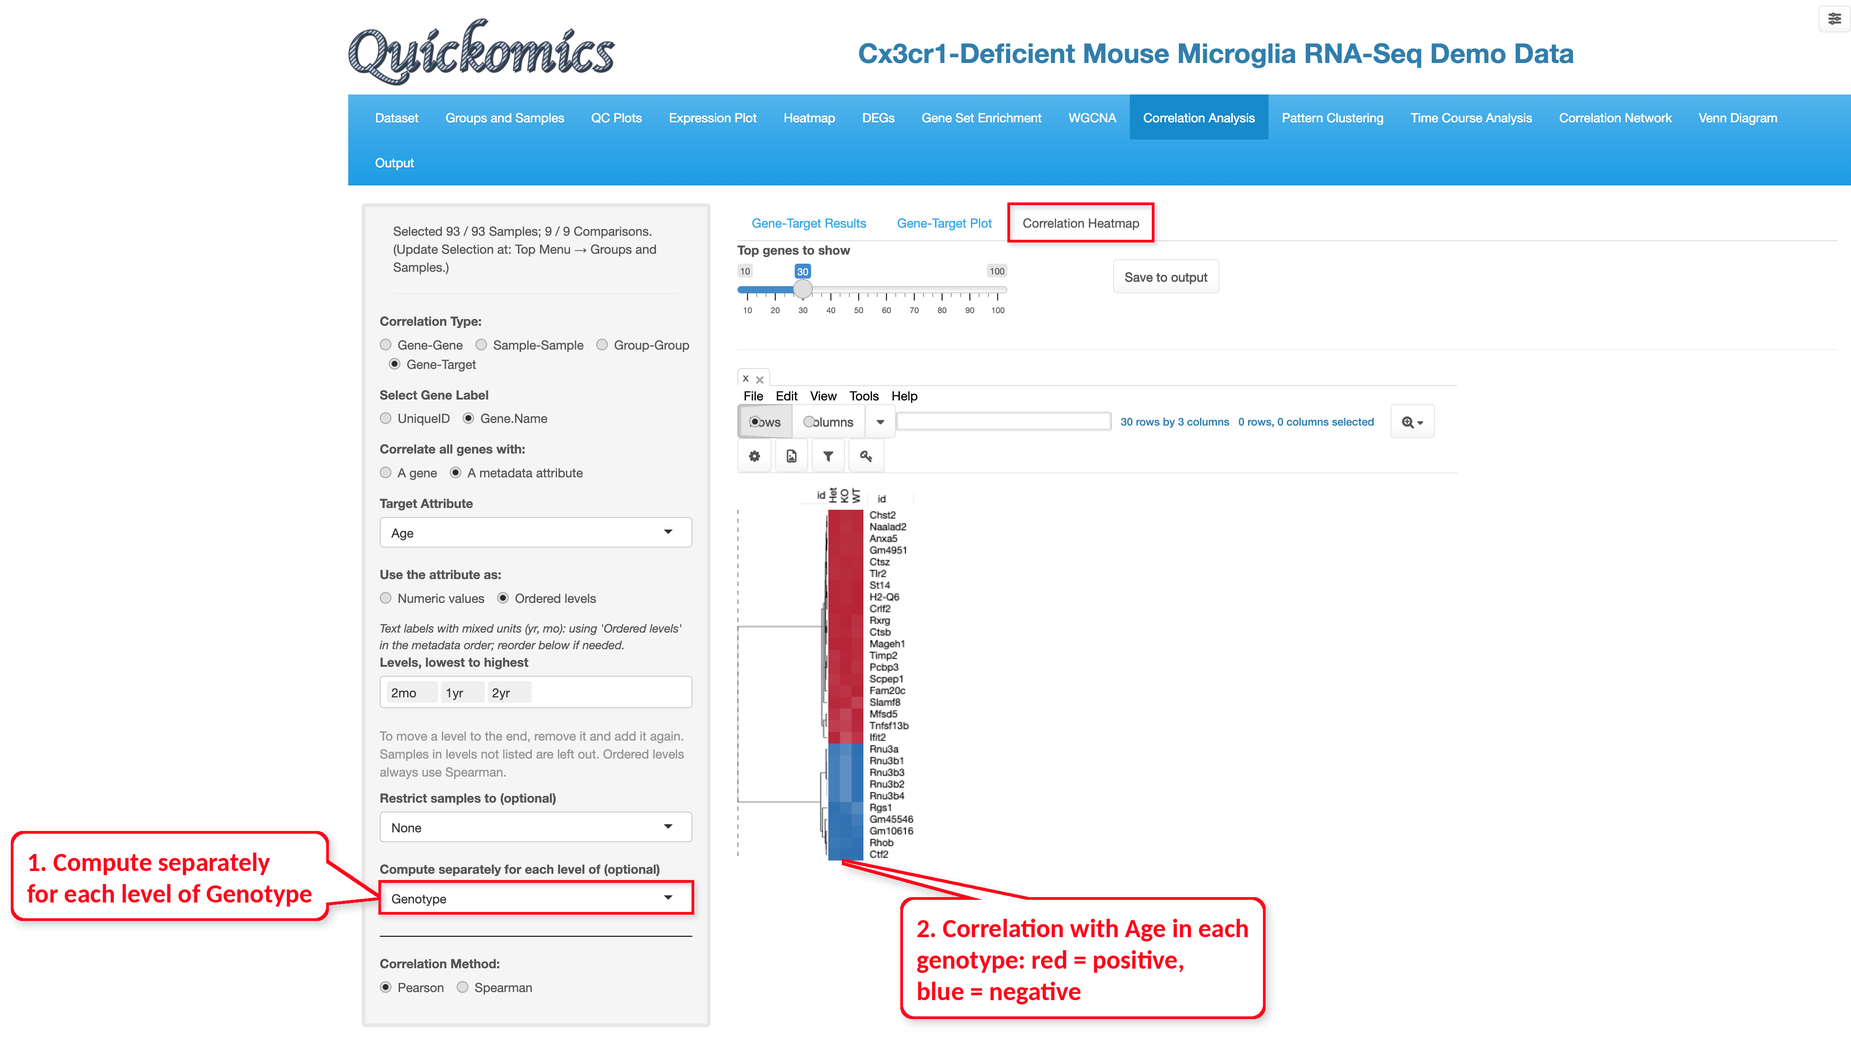
In the example below, we computed the correlation with Age separately for each genotype. For each genotype, Het, KO and WT, the table gives the correlation of each gene with Age (r), its P value, adjusted P value and number of samples (n). max_abs_r is the largest absolute correlation of the three, and the table is sorted by it. For example, the top gene, Rxrg, has correlations of 0.921 in Het, 0.943 in KO and 0.892 in WT.
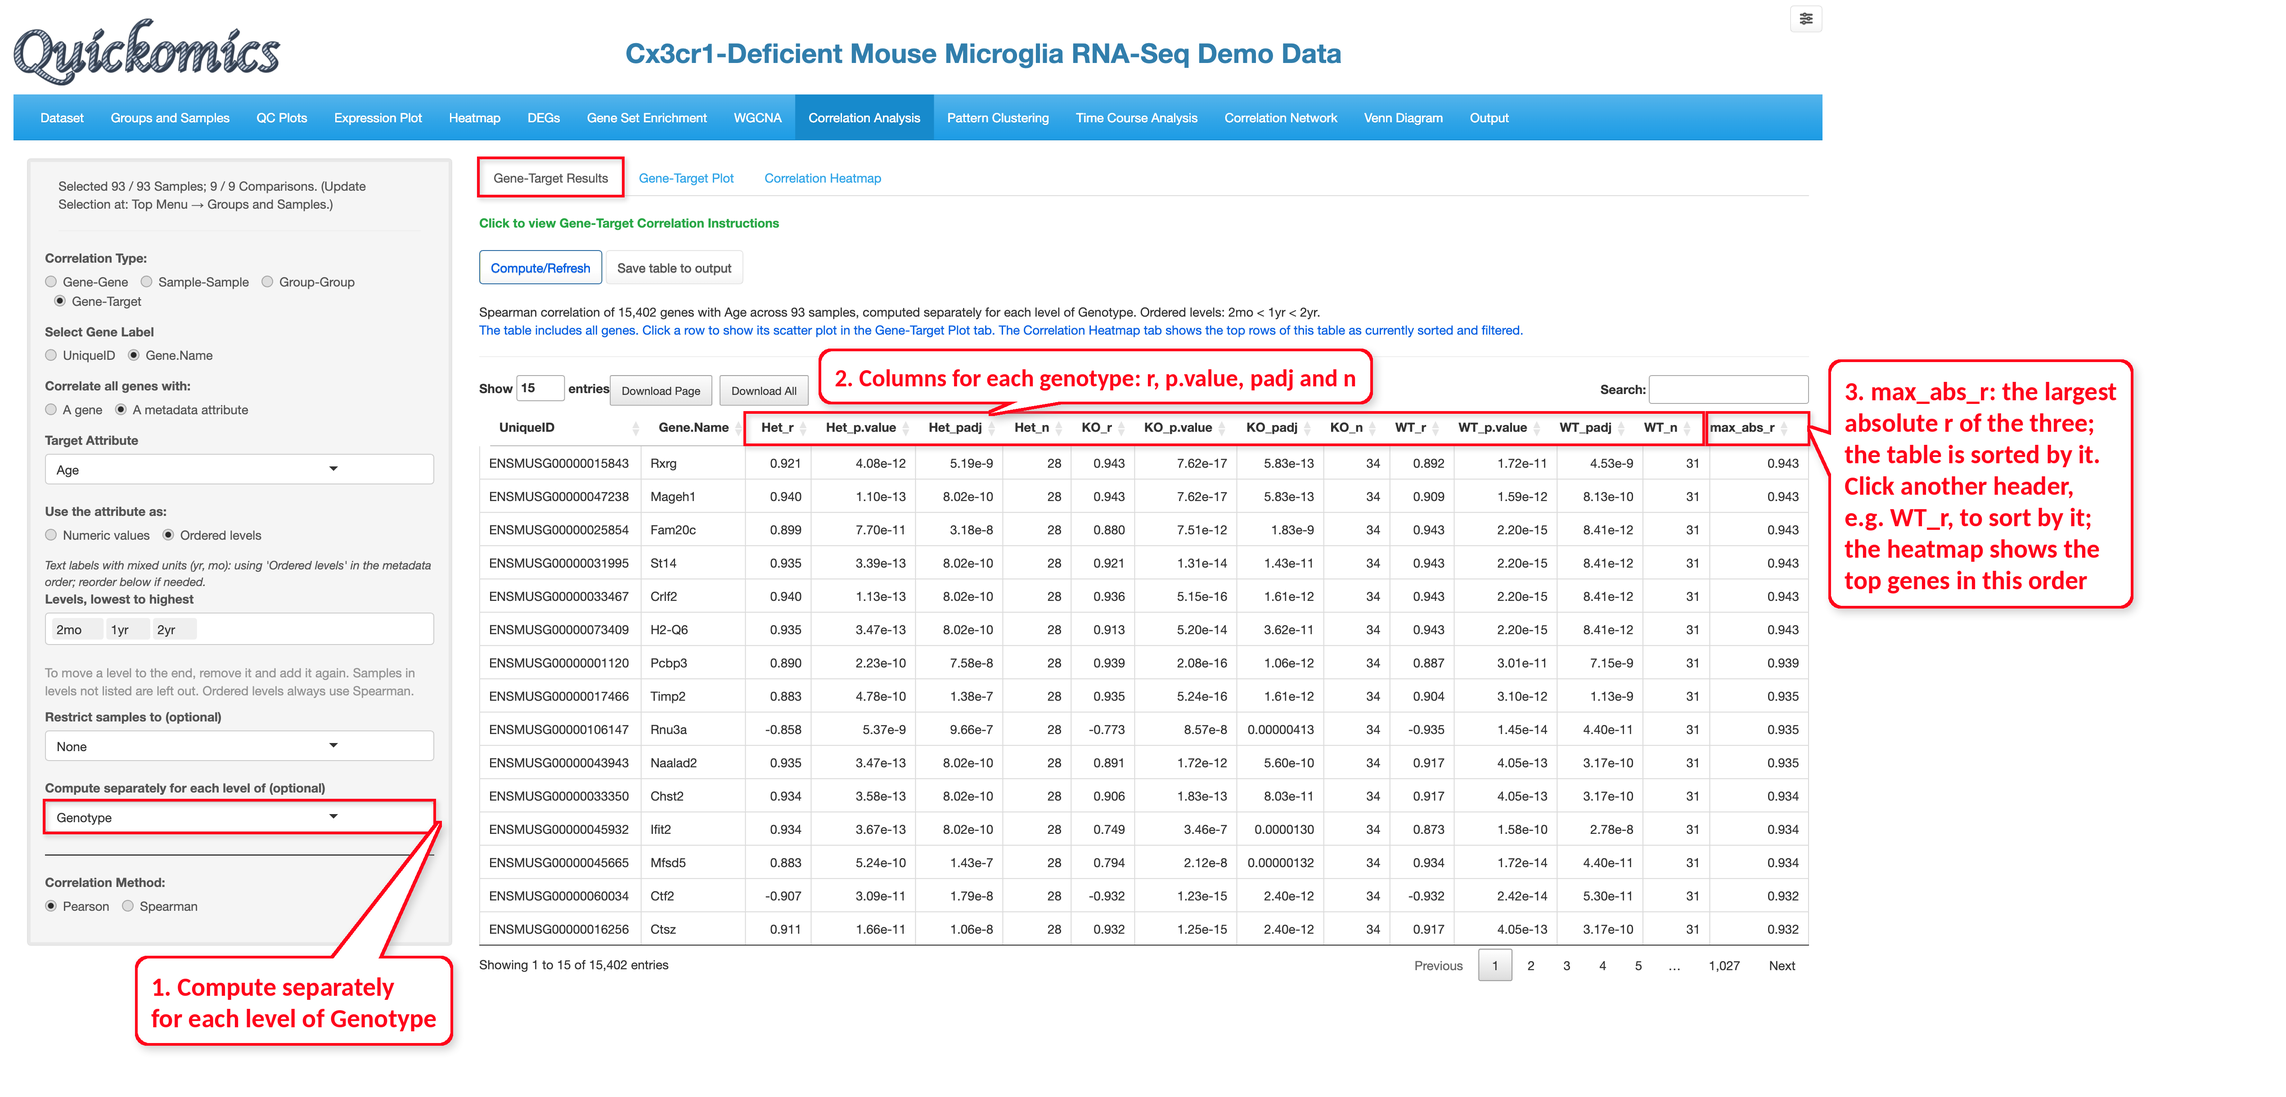
The “Correlation Heatmap” tab then shows the correlations of the top genes in the table, one column per level, with red for positive and blue for negative correlations; the number of genes is set with “Top genes to show”. The heatmap follows the order of the table, so sorting the table by the column of one genotype, such as WT_r, shows the top genes of that genotype instead.
Below are the 30 genes with the highest max_abs_r. The top 30 genes have the same direction in Het, KO and WT, so their change with age does not depend on the genotype.