Chapter 8 Gene Set Enrichment Module
This functionality in Quickomics is an extension to the differential gene identification. Users are able to use different cutoffs to filter out DEGs/DEPs in different comparisons and probe enriched pathways. This is a useful way to make biological sense of the data. We also improved the robustness of Gene Set Enrichment Module in Quickomics v2.0, using human gene set enrichment for unknown species instead of giving error. The updated system performs more error checking and data cleanup in the backend.
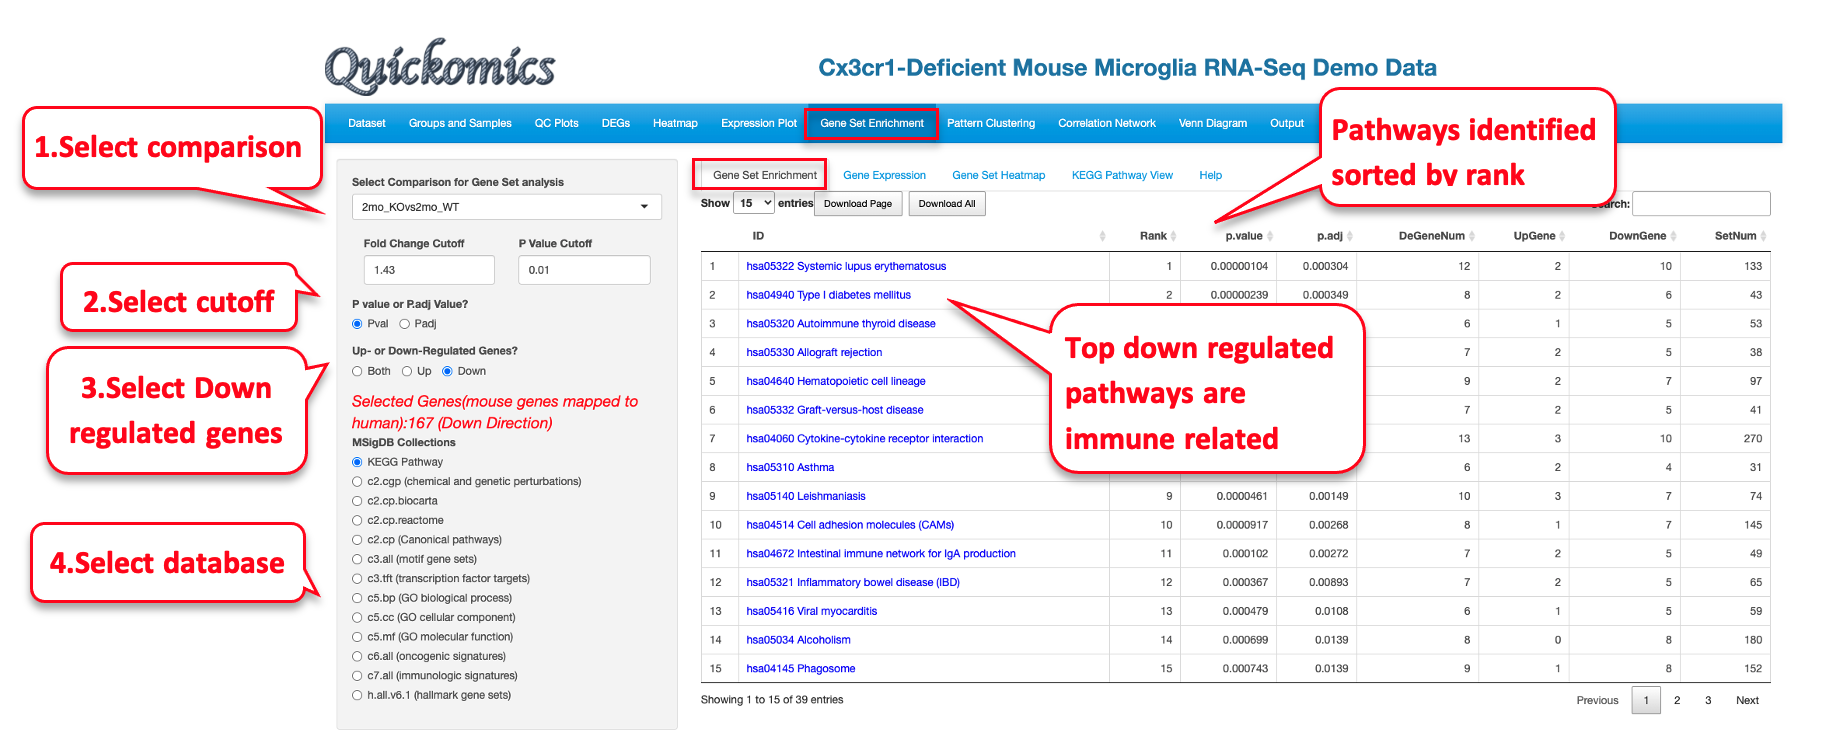
8.1 Gene Set Enrichment
This first tab lets the users pick a particular comparison, apply different cutoff criteria and select from a list of different databases for enrichment analysis. To demonstrate usage of this functionality, we will use the Mouse Microglia RNA dataset to help answer the question which pathways were altered by Genotype and/or Age. Very similar to the results from Gyoneva et al., 2019, this analysis points to immune related terms being enriched in the down-regulated genes for 2mon_KOvs2mon_WT.
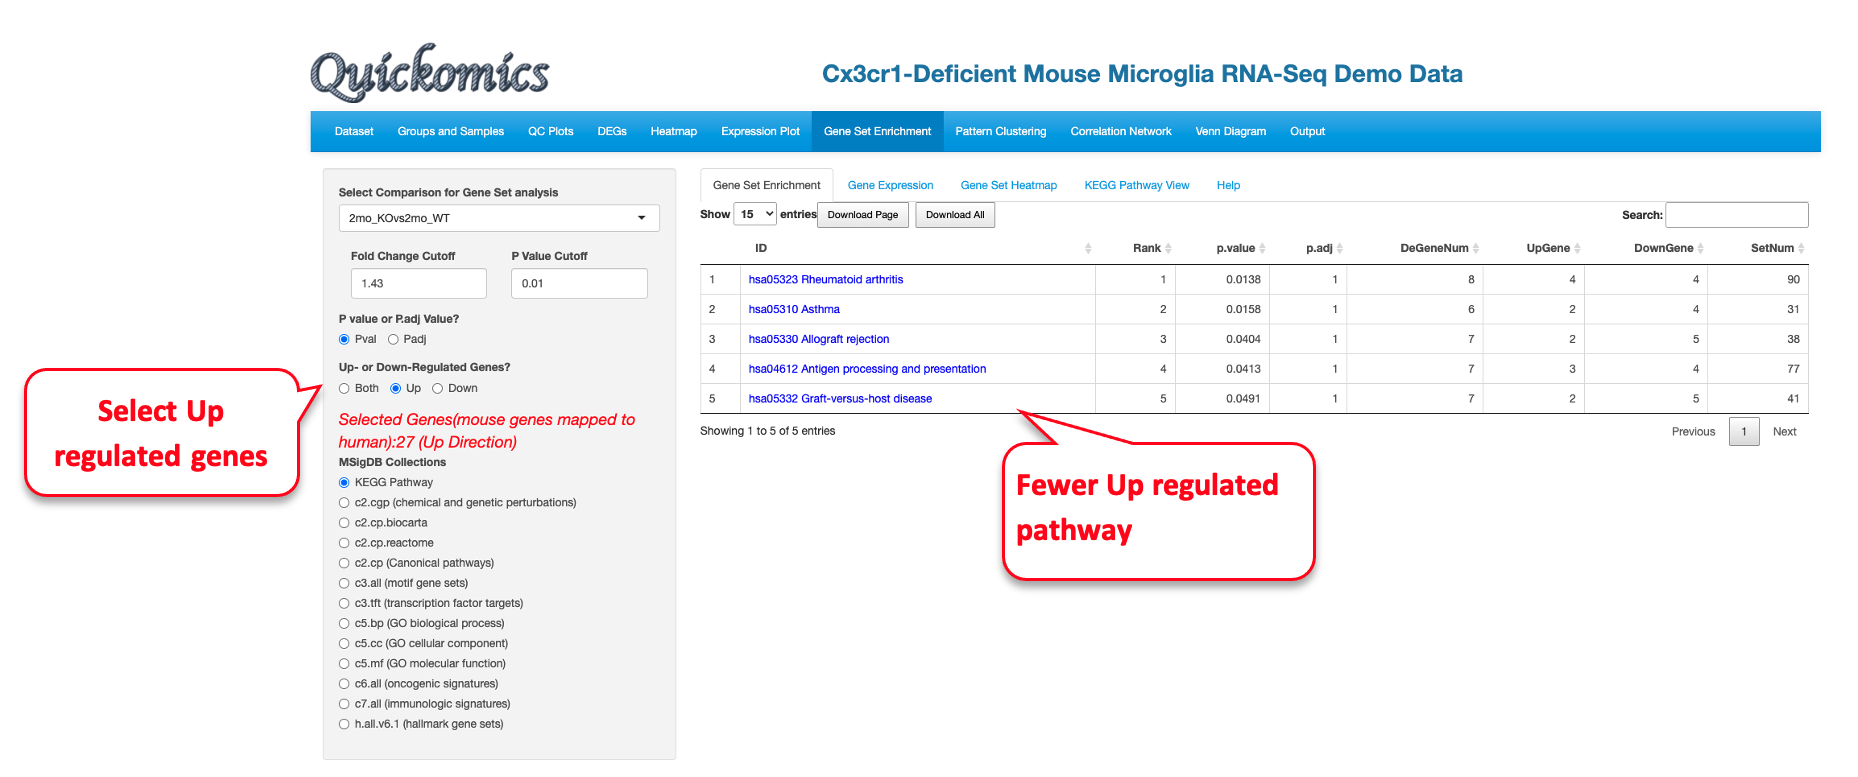
Similarly, we pull out the GO enrichment for up-regulated genes.
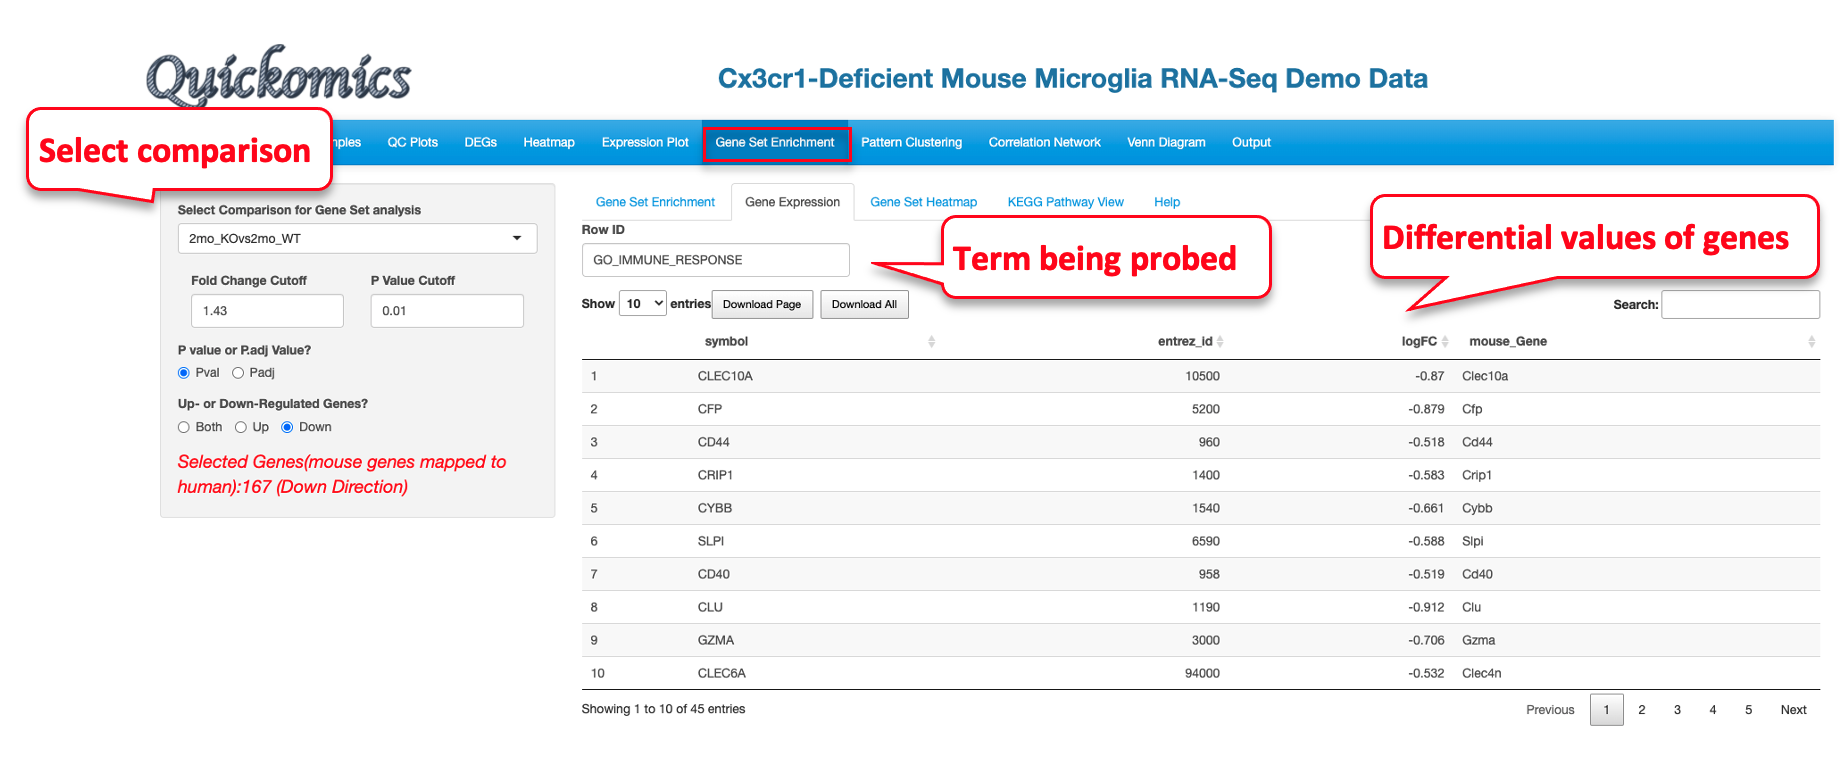
8.2 Gene Expression
For the enriched terms identified in the previous tab (Gene Set Enrichment, section 8.1), Users have the ability to look at the differential values of the genes present in the set. Here we are probing the GO_IMMUNE_RESPONSE identified in the down-regulated category.
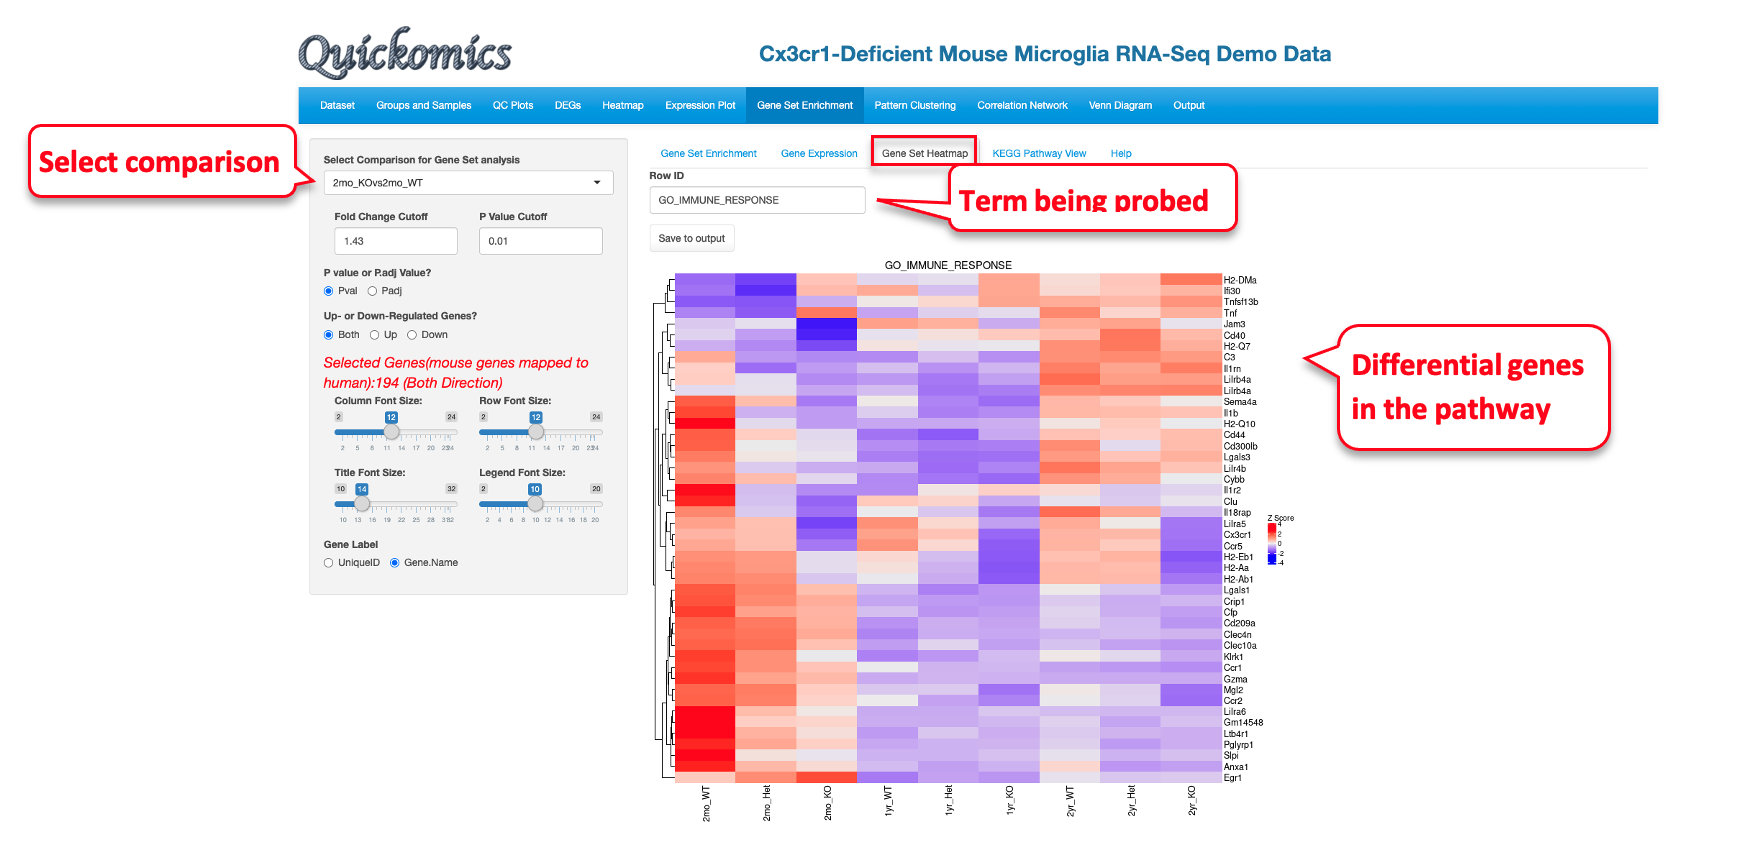
8.3 Gene Set Heat Map
Like the “Gene Expression” tab, Users have the ability to plot expression of the genes in the pathway term selected as a heatmap. This visualization shows that while the Immune Response genes are enriched in the differentially expressed genes list, not all of them change in the same direction.
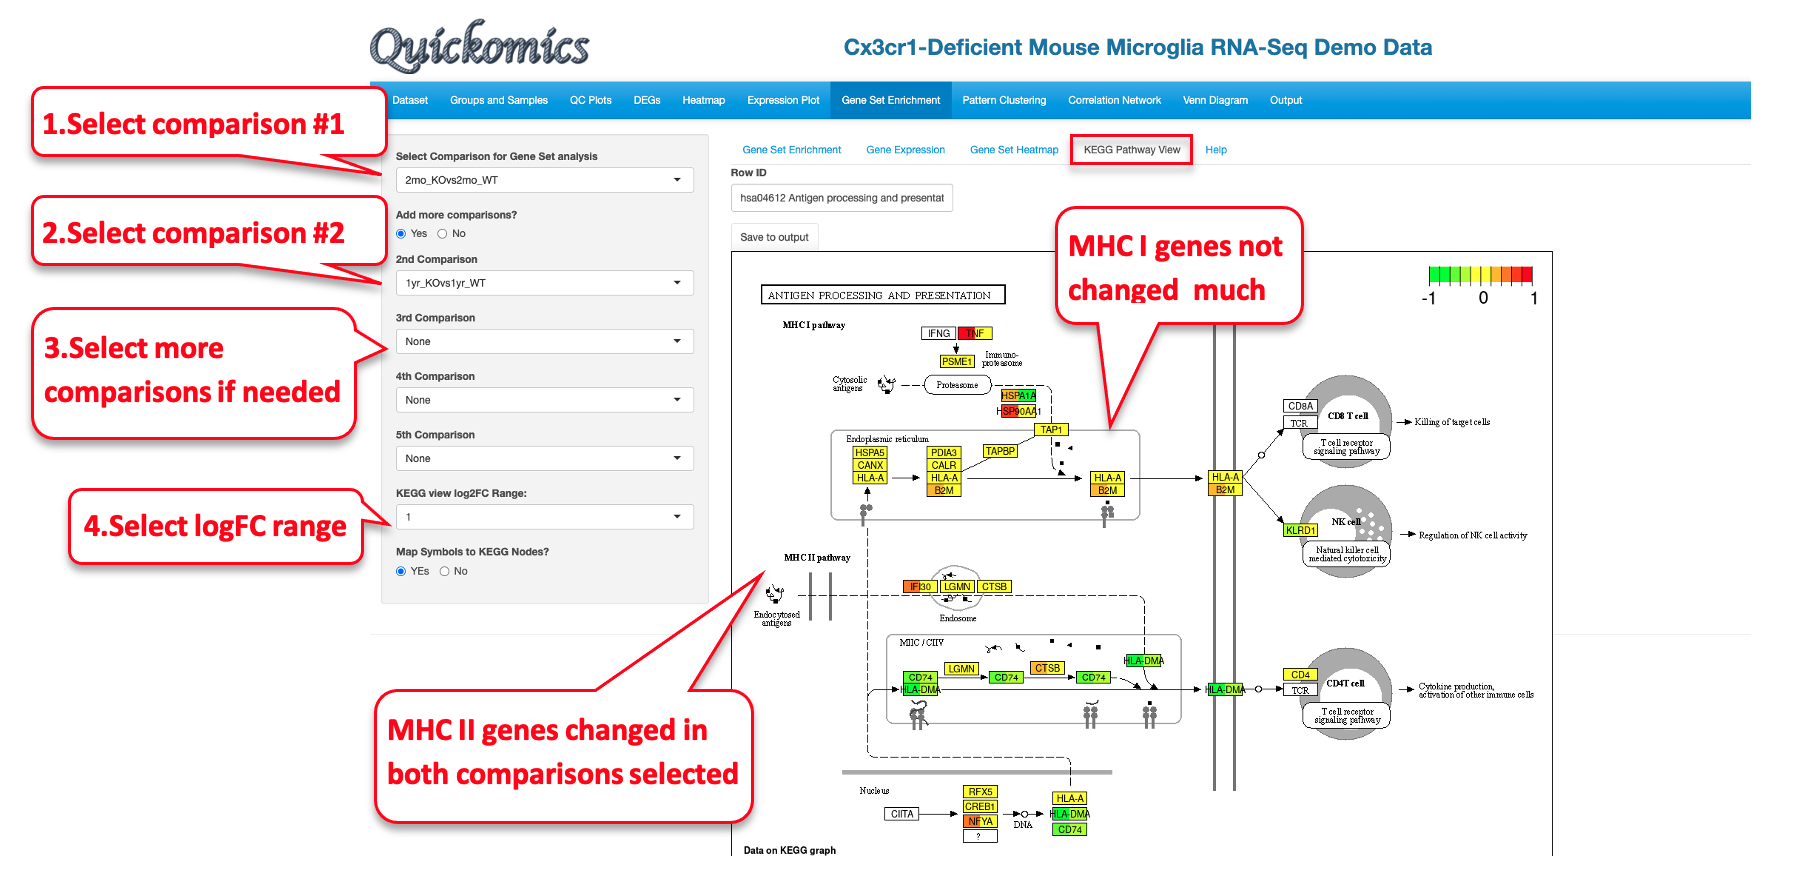
8.4 KEGG Pathway View
This functionality is available only to KEGG pathway terms. Users have the option to view the Fold Change levels of different genes in the KEGG pathway selected for up to 5 comparisons. In this example we demo the KEGG pathway “hsa04612 Antigen processing and presentation” as identified as a down-regulated term in the 2mon_KOvs2mon_WT and 1yr_KOvs1yr_WT comparisons.
This figure identifies all the genes that are differentially expressed in this pathway. It is also clear that genes in the MHC I pathway do not change, but many genes in the MHC II pathway are down regulated in both the comparisons. The visualization is also useful to highlight whether or not a large proportion of genes in a pathway are altered by the perturbation.