Chapter 6 Heatmap Module
This module generates highly customized publication-quality heatmaps with the ComplexHeatmap package in R. Users can enter automated list of differentially expressed genes or enter a custom list of genes to highlight on the heatmap. This module differs from other modules in that each time Users change the attributes; they need to click on the “Plot/Refresh” button to generate the plot. This is to avoid changing the output before all the attribute are added.
6.1 Static Heatmap Layout 1
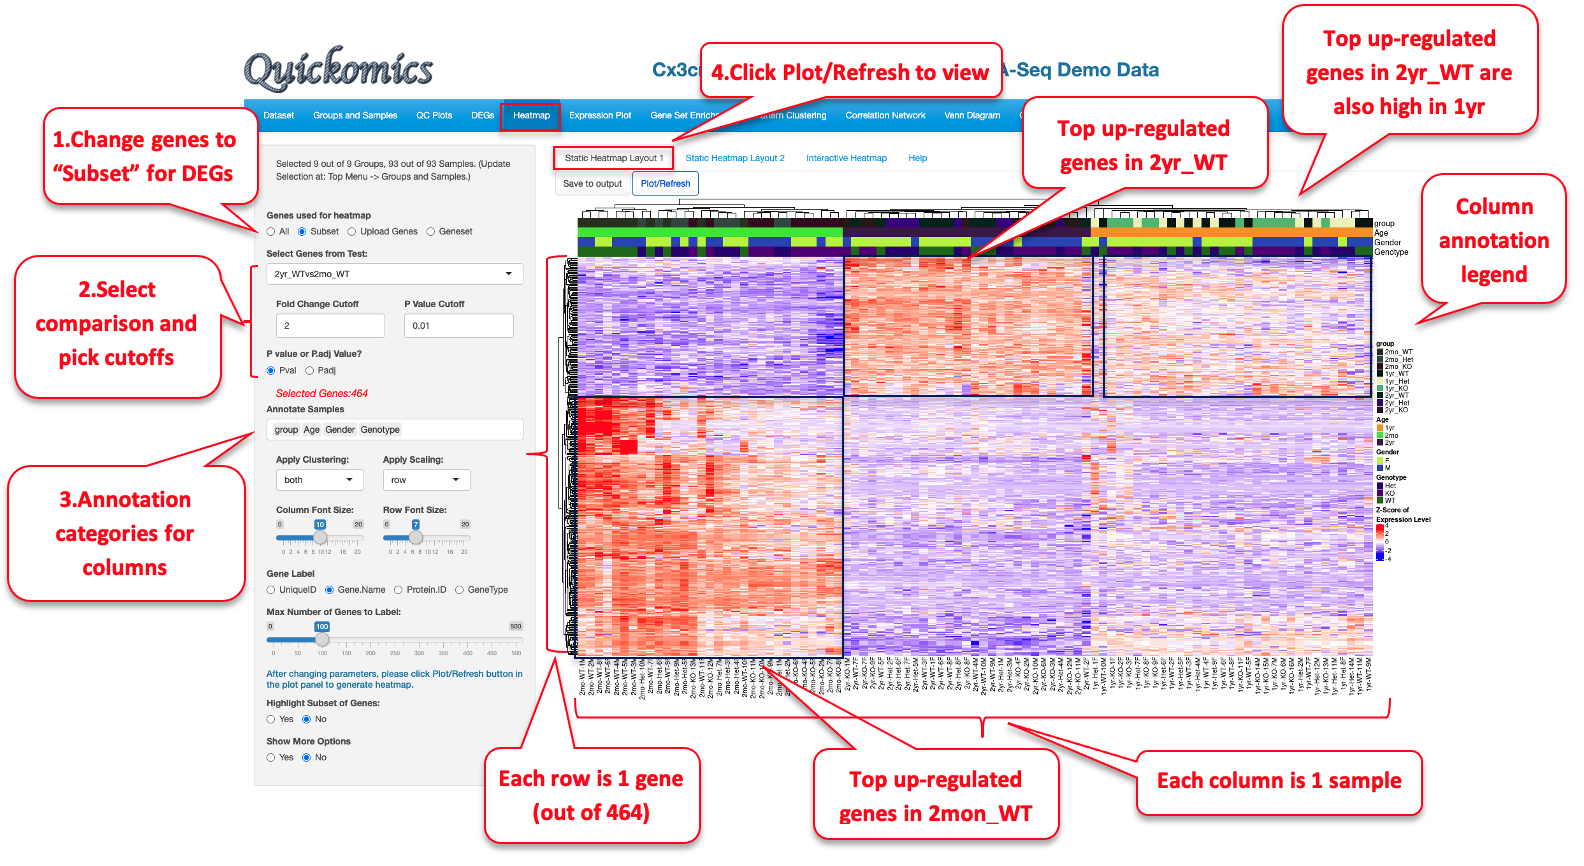
The “Static Heatmap Layout 1” uses the ComplexHeatmap package (Gu et al., 2016) for generating the plot. For demo purposes, we have selected options that highlight some capabilities to generate informative heatmap. For gene selection the default option is the selection of 100 random genes which can also be changed to variable genes. Here we selected DEGs/DEPs from the 2yr_WTvs2mon_WT comparison. Users also have the option to change the cutoff criteria for filtering the genes. They can also add/remove annotation categories for the samples on the columns.
In this heatmap, the top up-regulated genes in 2mon_WT samples are seen as high in 2mon samples but low in 2yr and 1yr samples, while the top up-regulated genes in the 2yr_WT samples are high in the 2yr and 1yr samples but low in the 2mon samples. This is another example that age has a major effect on gene expression in microglia, and the 2mon microglia have a different gene expression profile compared to 1yr and 2yr.
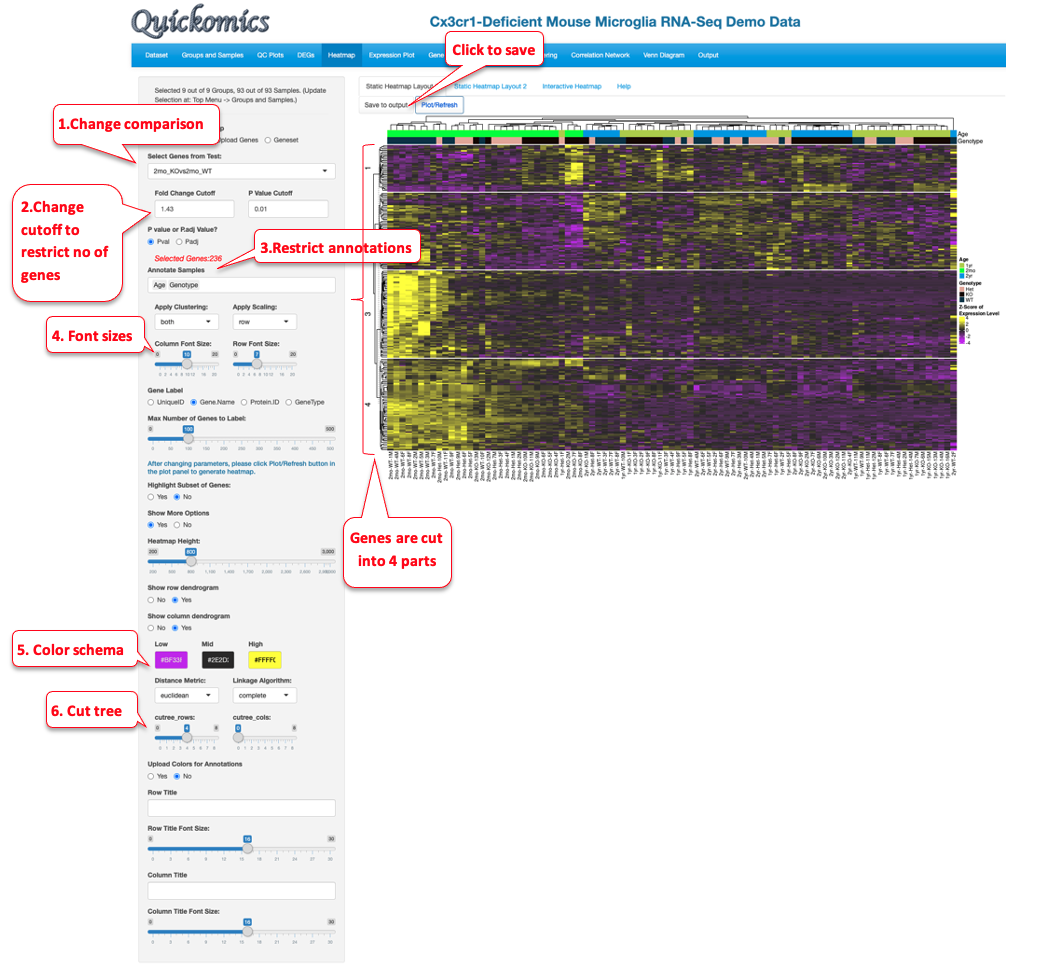
In this next example, we customize another Heatmap to highlight immune related genes that were called out in Gyoneva et al., 2019. This is done by uploading a csv file consisting of the gene names with pathway information and the color for display. An example of this file is on our GitHub (Quickomics/demo_files/fig5_all_genes.csv)


