Chapter 5 DEG Module
This section is designed to explore the differentially expressed genes (DEGs) and differentially expressed proteins (DEPs) in the dataset. The comparisons are defined by the User when they input the dataset. Please refer to our GitHub for more details on uploading datasets.
The “Volcano Plot (Static)” described in Section 5.2 and “Volcano Plot (Interactive)” described in Section 5.3 are ways to visualize each pair-wise comparison one by one. “DEGs/DEPs in Two Comparisons” described in Section 5.4 is a novel way to visualize the similarities and differences in two comparisons. Finally, “Data Table” described in Section 5.5 displays a searchable table containing all genes and their fold changes and P values in each comparison.
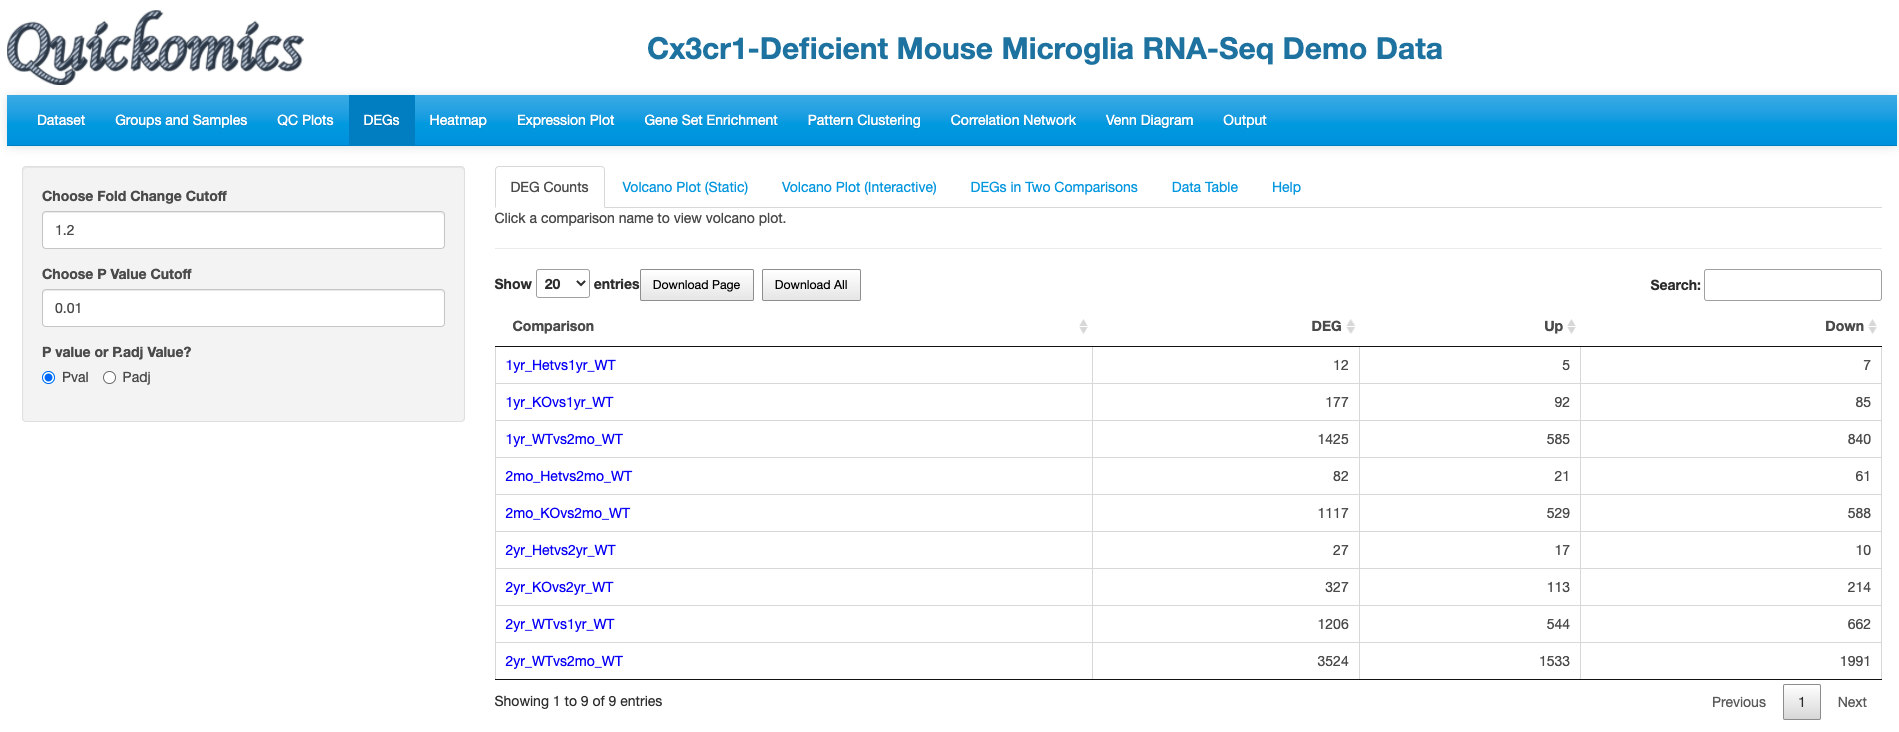
5.1 DEG Counts
DEG Counts tab provides a summary of the number of significanly changed genes for each comparison, separating Up- and Down-regulated genes.
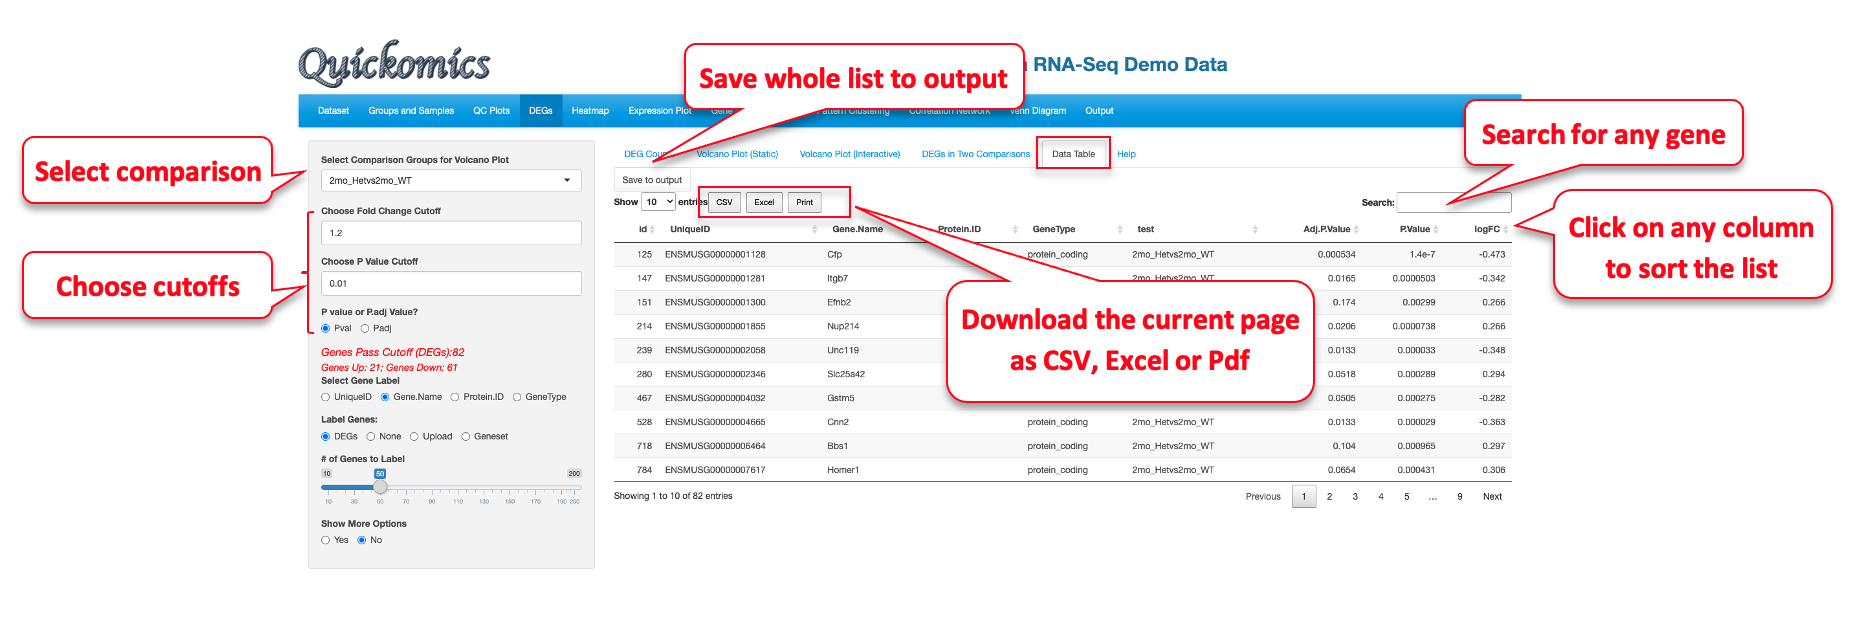
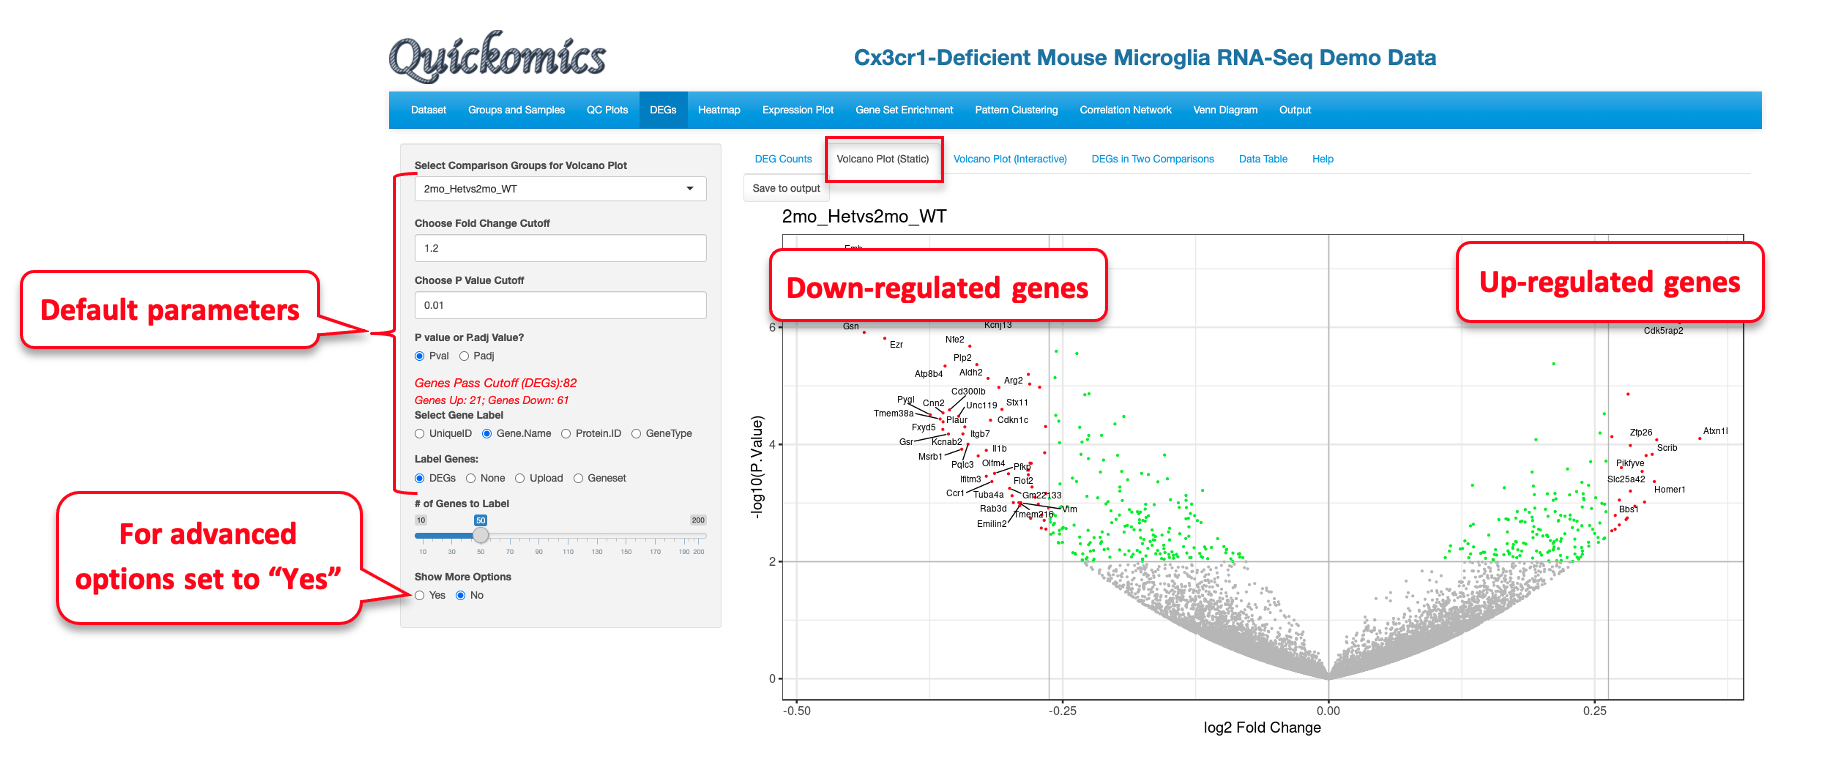
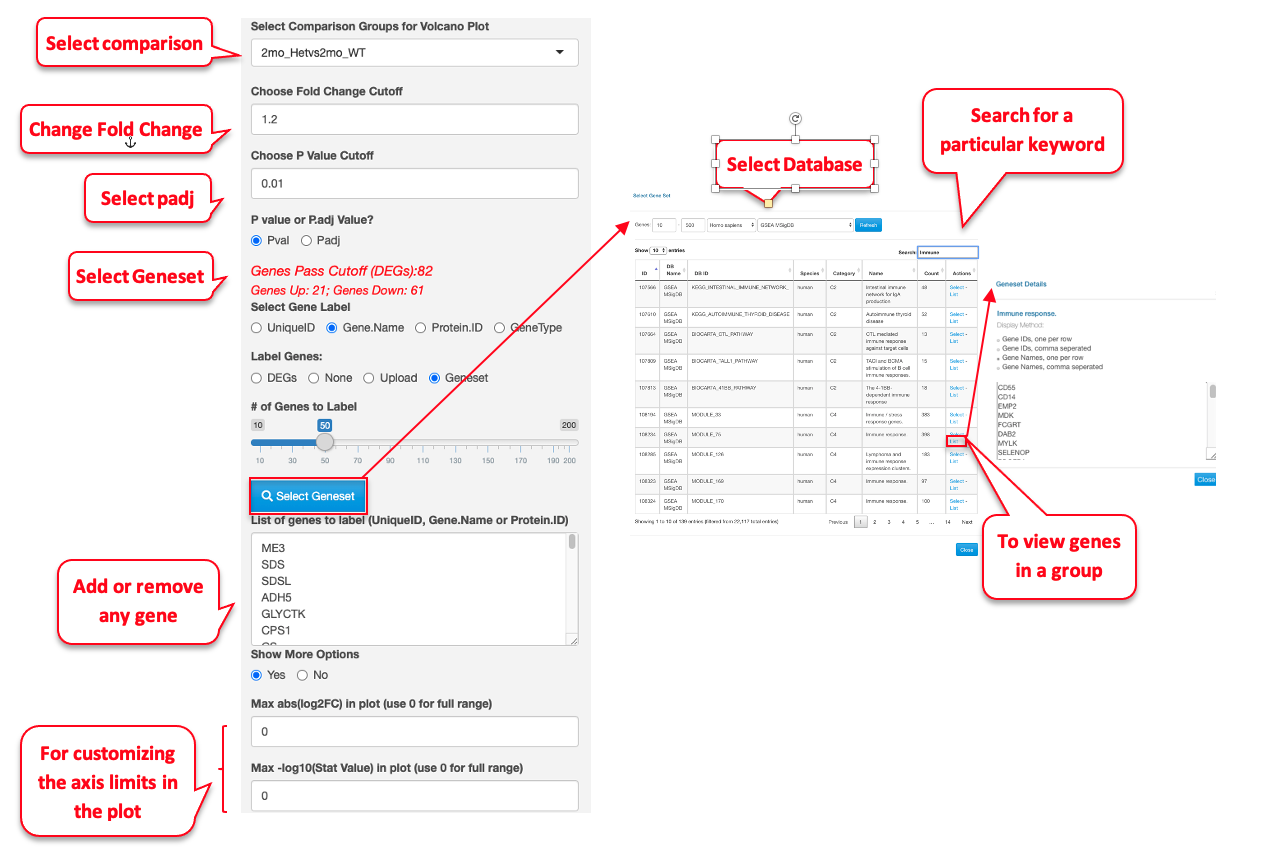
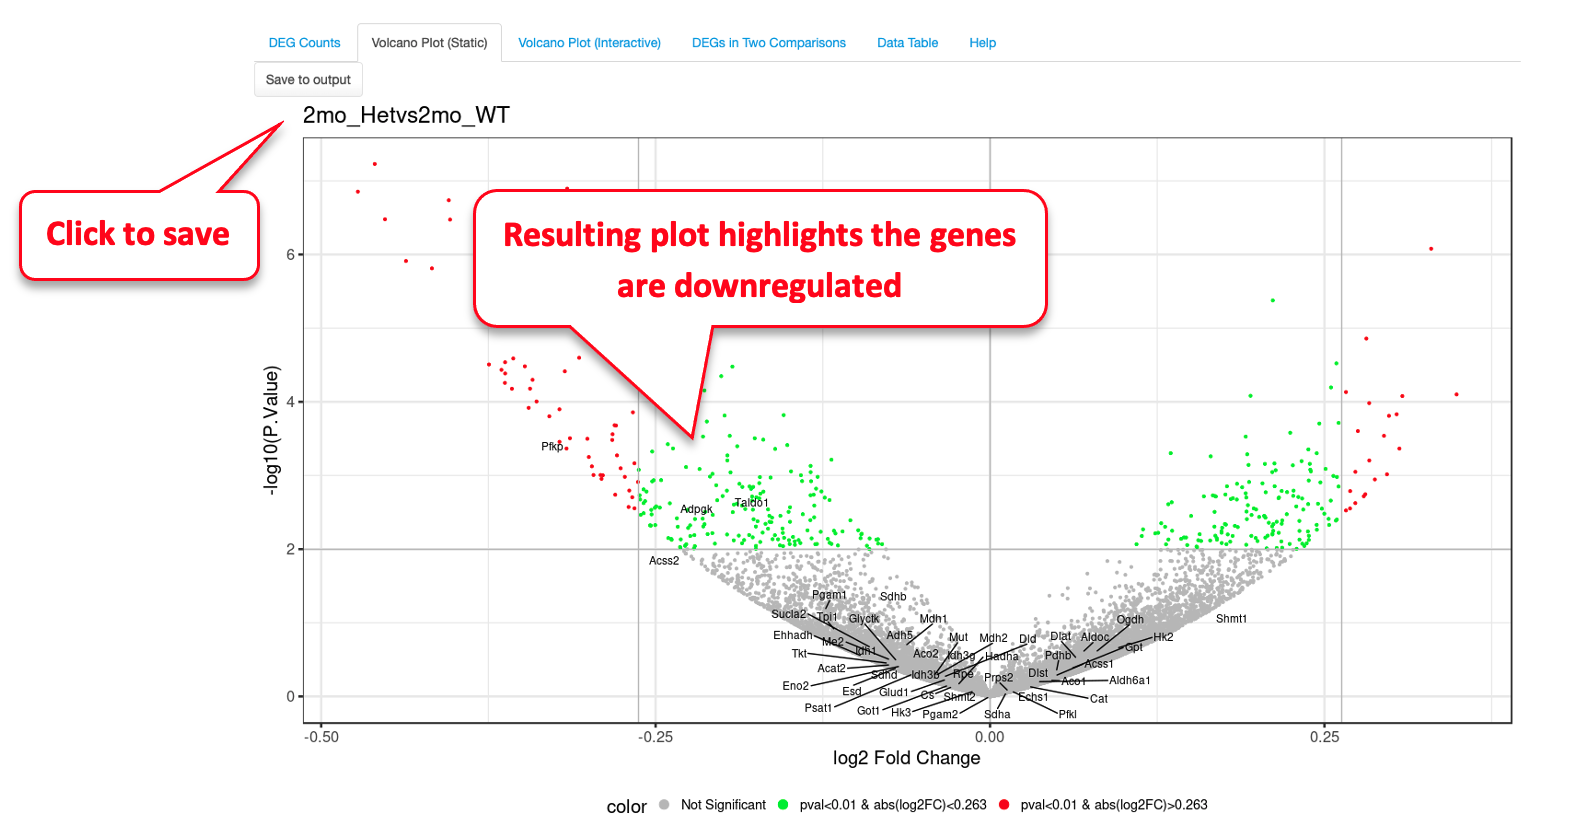
5.2 Volcano Plot (Static)
This plot reveals the differentially expressed genes provided in the input data file. By default, the Fold change Cutoff is set to 1.2 and the P value Cutoff is set to 0.01. Users have the option to change any of these parameters. For more advanced display options, they can set the “Show More Options” to “Yes” to customize other settings.
The red dots are indicative of all genes that pass the Fold Change and P value cutoff, while the green dots are indicative of genes that only pass the P value cutoff. Fifty random genes are labelled for both the up-regulated and down-regulated genes by default.
For demonstration purposes, we have changed the following attributes to highlight a few genes in this dataset. We have selected the 2mon_KOvs2mon_WT comparison, where Gyoneva et al., 2019 report immune response genes as the top differentially expressed category. To highlight these genes, in the example below, we select an “Immune Response” dataset from the Molecular Signatures Database (MSigDB) to highlight the genes by adding labels to the volcano plot. As MSigDB contains only human gene lists and the demo dataset is from mouse, Quickomics does a quick conversion of the names of Human genes to Mouse genes by changing the letters after the first one to lowercase. Additionally, in this example we removed some of the genes from the list to reduce size. This visualization was not available in the original publication, but clearly supports the finding that the KO genotypes altered the expression of immune-related genes.
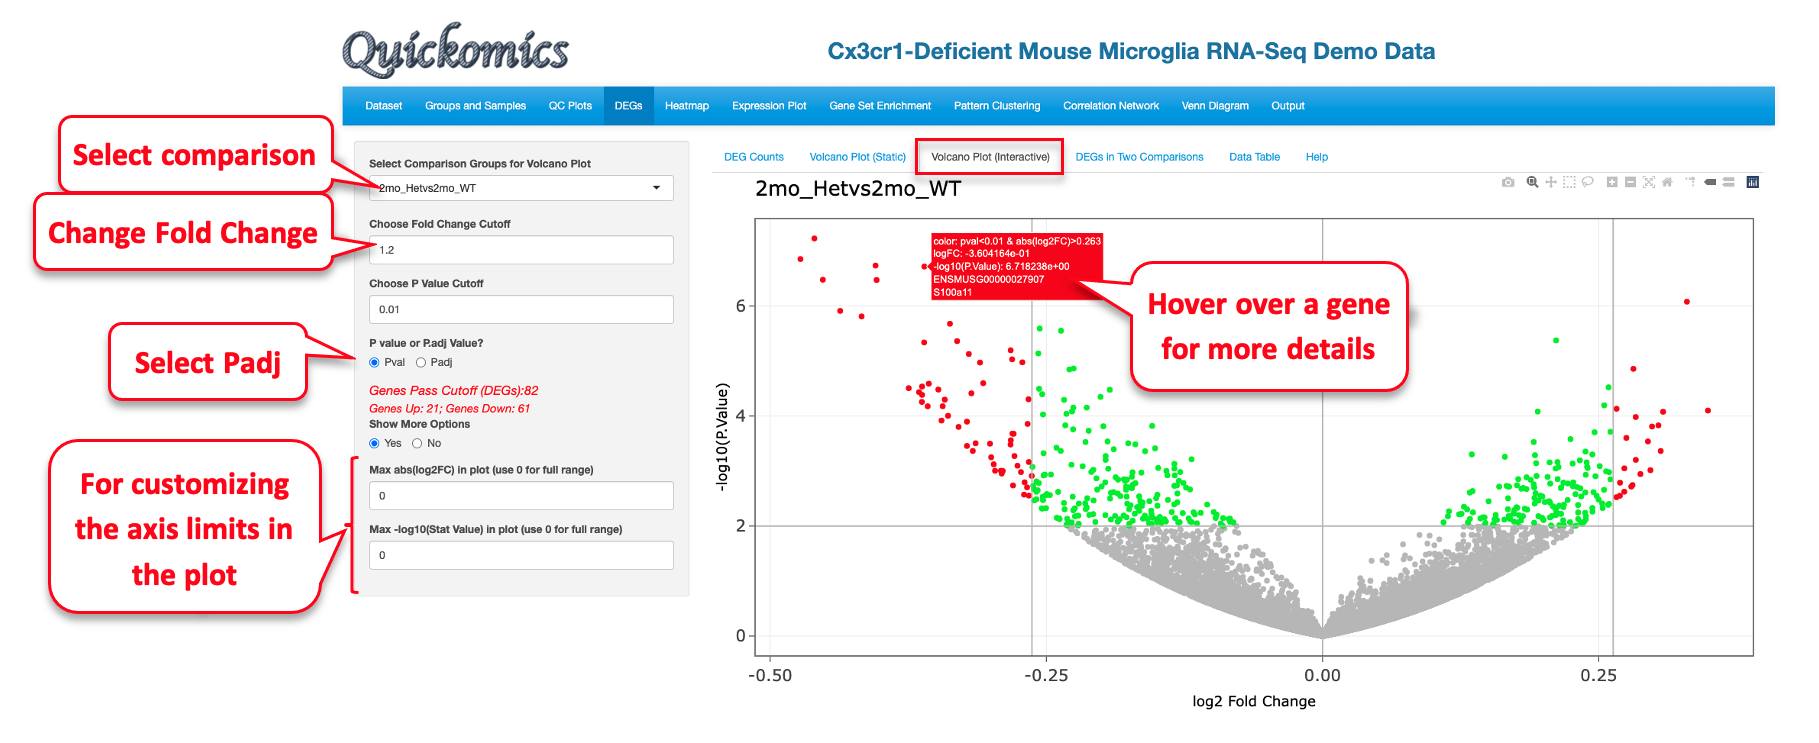
5.3 Volcano Plot (Interactive)
This next sub-tab is a very similar visualization as the previous one (5.2 Volcano Plot (Static)) with an additional capability where users can hover over a particular dot/gene on the plot to see more details. This plot has a few attributes that can be changed, and in the example below we have used the same cutoffs and values as in section 5.2.
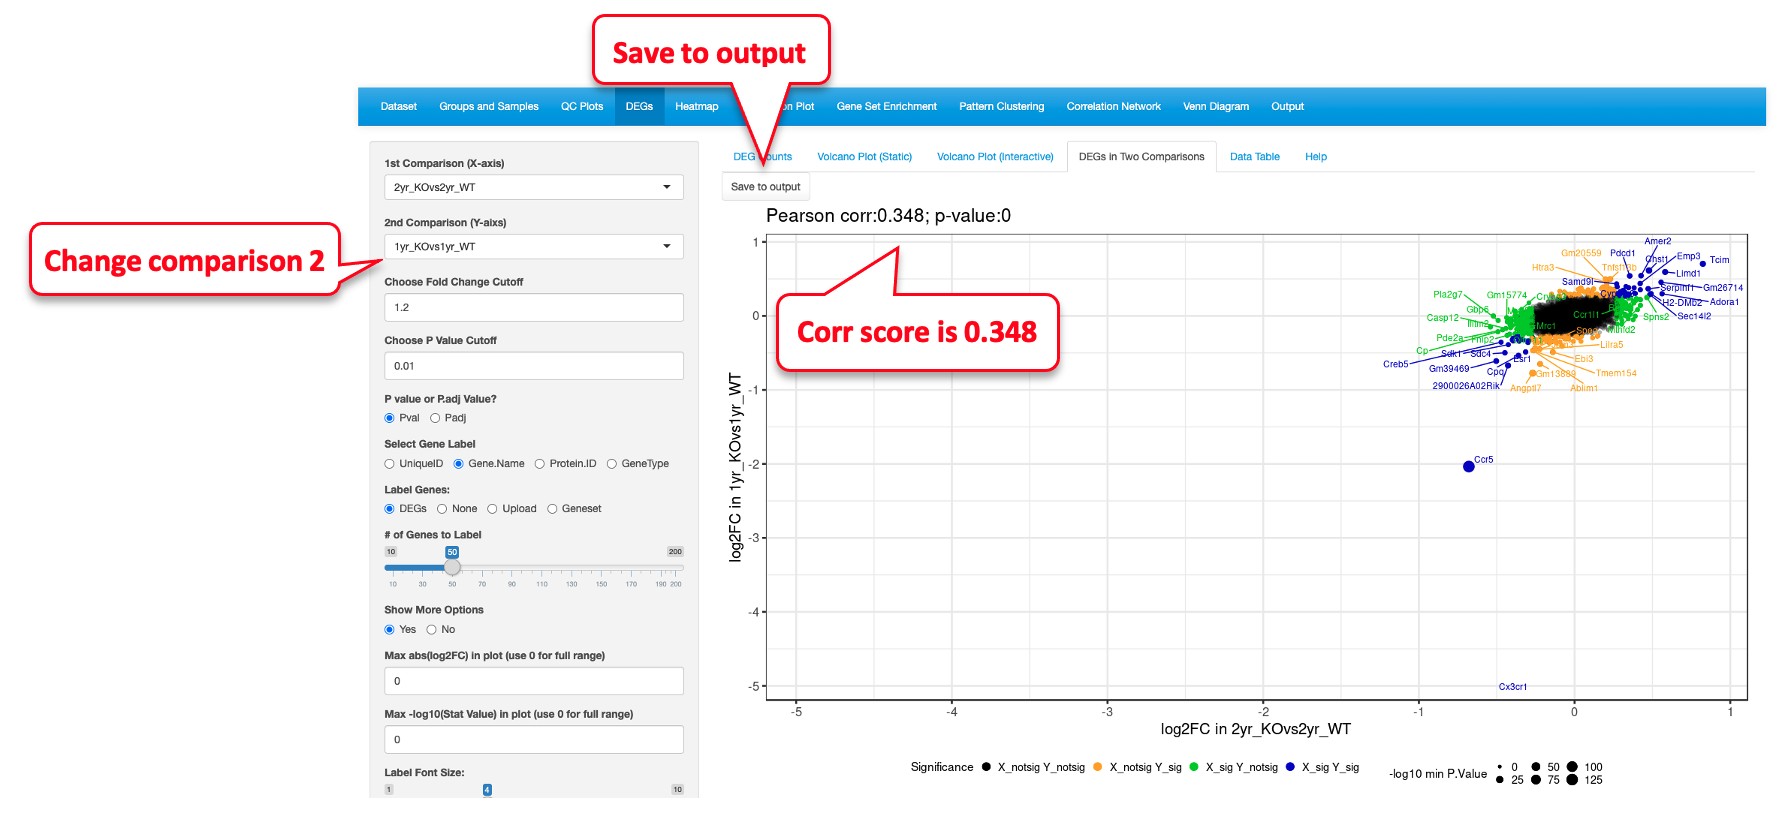
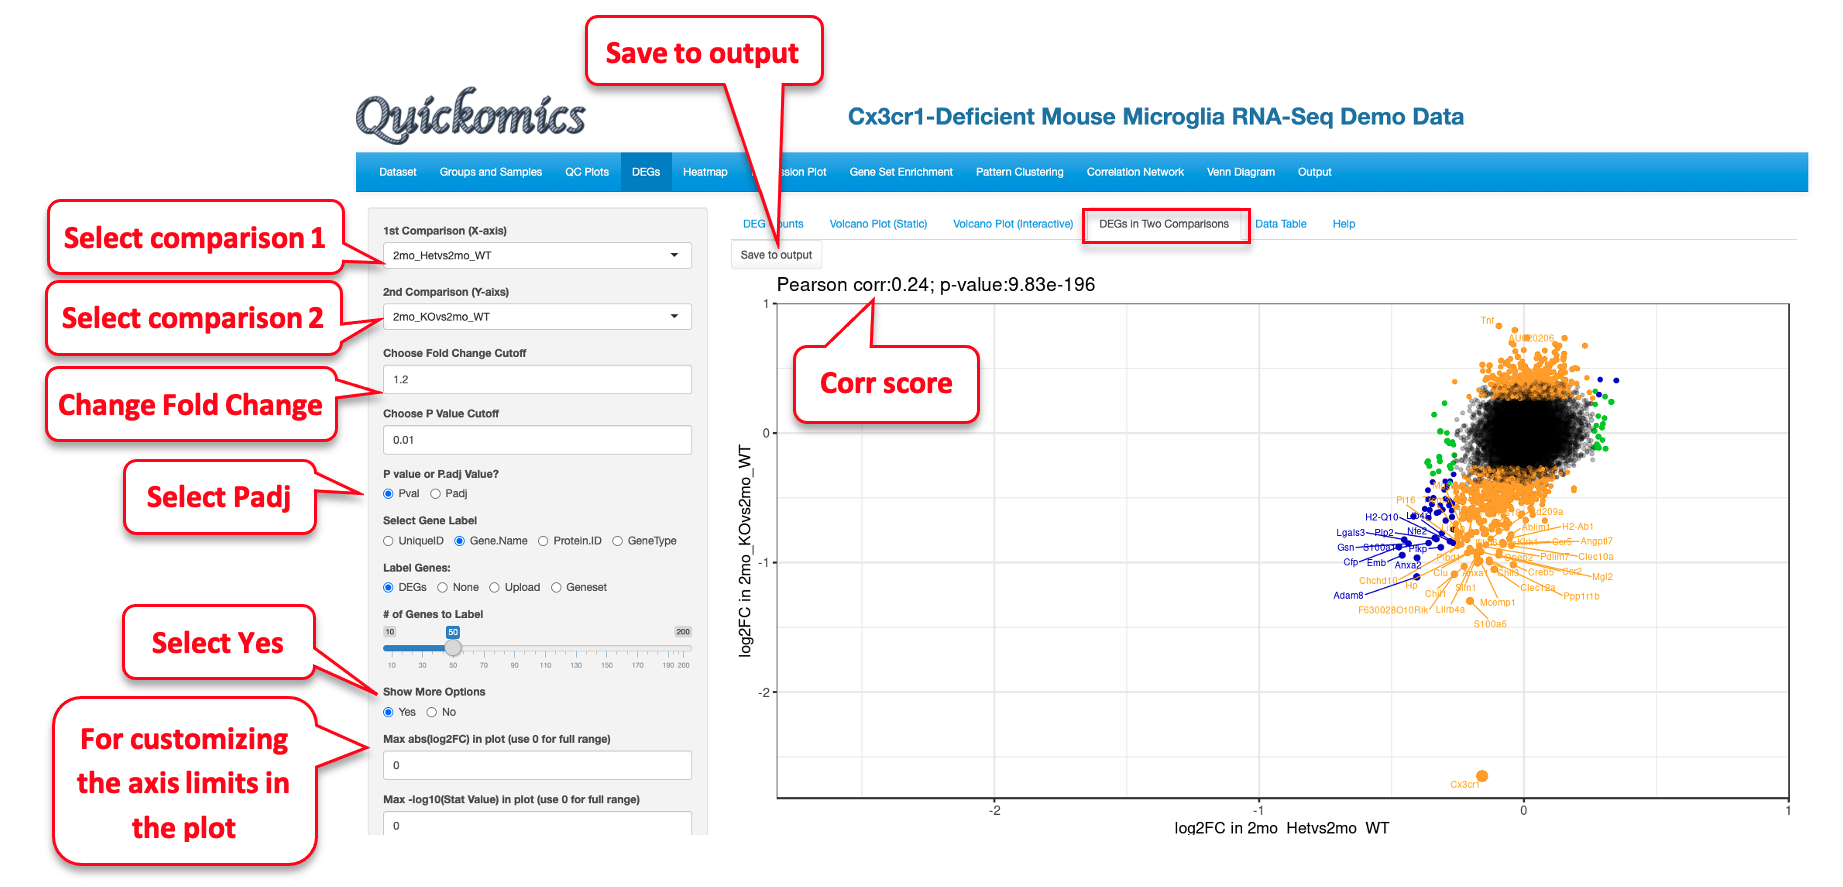
5.4 DEGs and DEPs in Two Comparisons
This next tab helps with identifying DEGs/DEPs that follow a similar trend in two comparisons. Gyoneva et al., 2019, the source of this demo dataset, report that the genes differentially expressed in Cx3cr1 KO microglia in the 2mon KO are quite different from WT, while the differences from WT are smaller for the 1yr KO and 2yr KO, and the two older ages are similar to each other. We have plotted out the following comparisons that illustrate this conclusion.
2mo_KOvs2mo_WT vs 1yr_KOvs1yr_WT has a low correlation score. There are many genes that are colored yellow, meaning those genes were significant in 2mo_KOvs2mo_WT (Y axis) but not in 1yr_KOvs1yr_WT (X axis).
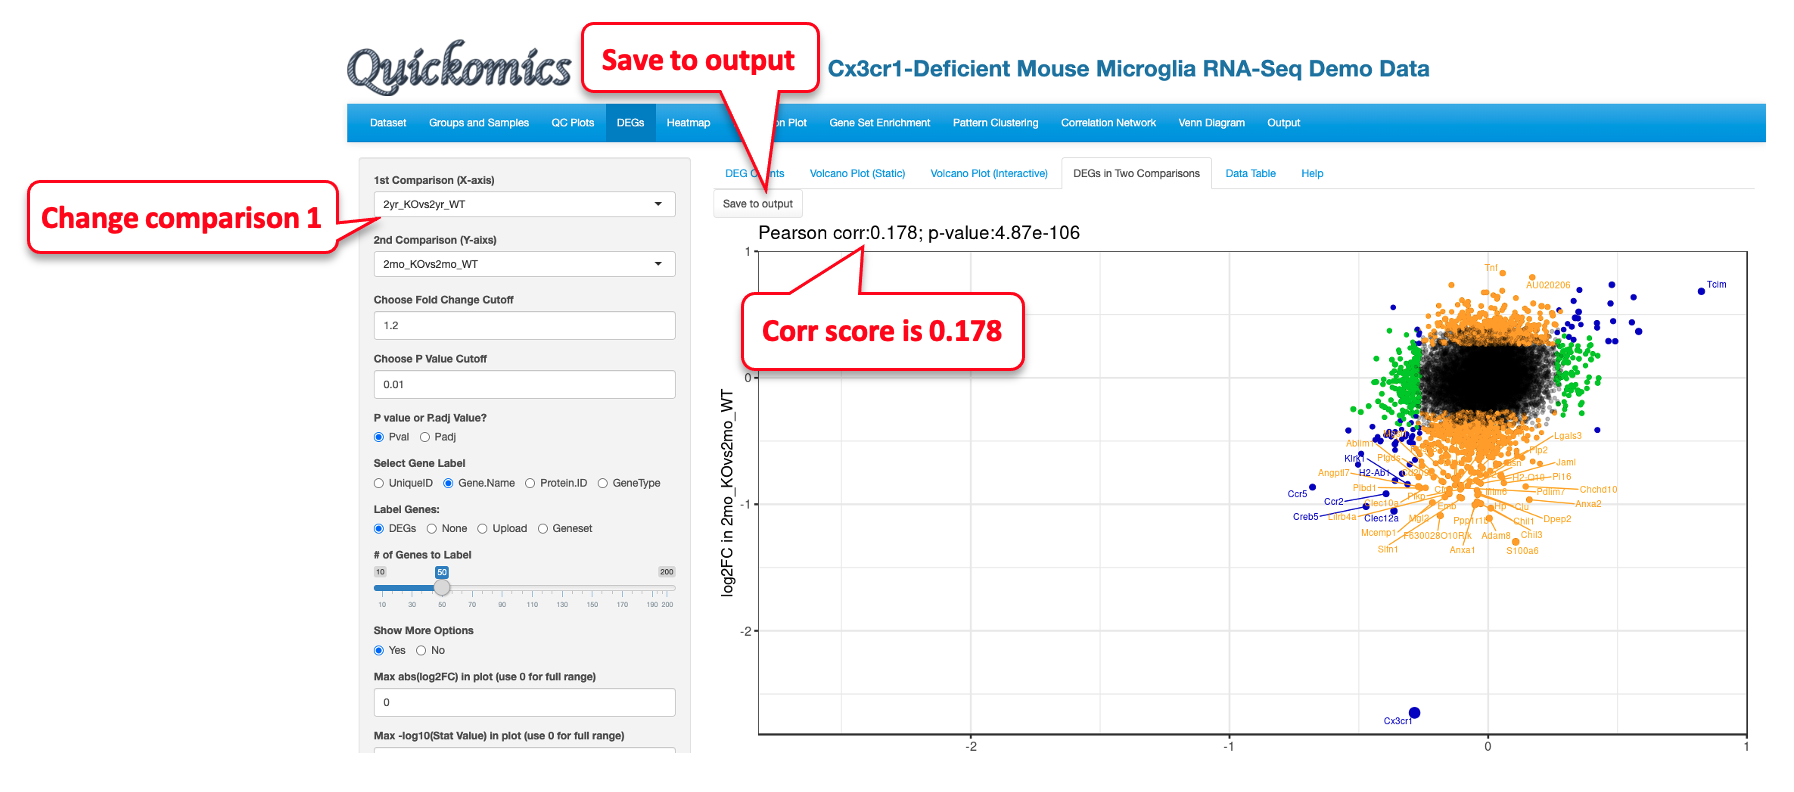
Similarly, we changed the X axis to 2yr_KOvs2yr_WT to compare to 2mo_KOvs2mo_WT, and it shows a very similar plot with a low correlation score of 0.178
Next, we changed the Y axis comparison to 1yr_KOvs1yr_WT comparing it to 2yr_KOvs2yr_WT on the X axis. This plot has a higher correlation score of 0.371 than the previous one, suggesting that these two comparisons are more similar. These comparisons represent additional insights supported by statistical analyses that were gained from the data and were not available in the original manuscript by Gyoneva et al.