Chapter 11 Venn Diagram Module
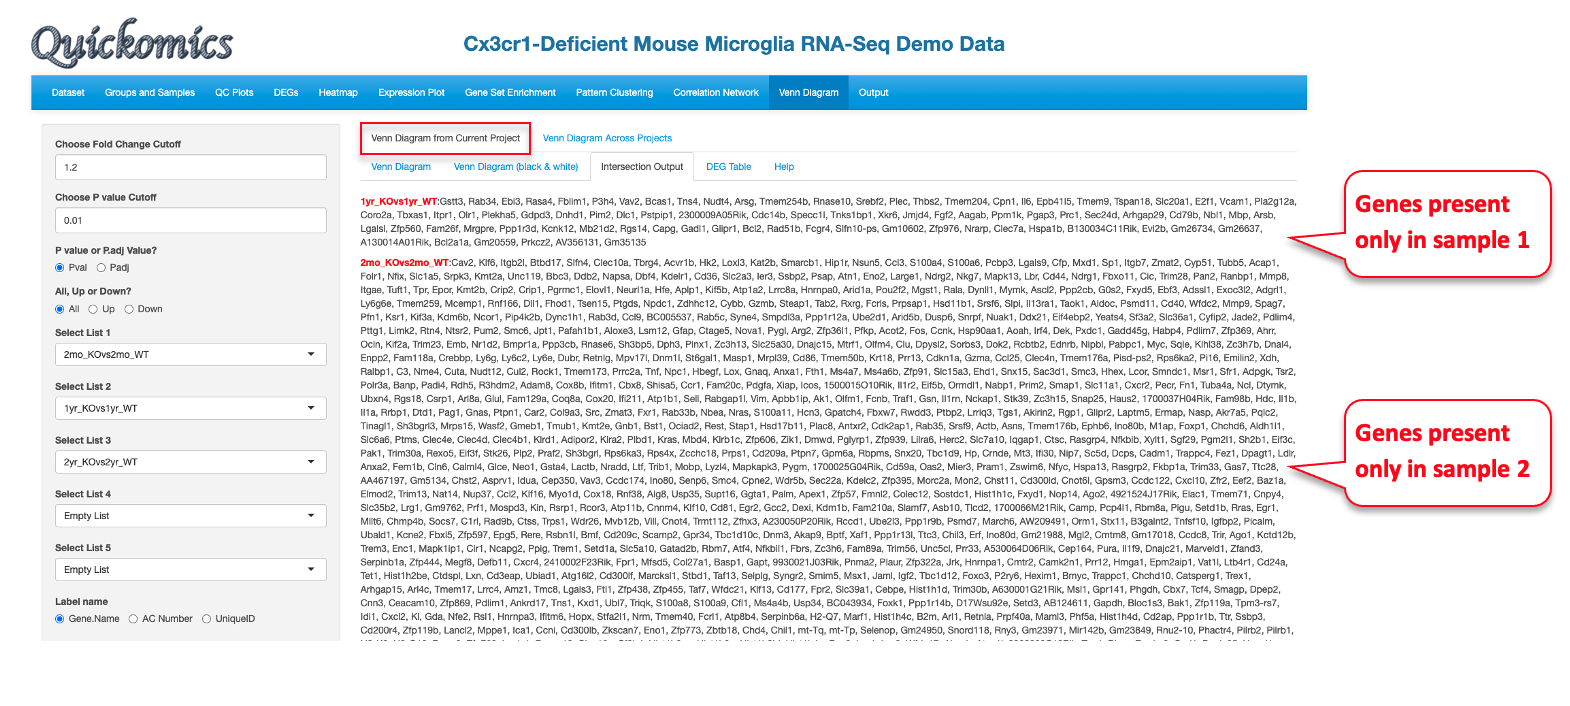
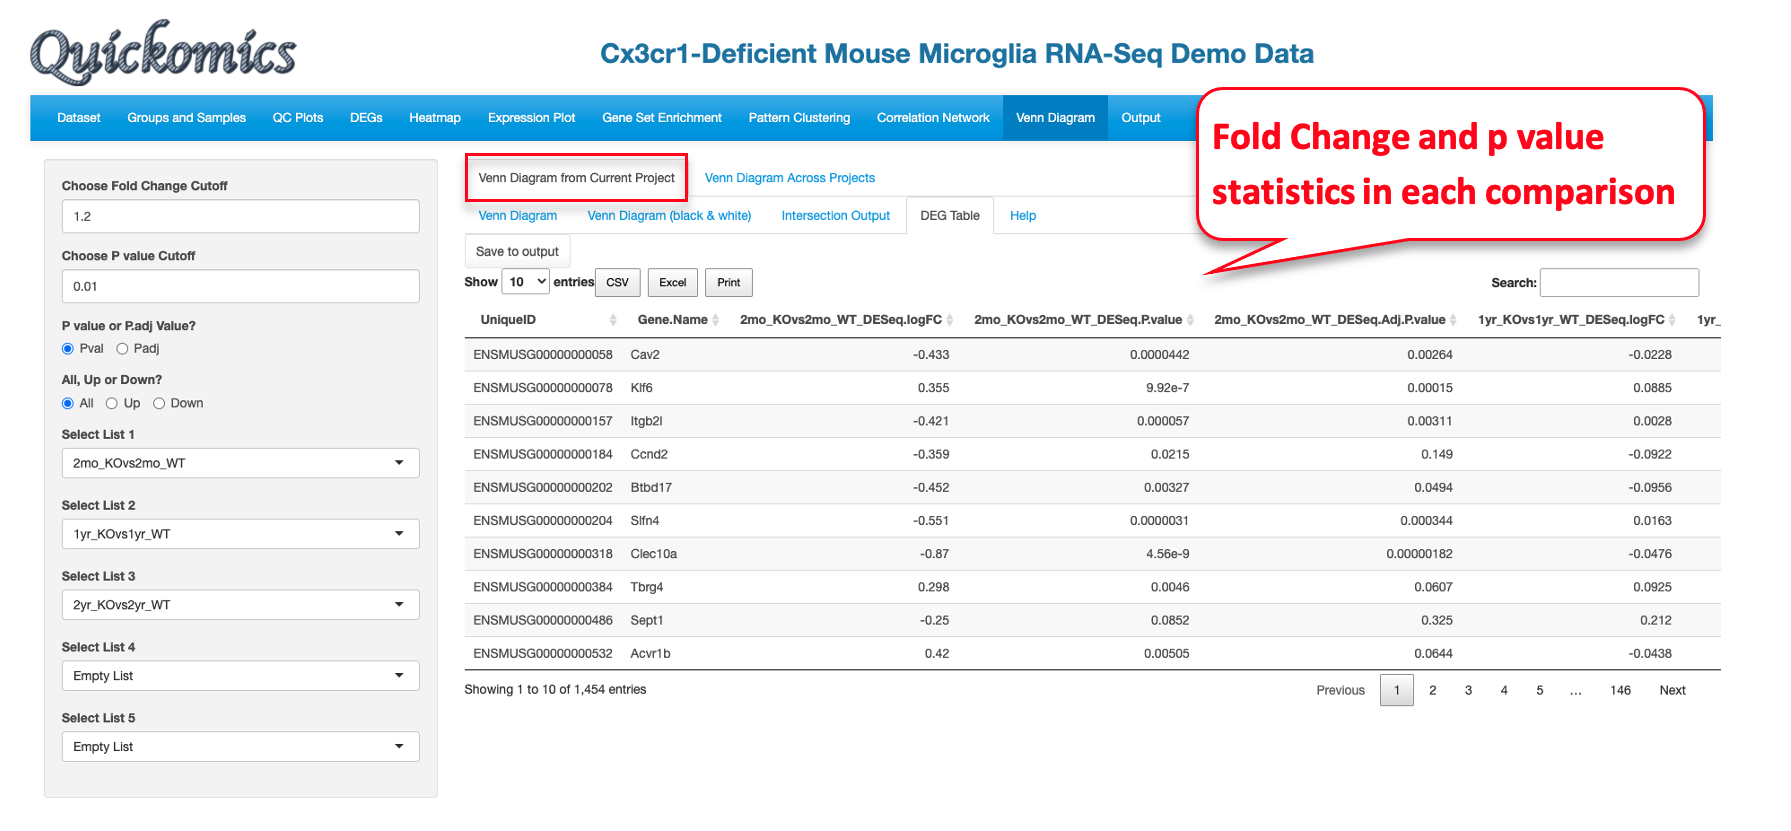
This module in Quickomics helps Users identify DEGs/DEPs that are common or unique to different comparisons within one project. Users have the option to either visualize these DEGs/DEPs as a highly customizable Venn Diagram or download a table with the gene names.
11.1 Venn Diagram
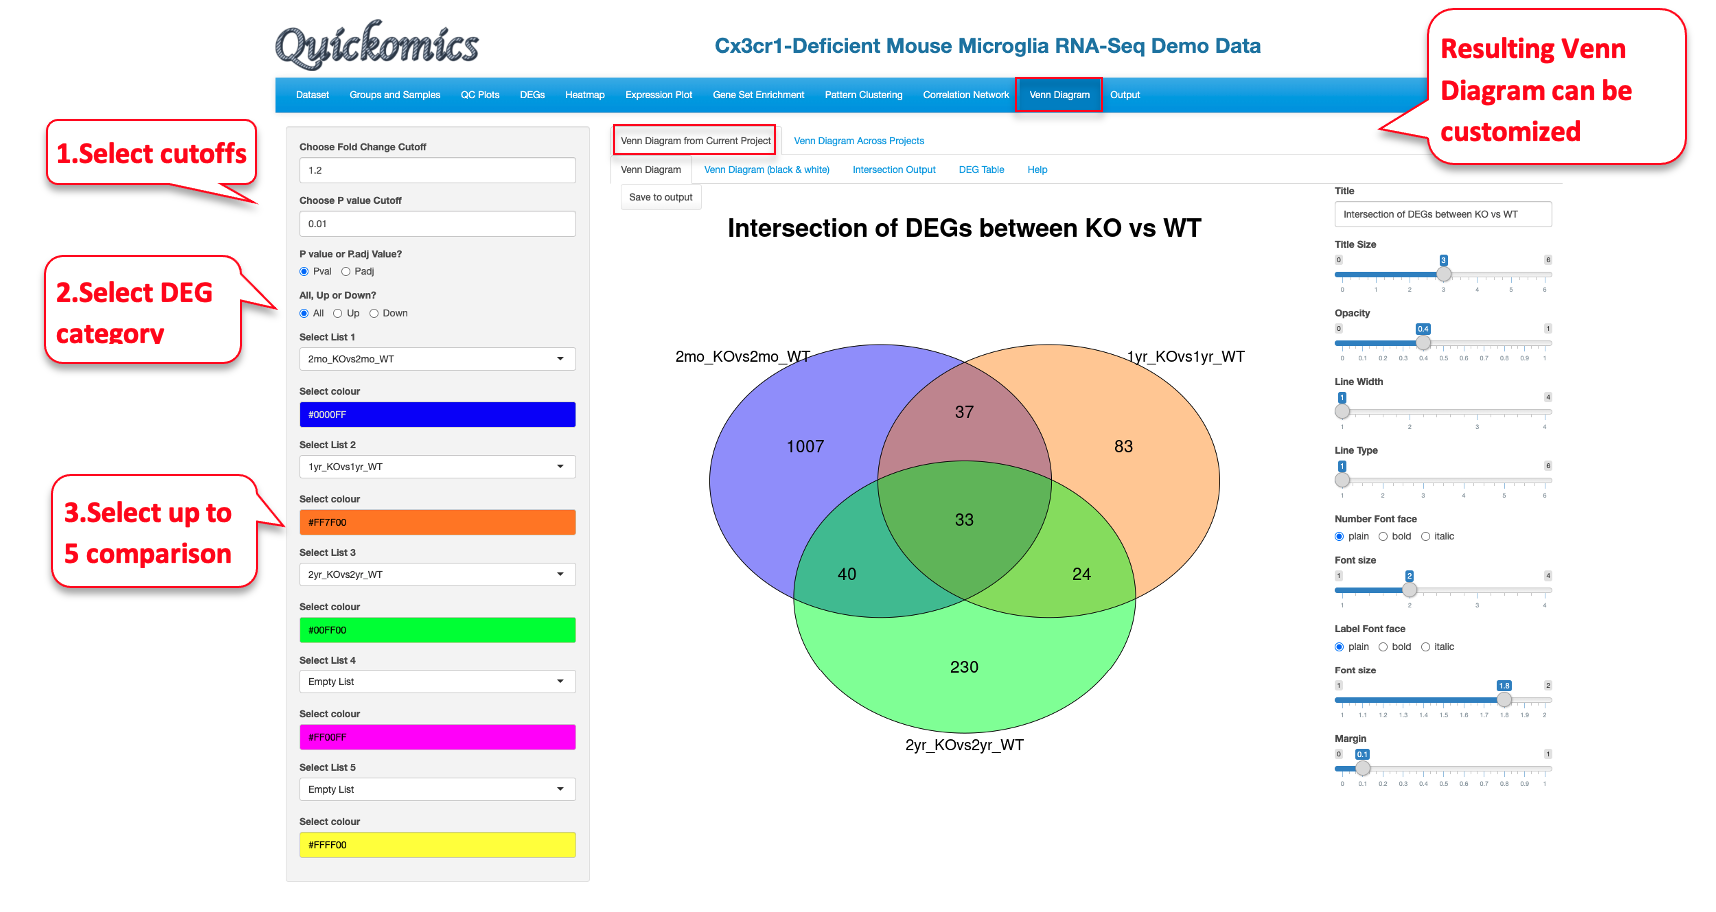
To view the DEGs/DEPs as a Venn Diagram, Users have the option to see the intersection of DEGs/DEPs for up to 5 different comparisons. Users can also use all DEGs/DEPs or restrict it to the ones that are Up or Down regulated.
In this example there were 33 DEGs that were identified in the three comparisons probed here, which represent the set of genes altered by the KO genotype at each of the time points.
11.2 Venn Diagram (black & white)
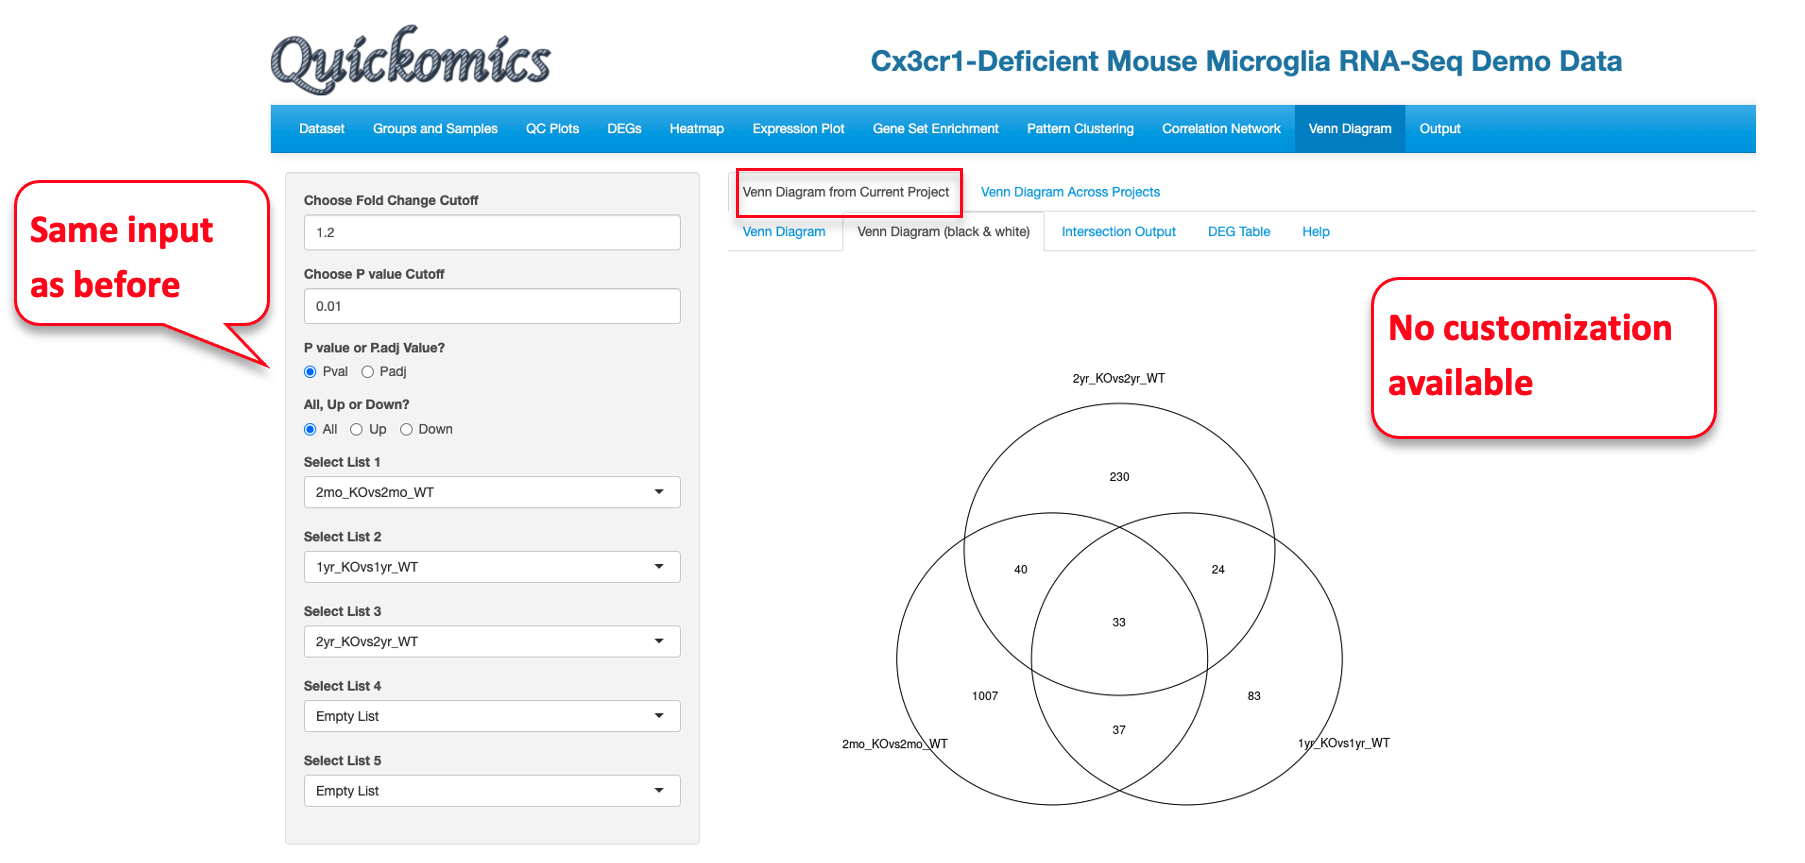
This tab has the same plot seen before in Section 11.1 but highly simplified and in black and white.


