Chapter 10 Correlation Network Module
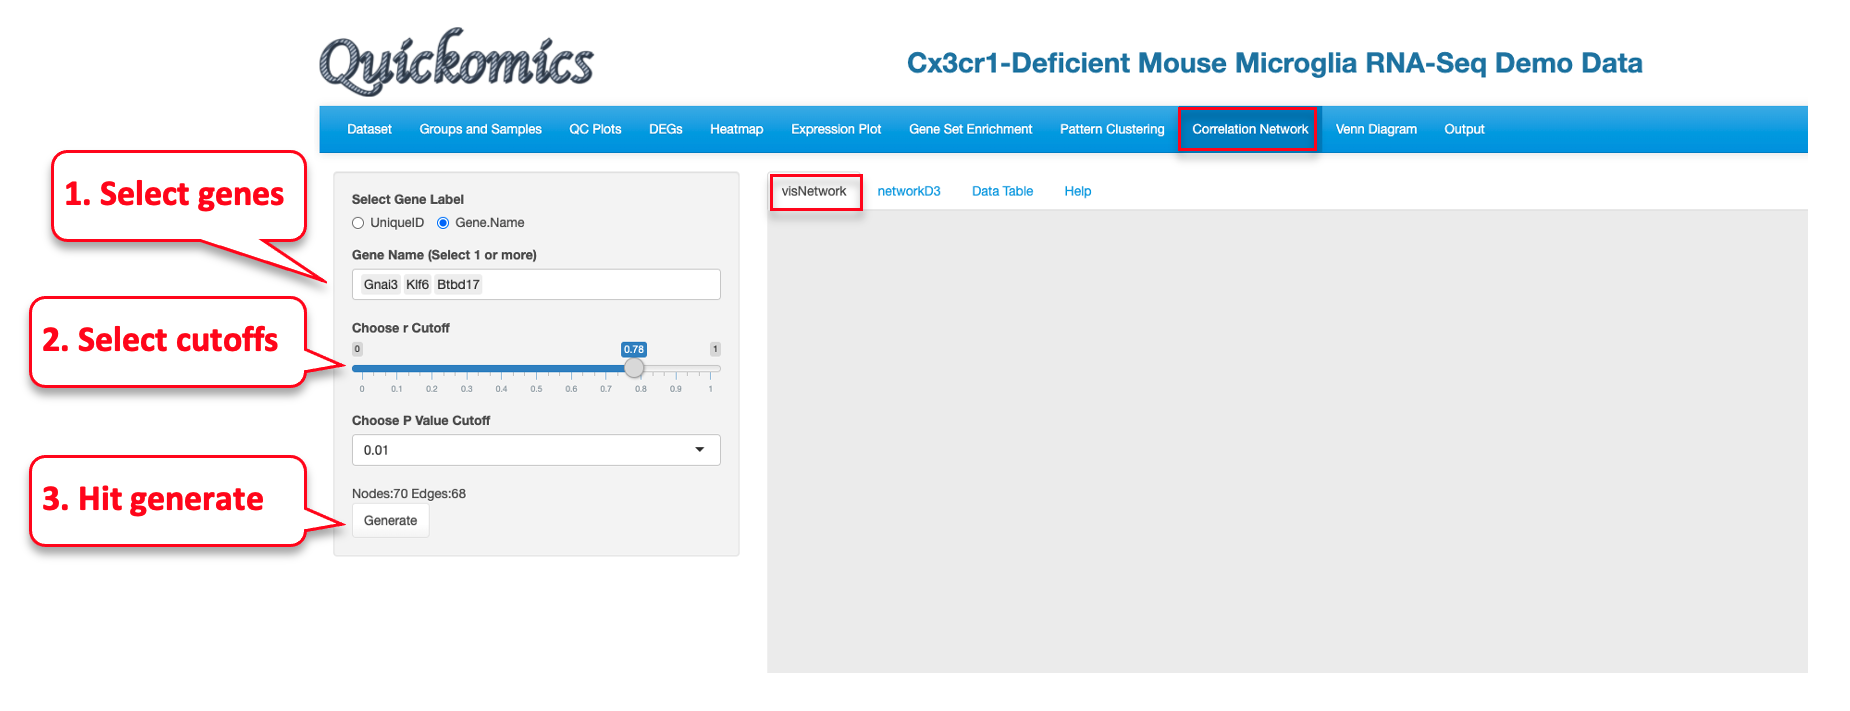
This module helps build co-expression networks based on gene-gene or protein-protein correlations. This is especially useful during co-immunoprecipitation or pulldown proteomics experiments to identify protein partners. Users have the ability to enter 1 or more genes/proteins to identify if their expression is correlated.
10.1 visNetwork
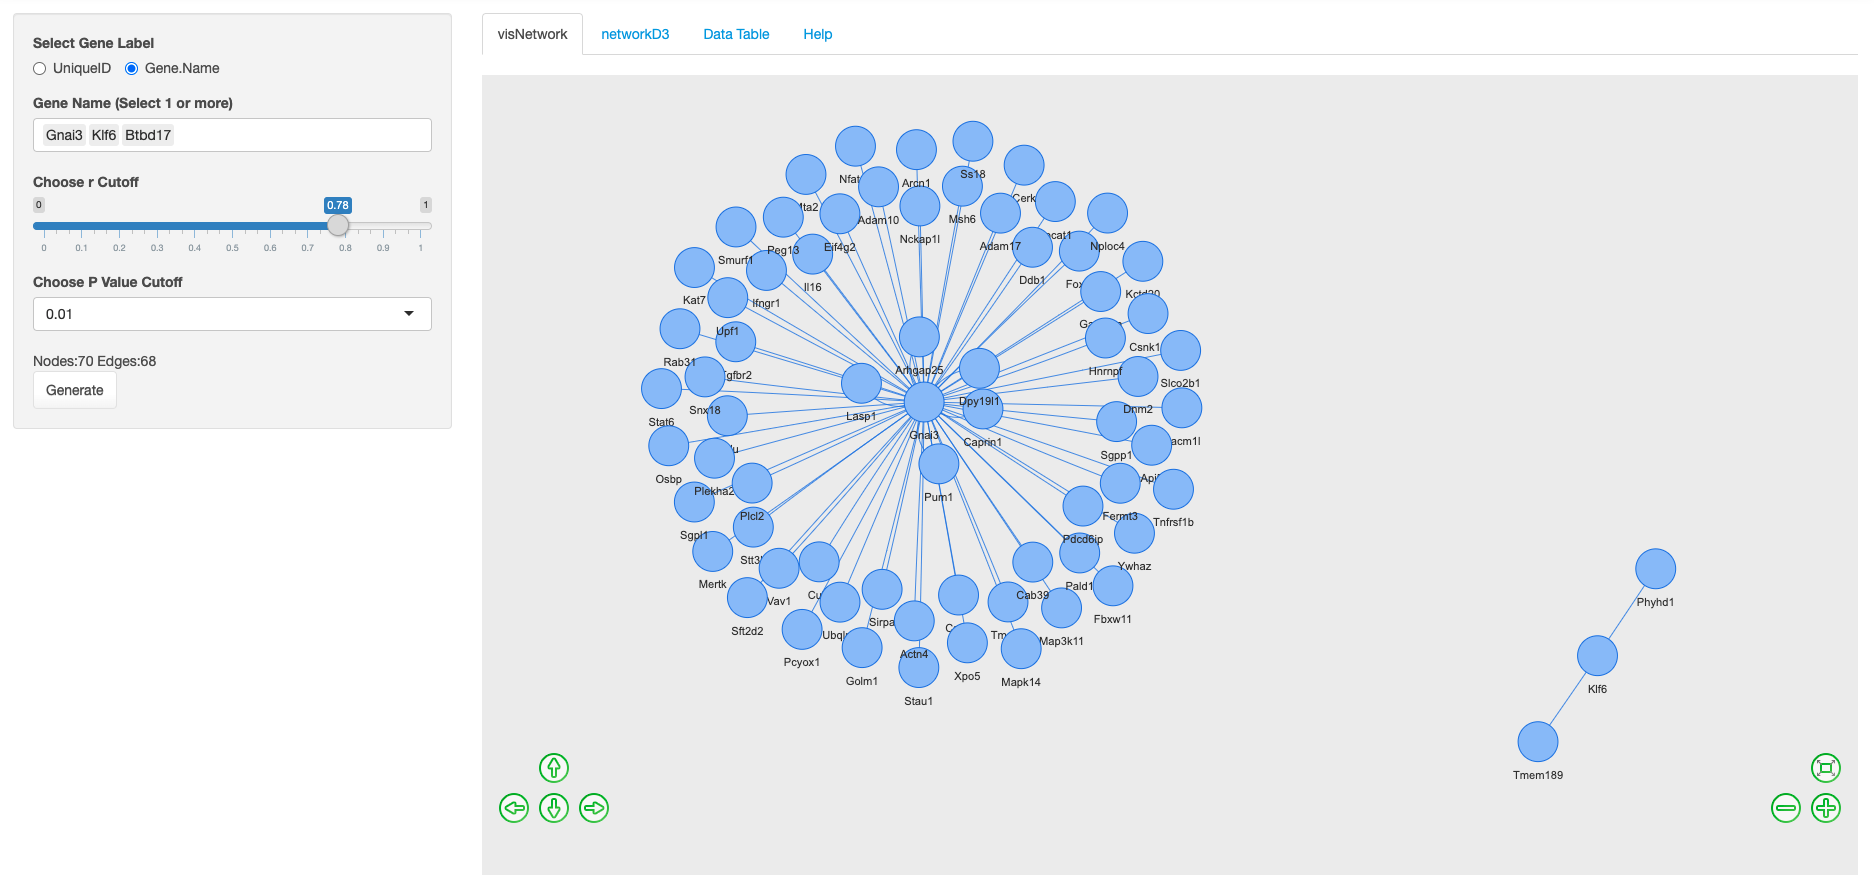
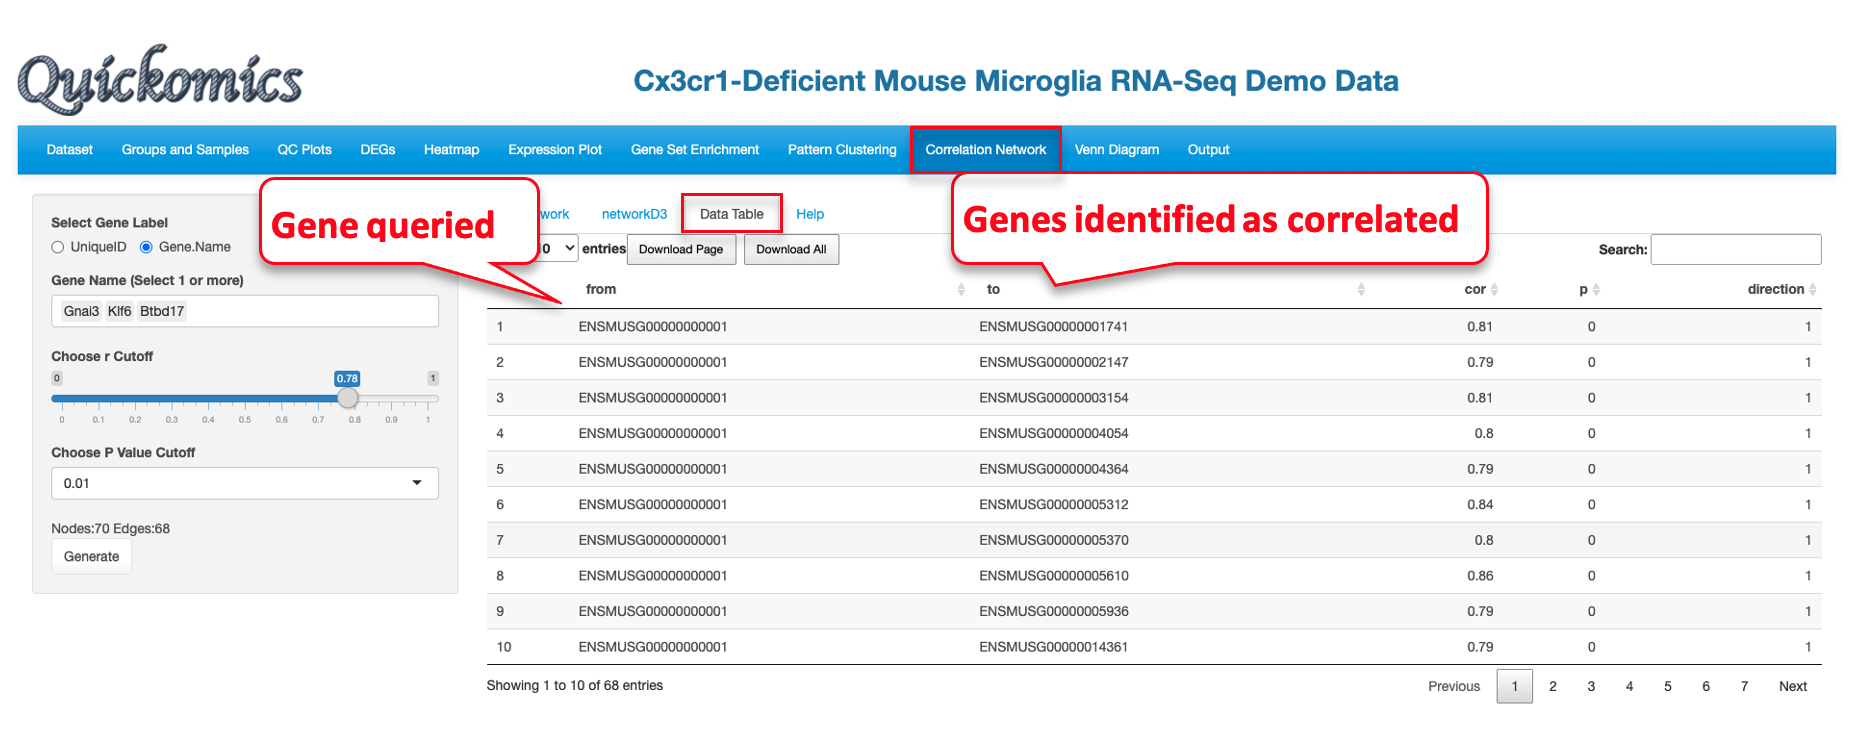
This uses the R package visNetwork to visualize the expression of correlated genes/proteins. Users have the ability to choose the R and P value cutoff for selecting the correlated genes/proteins. In this example below, we probe 3 genes and identify the expression of other genes that are correlated with them.
The following network plot was produced. Gnai3 is part of a large network with multiple genes correlated with it. On the other hand, Klf6 was correlated with 2 other genes, while Btbd17 was not correlated with any genes.