Chapter 7 Step-by-step guide of running the Crohn’s disease meta-analysis
To provide more guidance on how to carry out an analysis, in this section an end-to-end example is shown to demonstrate how to draw meaningful conclusions by data exploration.
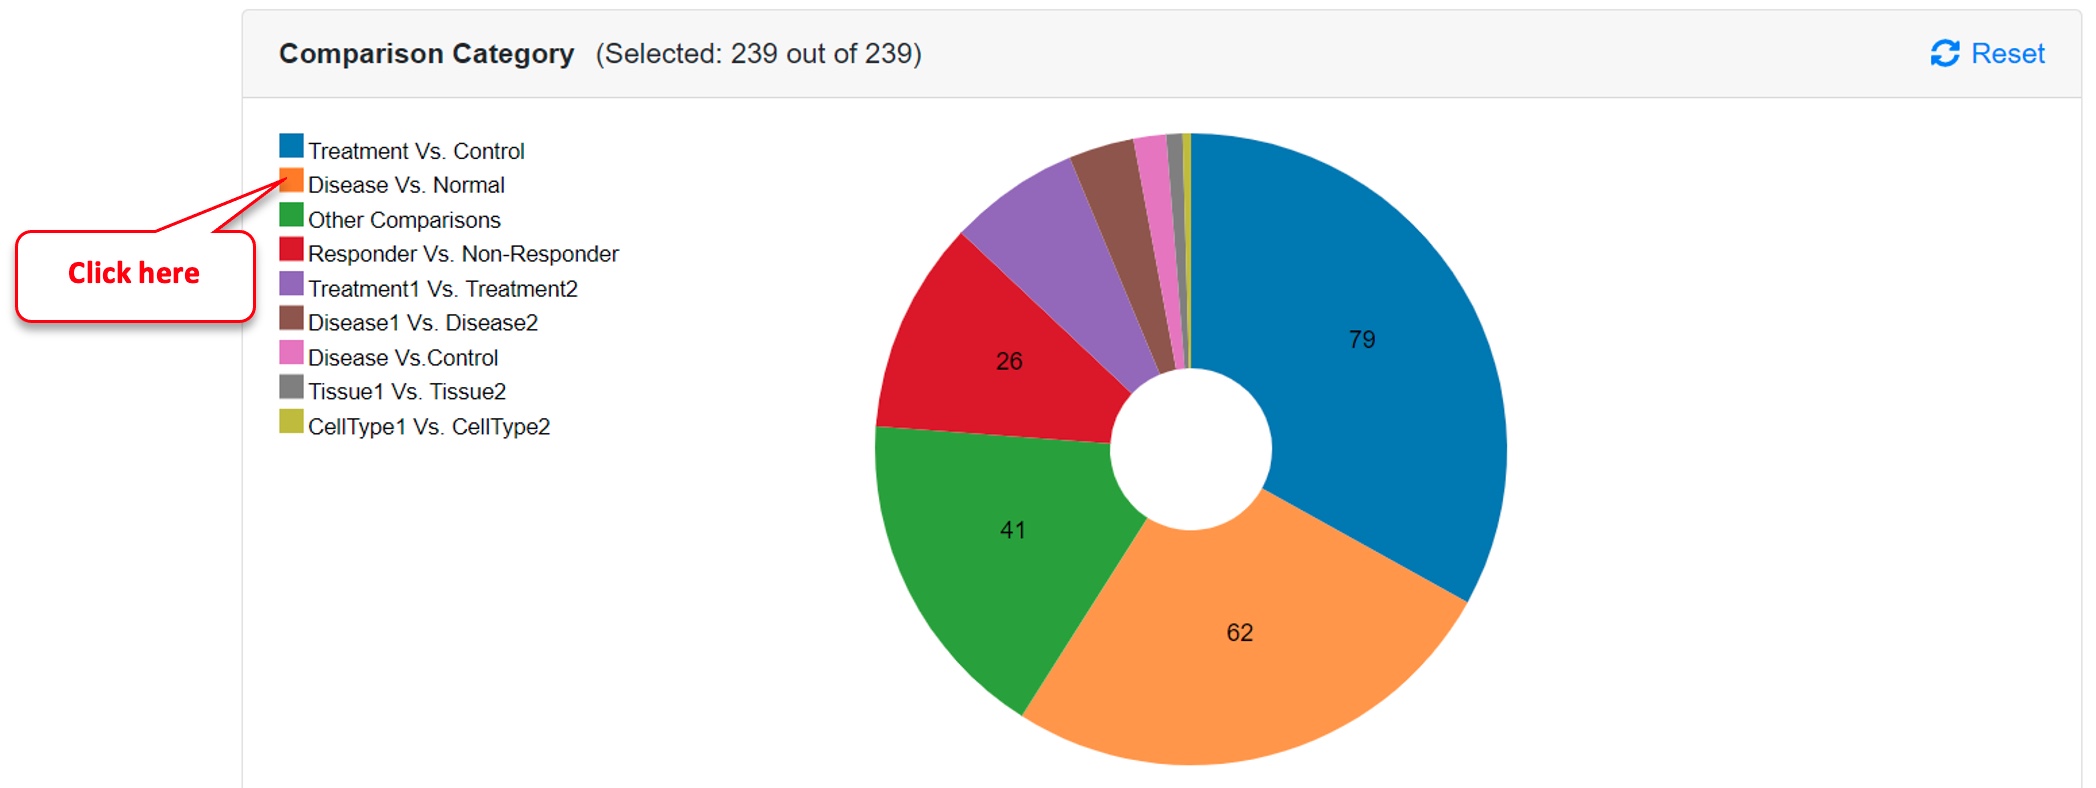
Step 1: Select Disease Vs. Normal from the Comparison Category
Click on the OmicsView logo on the top-left corner or select “Comparison Dashboard” under “Review” found in the left panel. Then click on “Disease Vs. Normal” under Comparison Category.
Step 2: Select Crohn’s Disease comparisons
Click on the “Crohn’s Disease” bar in the Disease State subpanel of the Comparison Dashboard
Step 3: Add the comparisons to a Comparison List
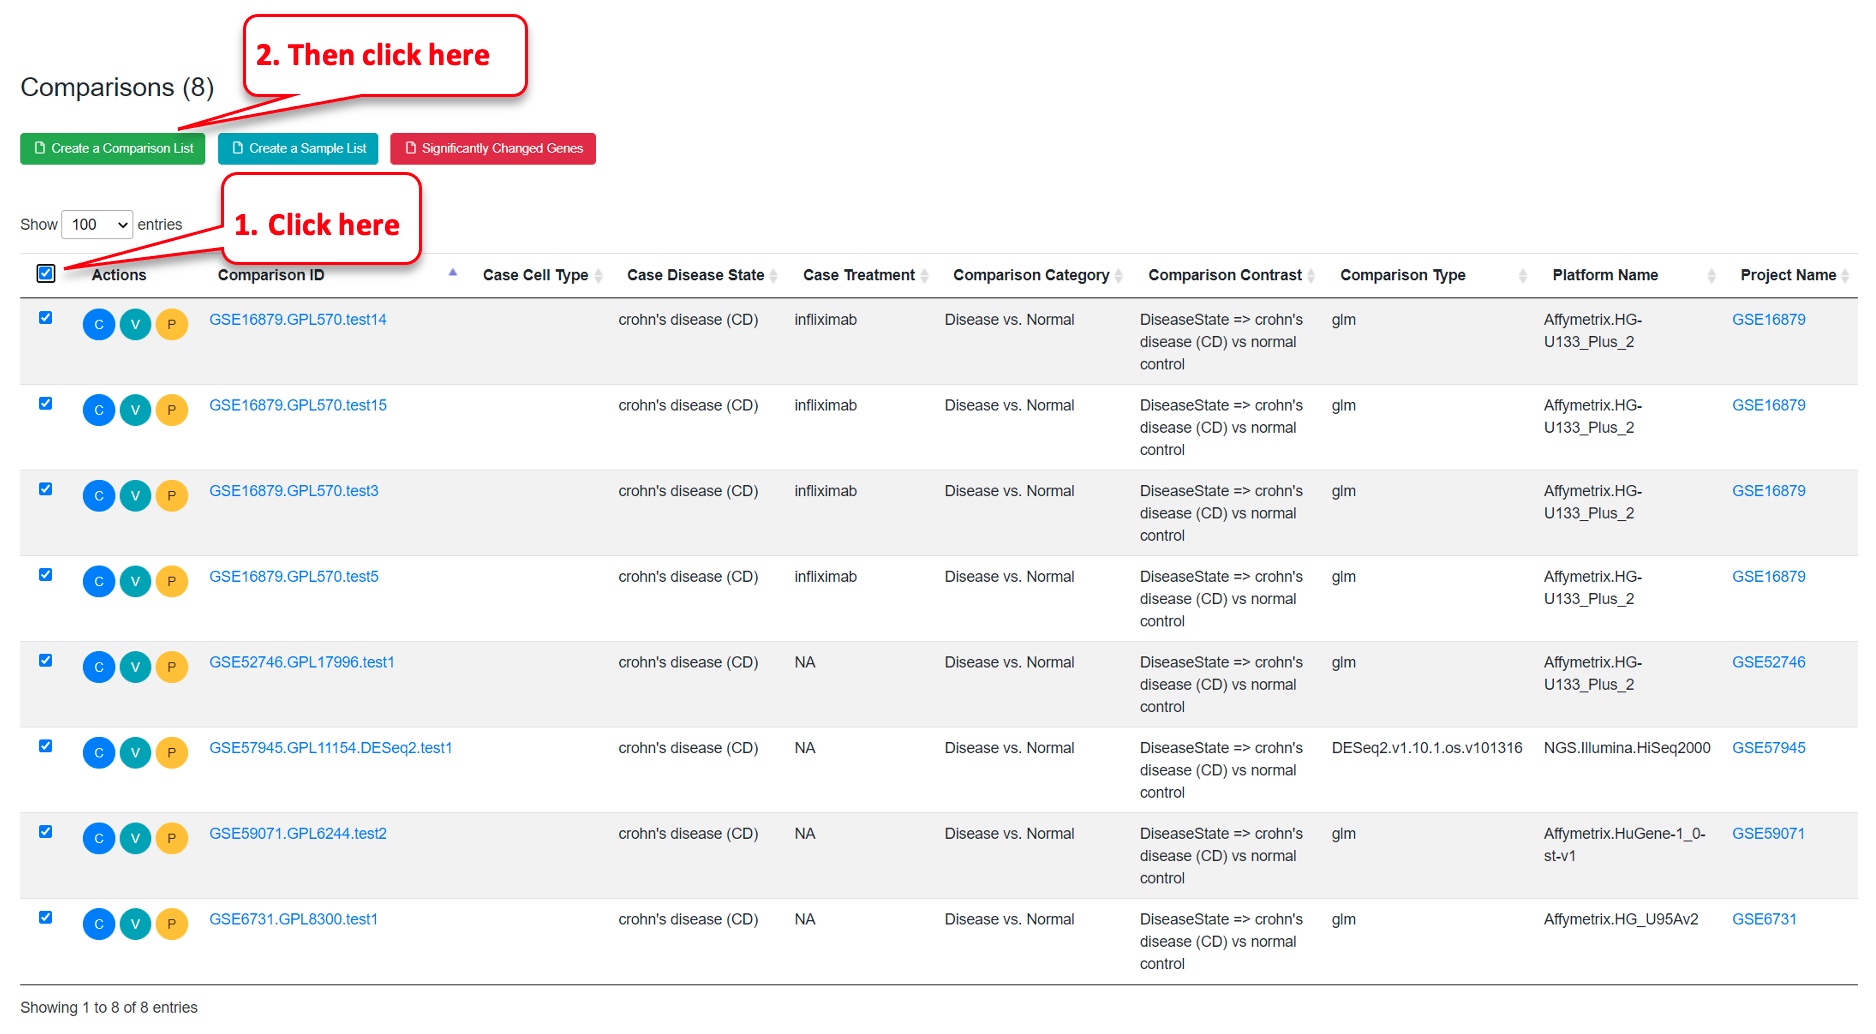
On the same Comparisons Dashboard page, scroll down to the table at the bottom.
Click on the top checkbox to select all 8 comparisons – You will see 8 check marks as in screenshot below. Then click on “Create a Comparison List.”
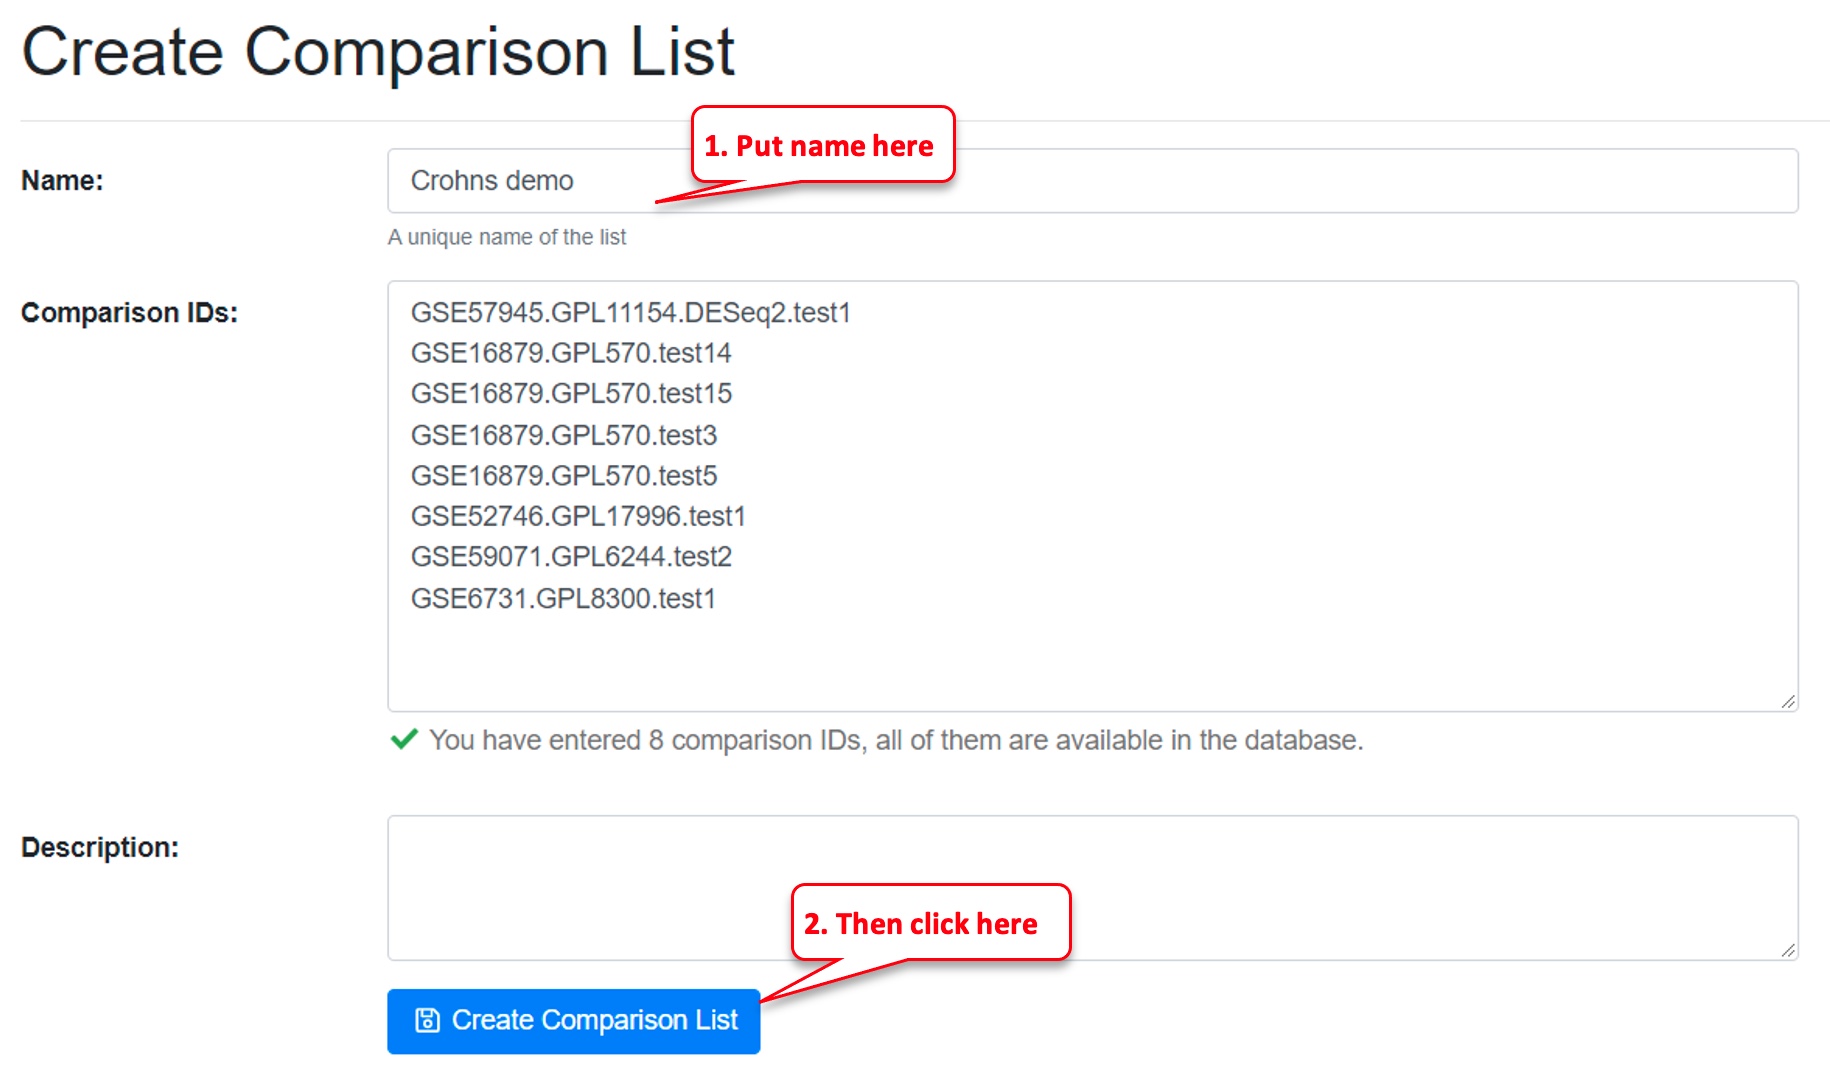
Step 4: Name the comparison list
Fill in the “Name” field, then click on “Create Comparison List.” Providing a description is optional.
Step 5: Create Pathway Heatmap
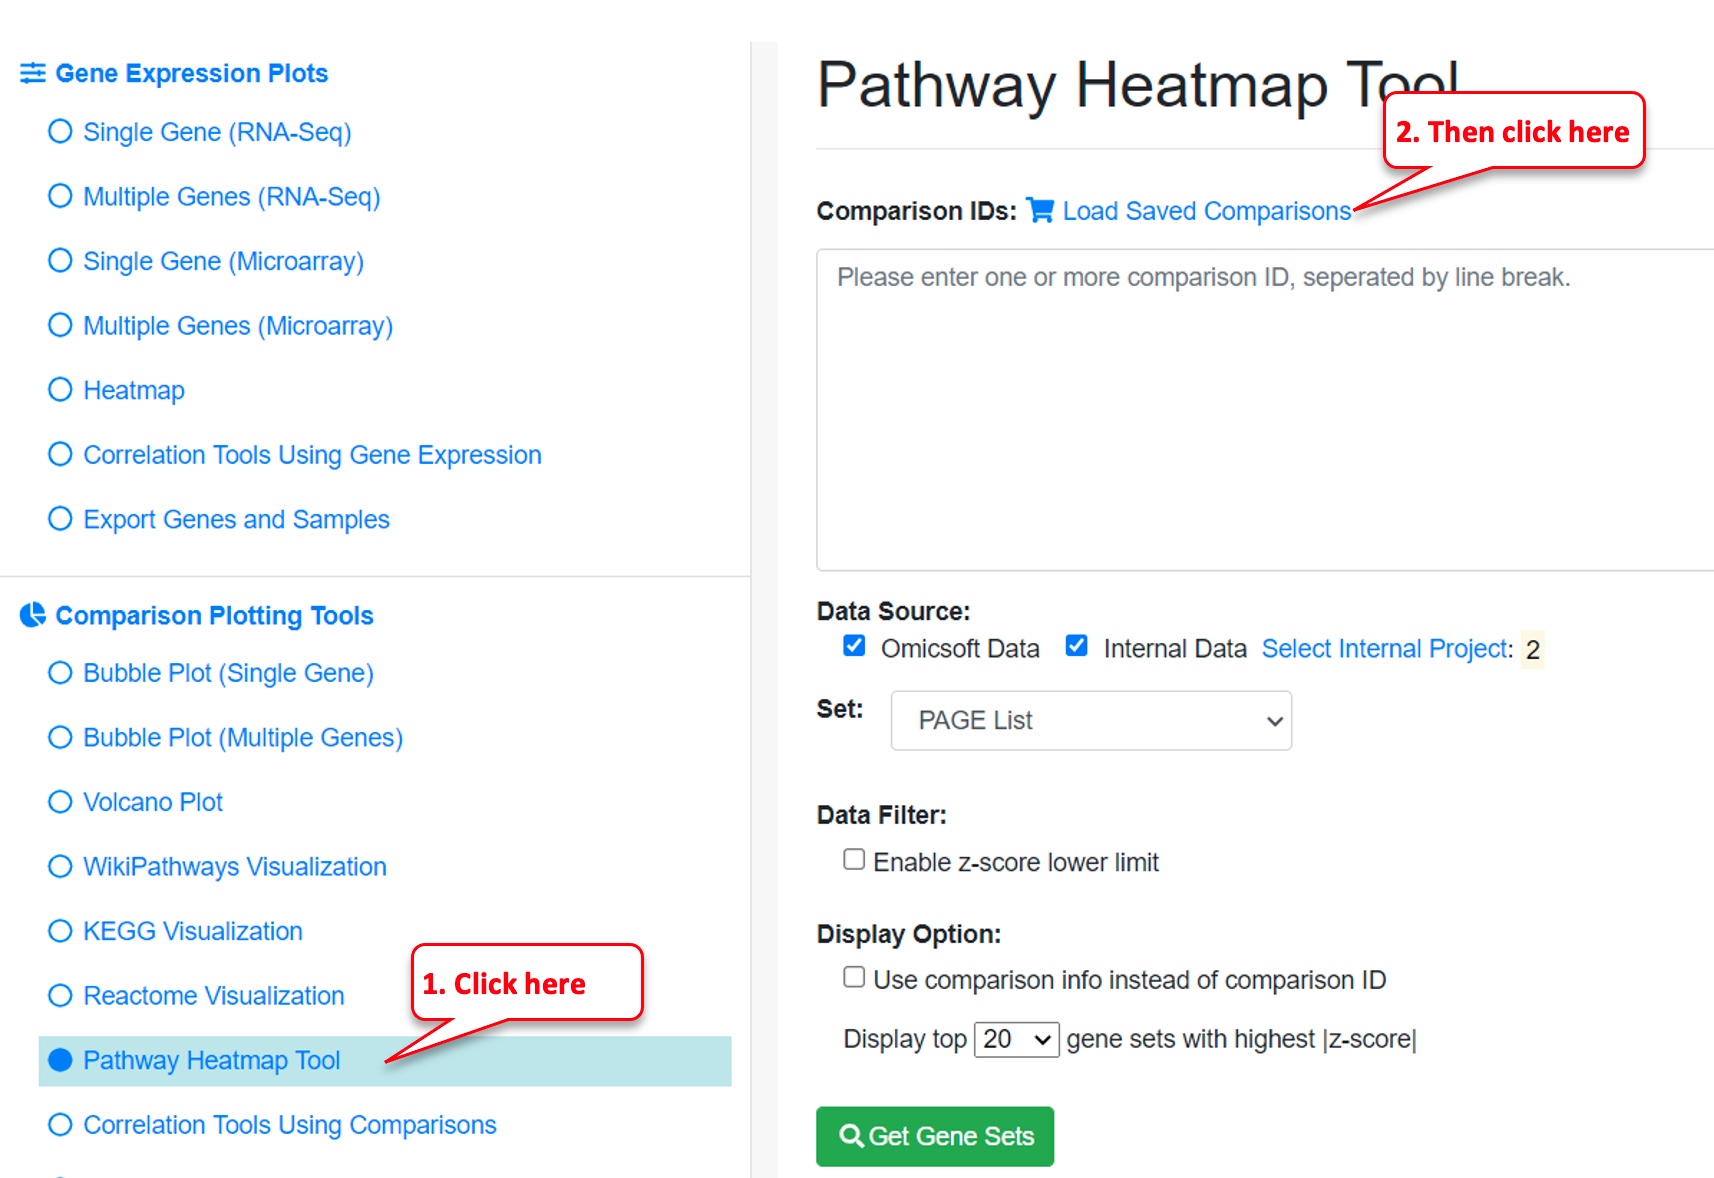
Use the menu on the left and click on “Pathway Heatmap Tool” under “Comparison Plotting Tools.”
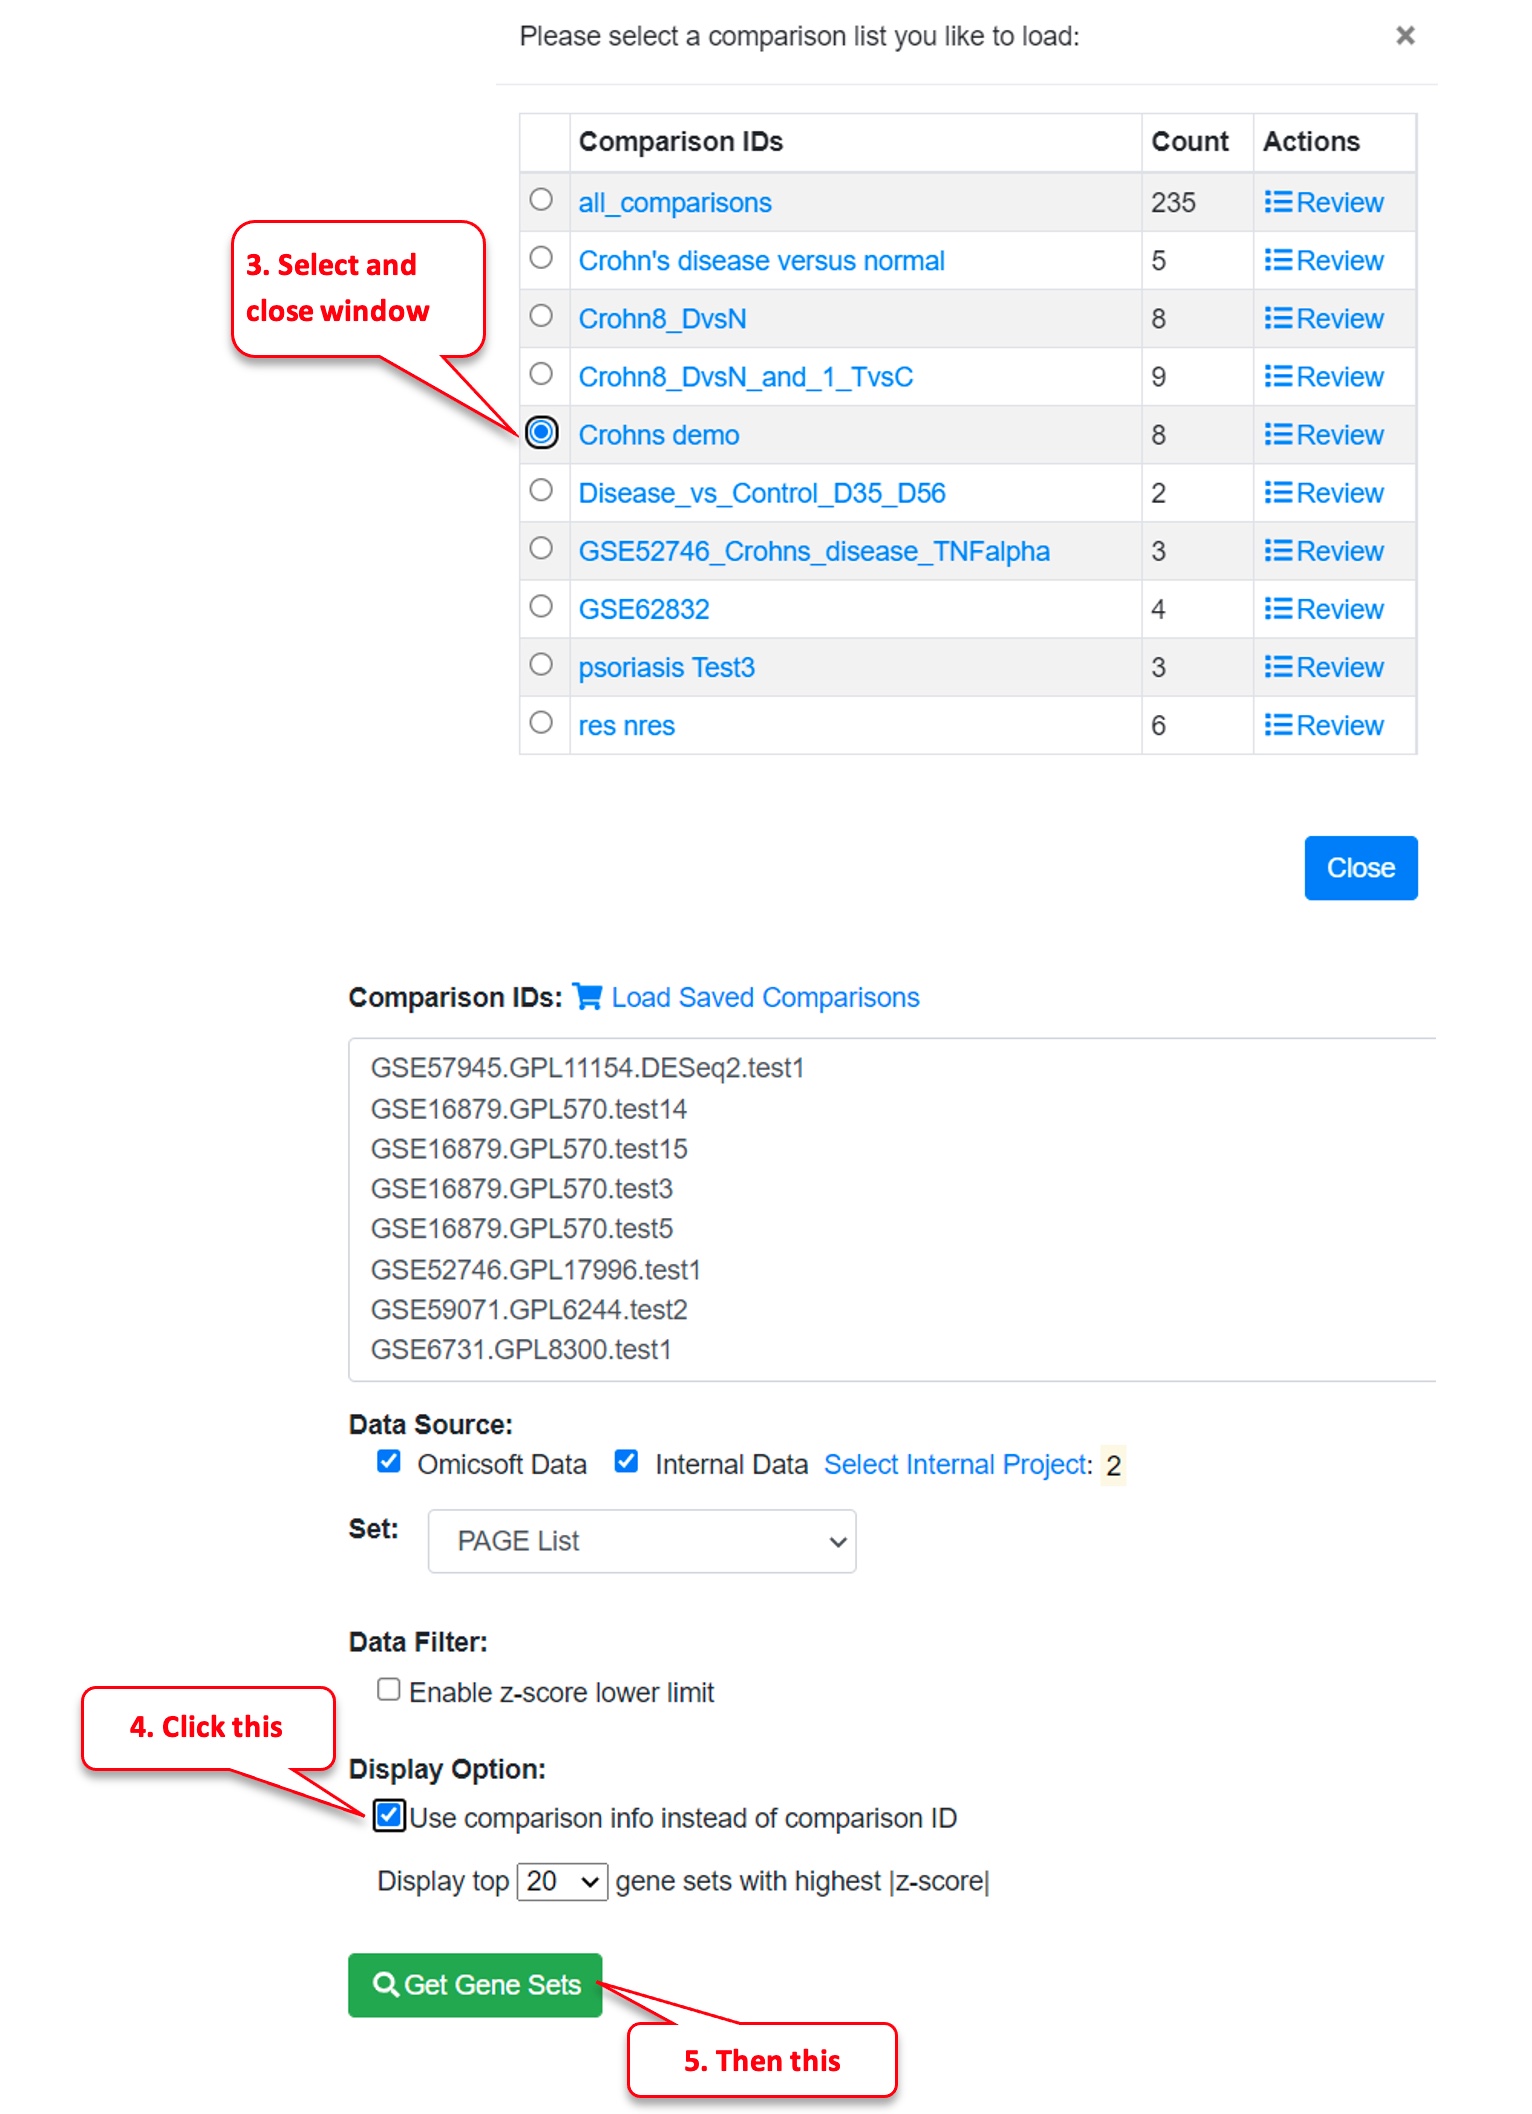
Then click “Load Saved Comparisons.”
Then select the Comparison List you just created, “Crohns demo.”
Then mark the checkbox “Use comparison info instead of comparison ID” (to provide more information) and click on “Get Gene Sets” button.
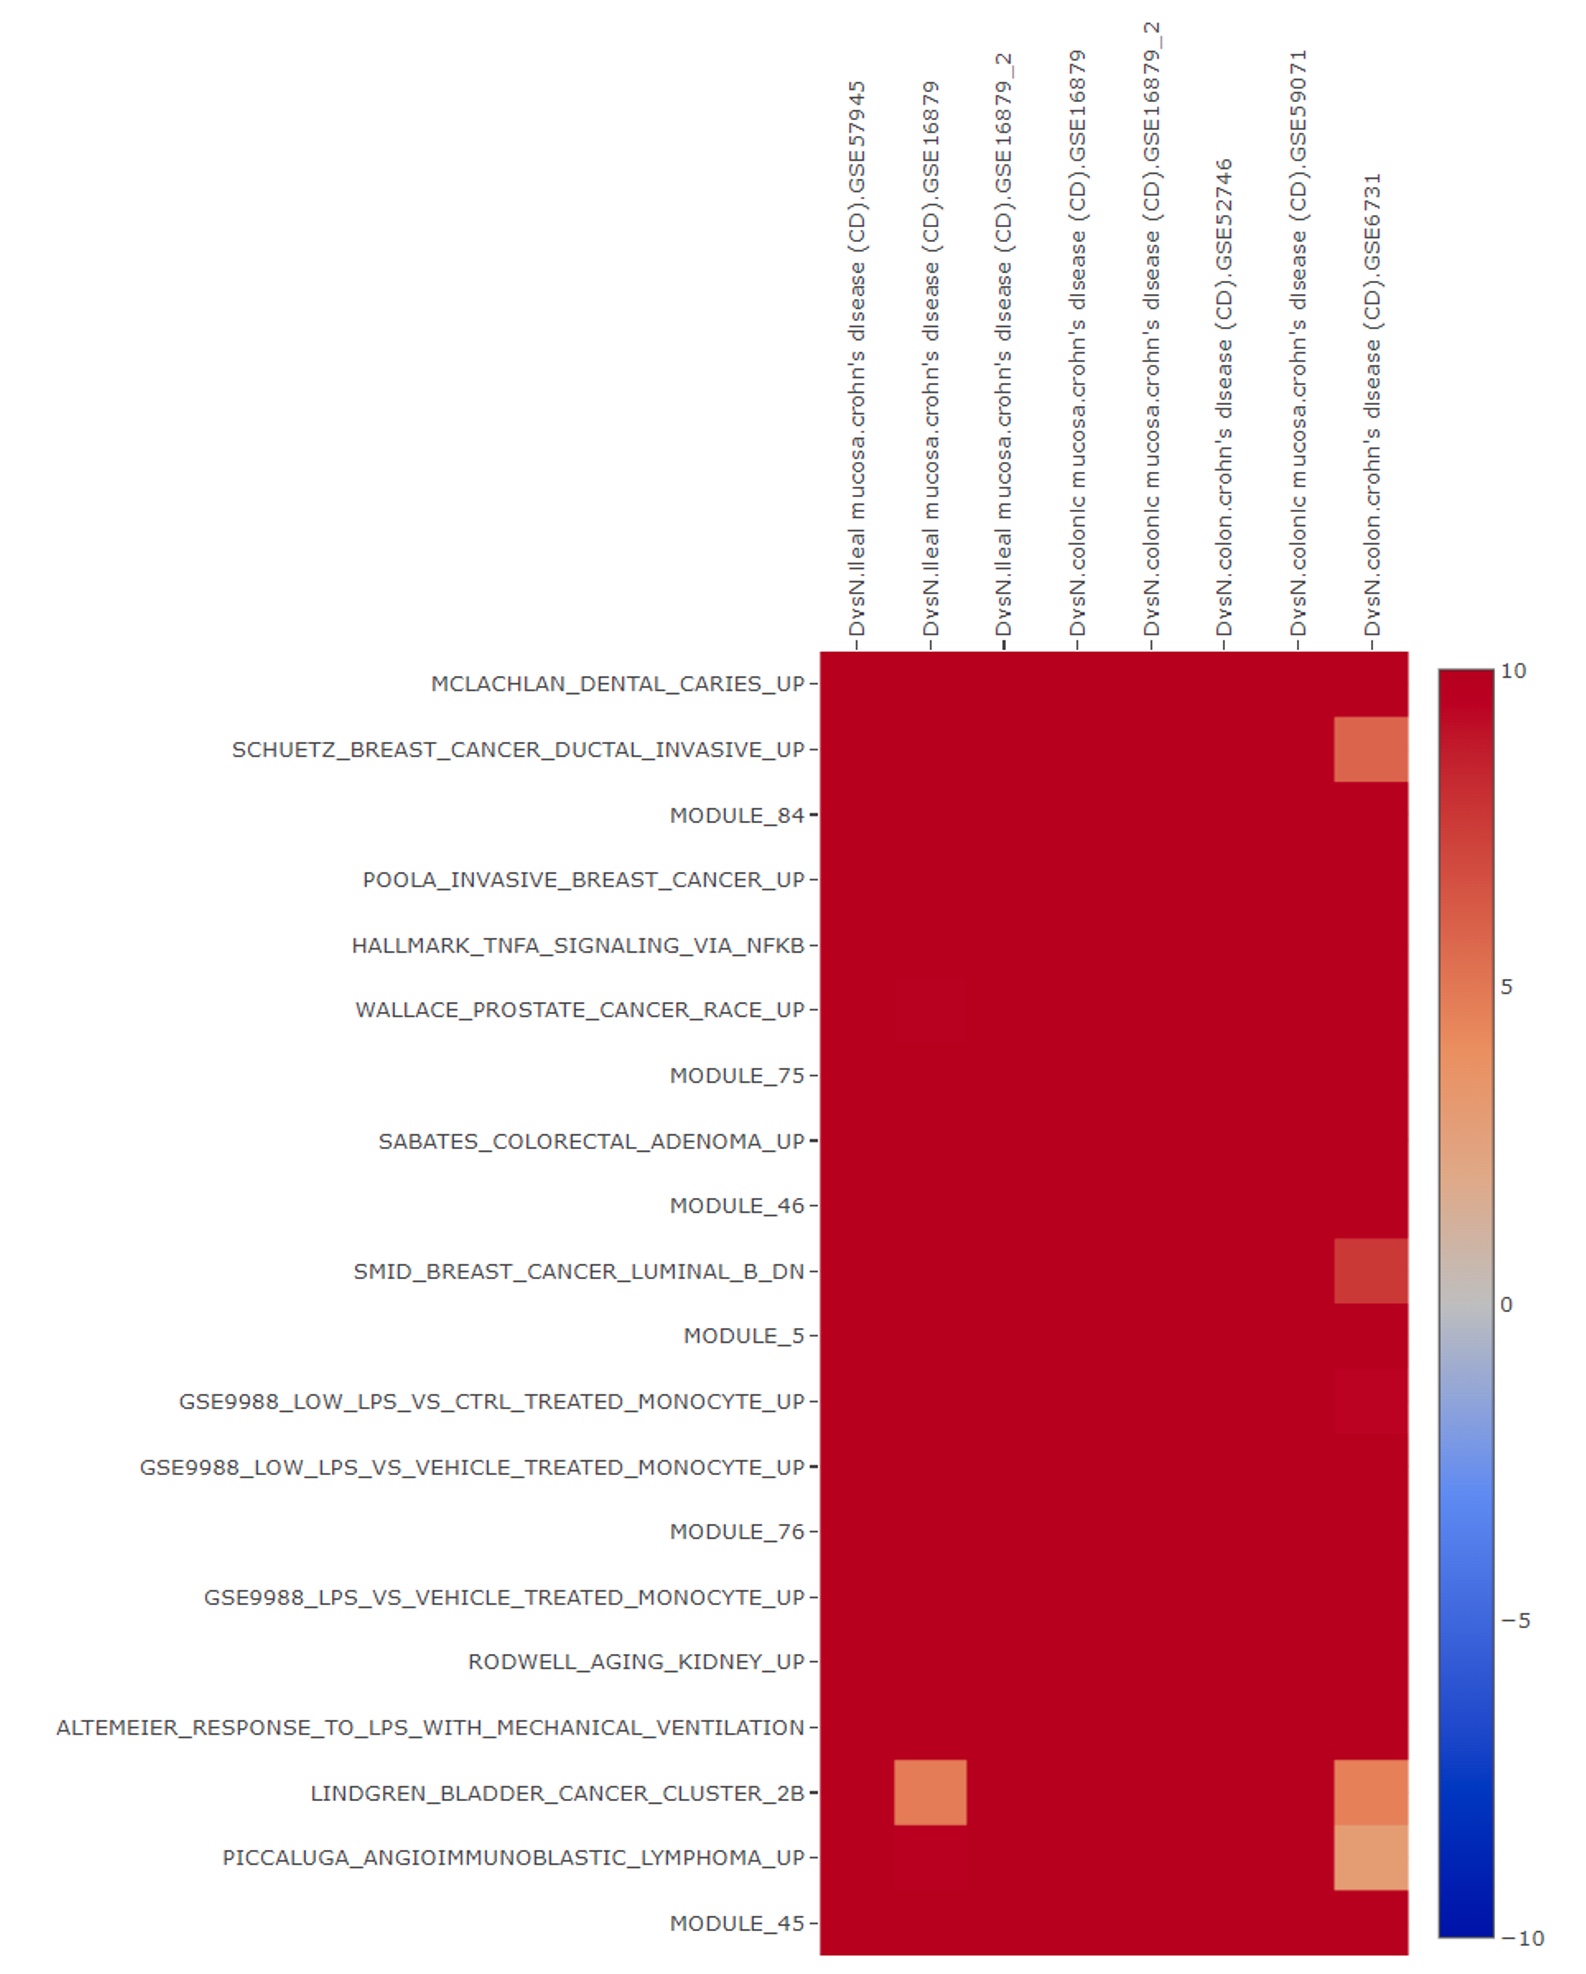
Pathway heatmap is then displayed which provides insight into highly activated immune related signature responses including TNF alpha:
Step 6: Create Pathway Level visualization for TNF alpha pathway
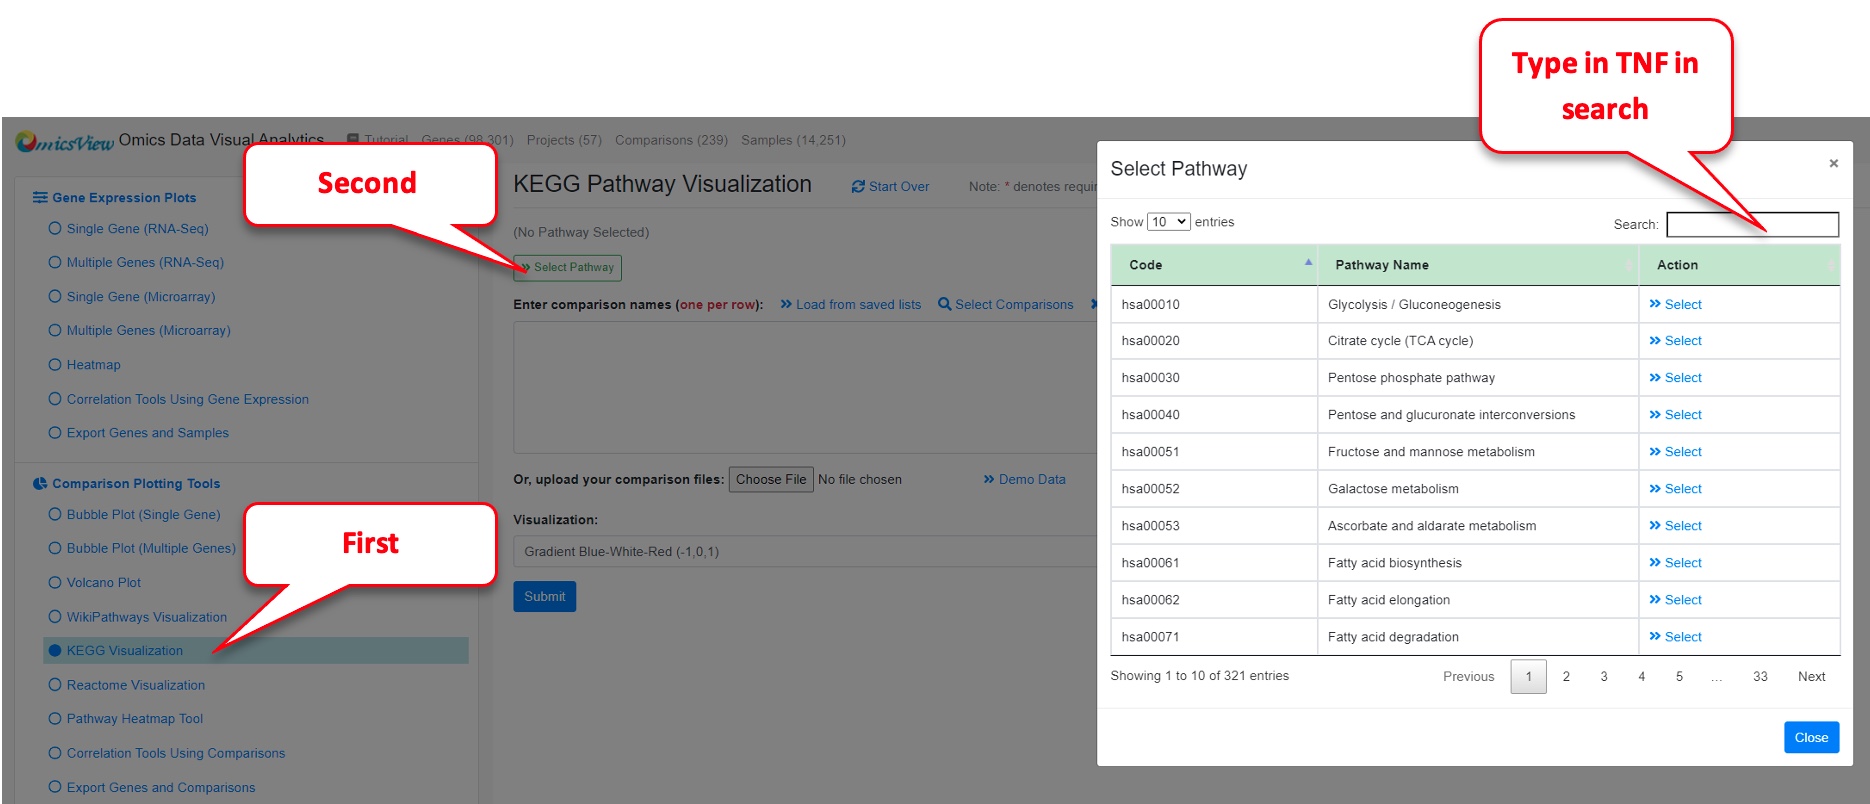
On the left side menu, pick “KEGG Visualization” under “Comparison Plotting Tools.” Alternatively, you could pick WikiPathways or Reactome, and search for TNF alpha pathway).
Then click “Select Pathway.”
Then type TNF in the search box and hit “Select” on the TNF signaling pathway that comes up.
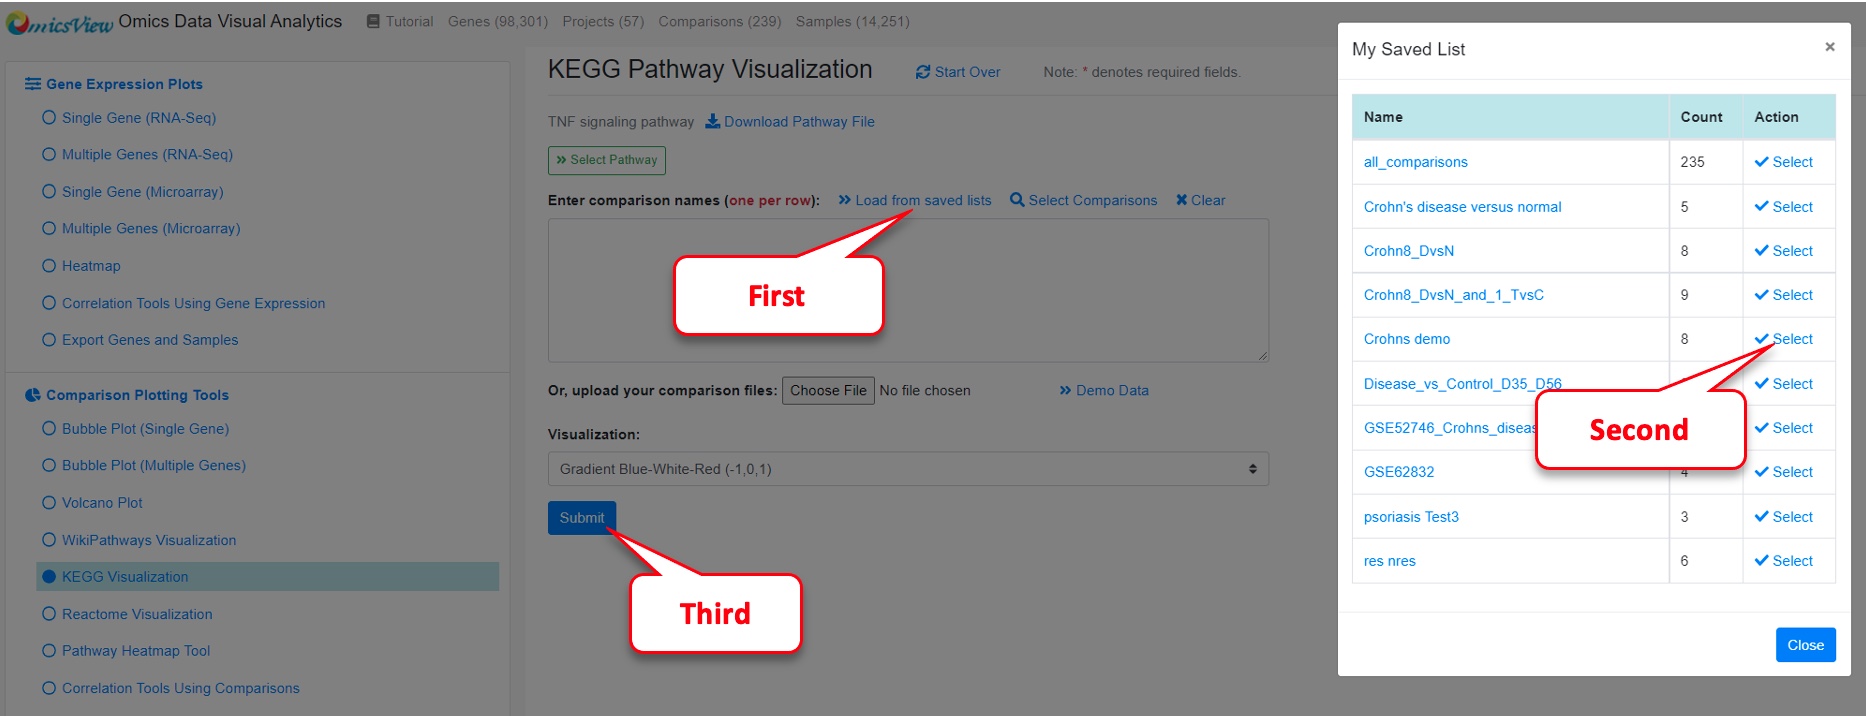
Next load the saved comparisons by clicking on “Load from saved lists.”
Select “Crohns demo” from My Saved List and Close the window.
Then click on “Submit.”
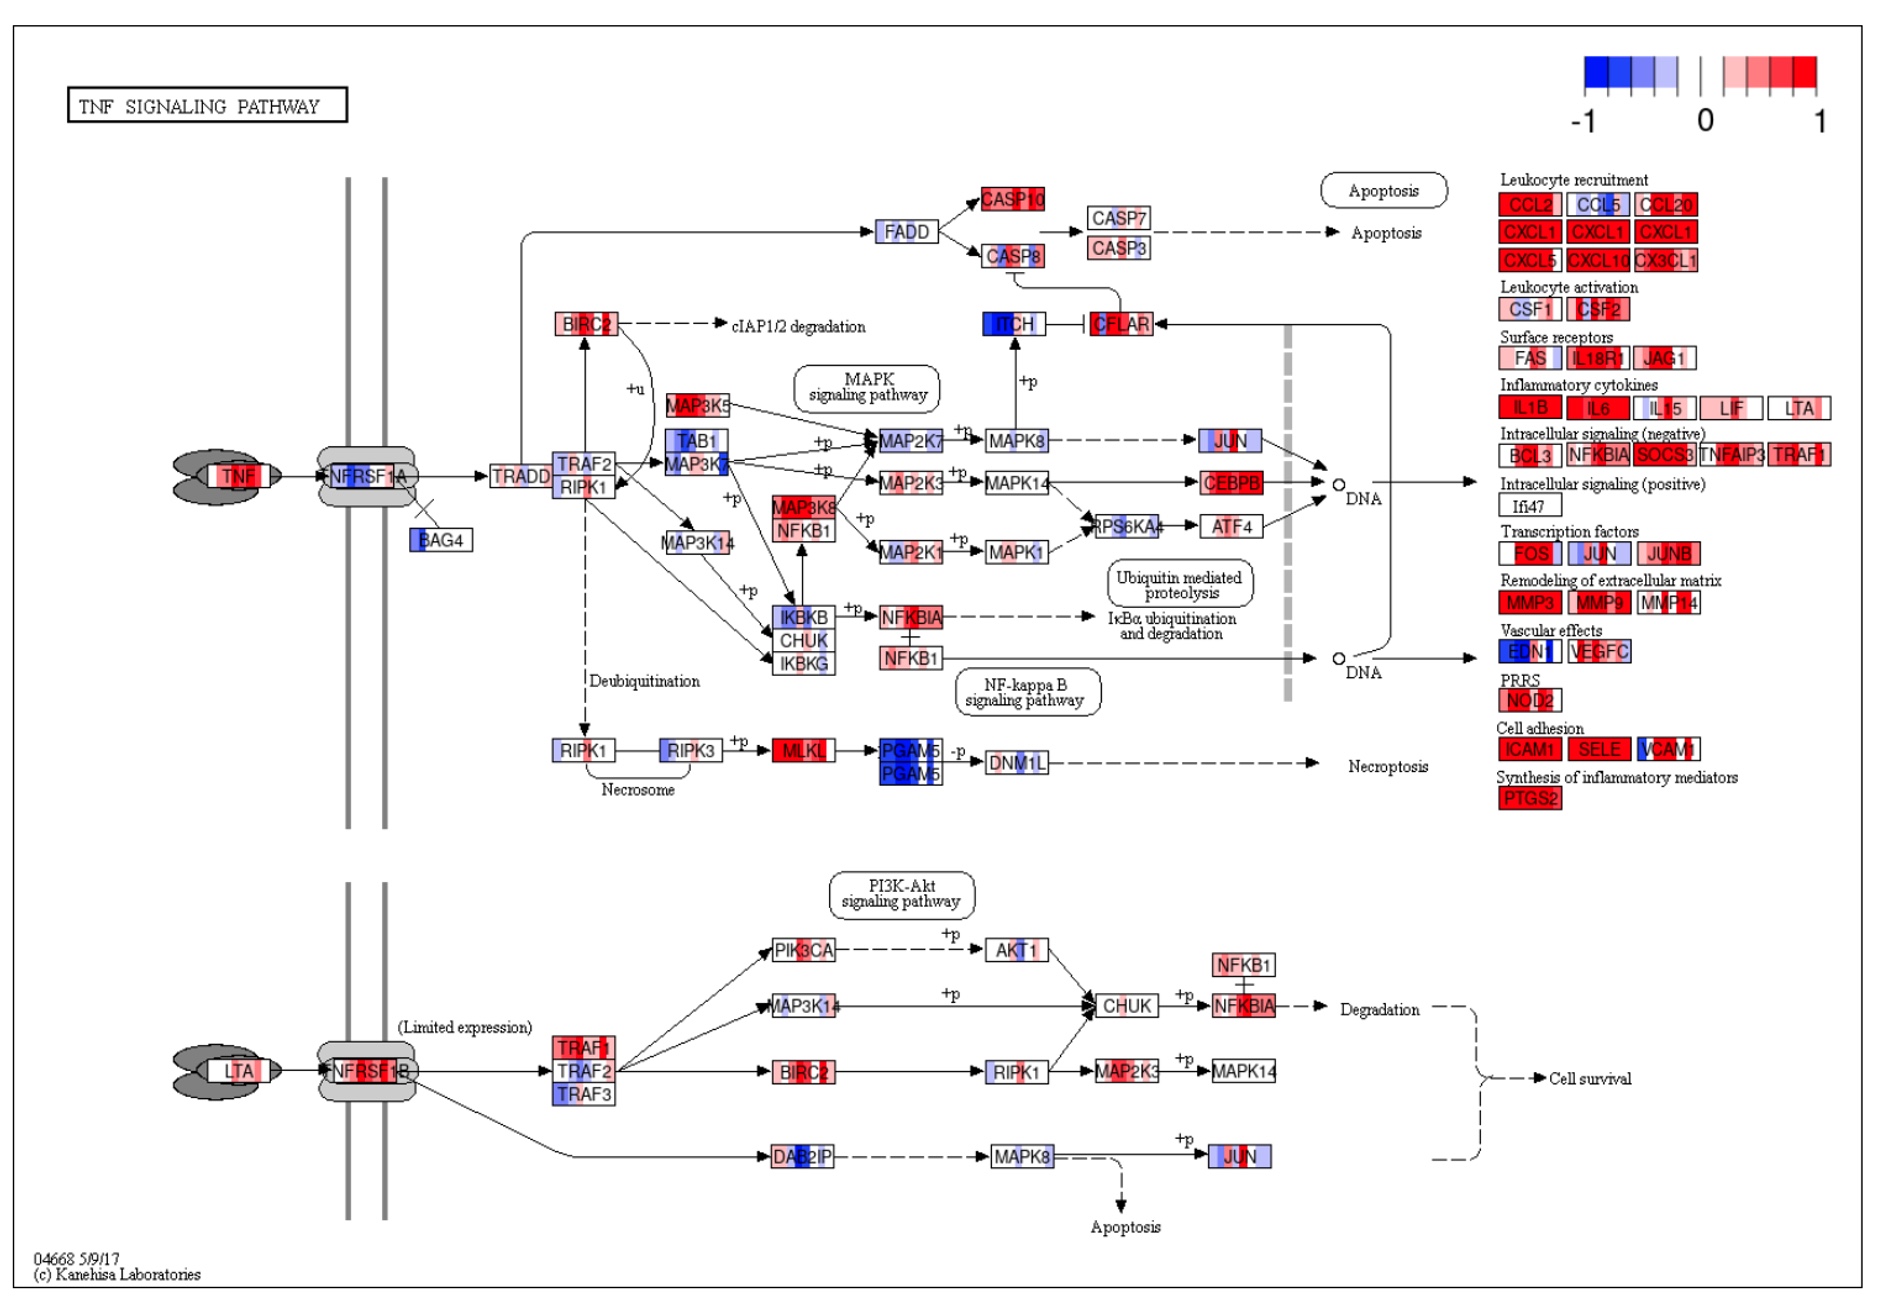
A detailed map of the TNF signaling pathway is then displayed with coloring by fold change of up or down regulation for each of the 8 disease-versus-control comparisons. It allows the user to home in on key nodes that show consistent dysregulation across datasets.
Step 7 : Meta analysis of differentially expressed genes (Comparisons) across studies
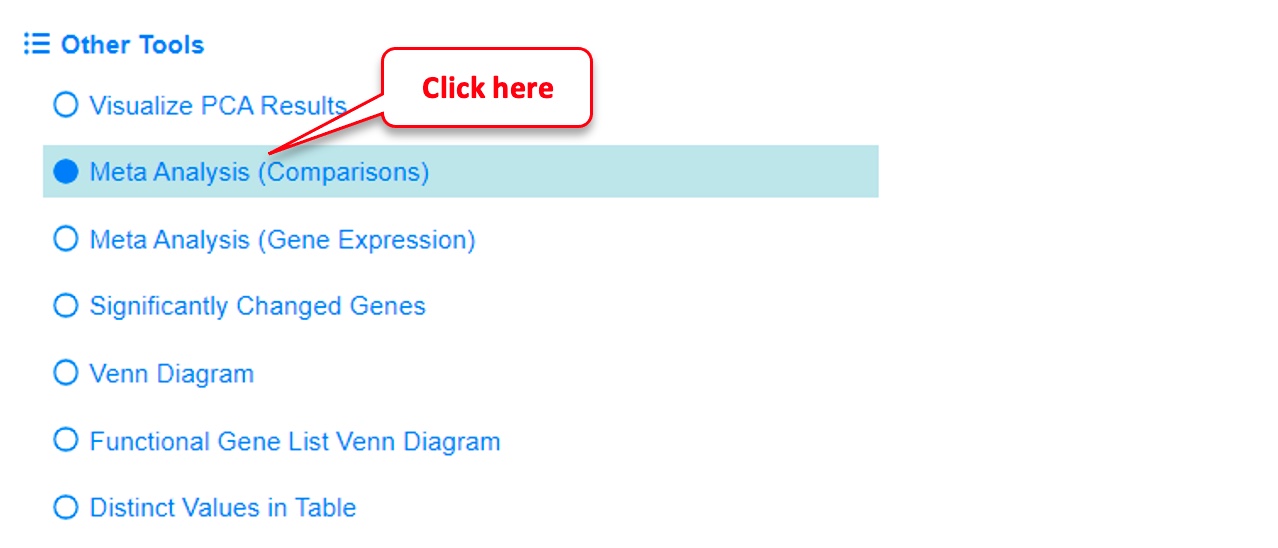
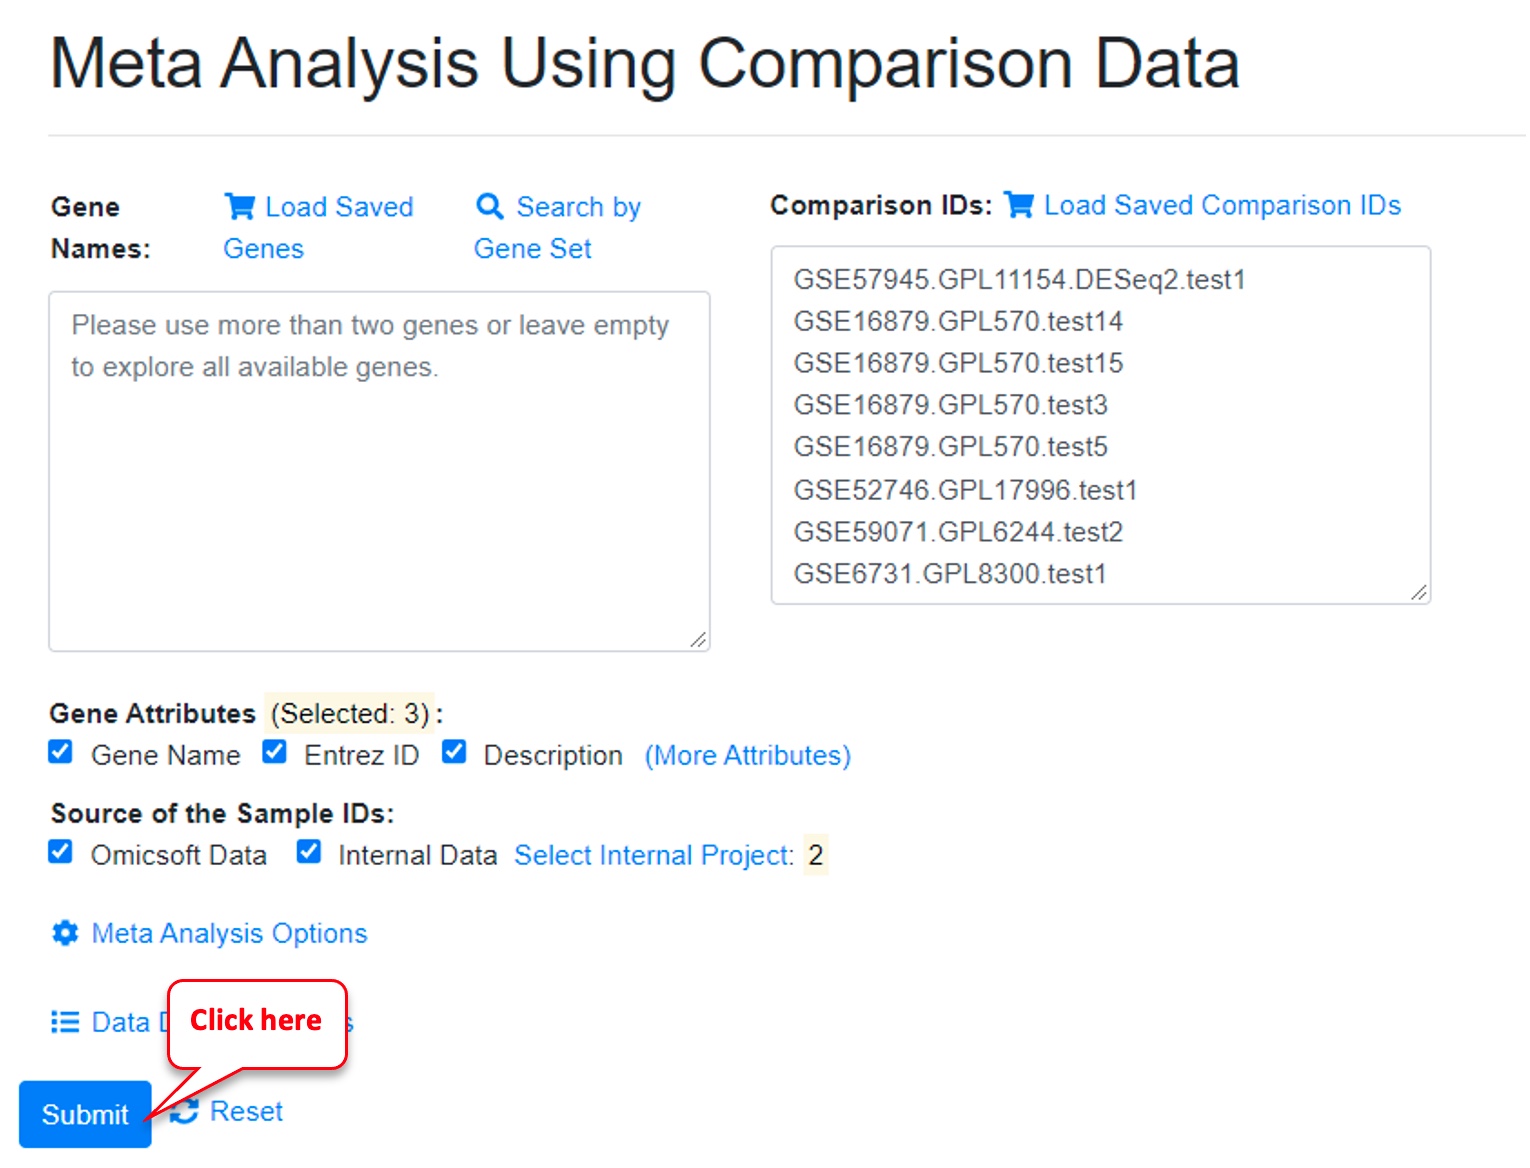
Click on “Meta Analysis (Comparisons)” under “Other Tools” in the left-hand navigation panel.
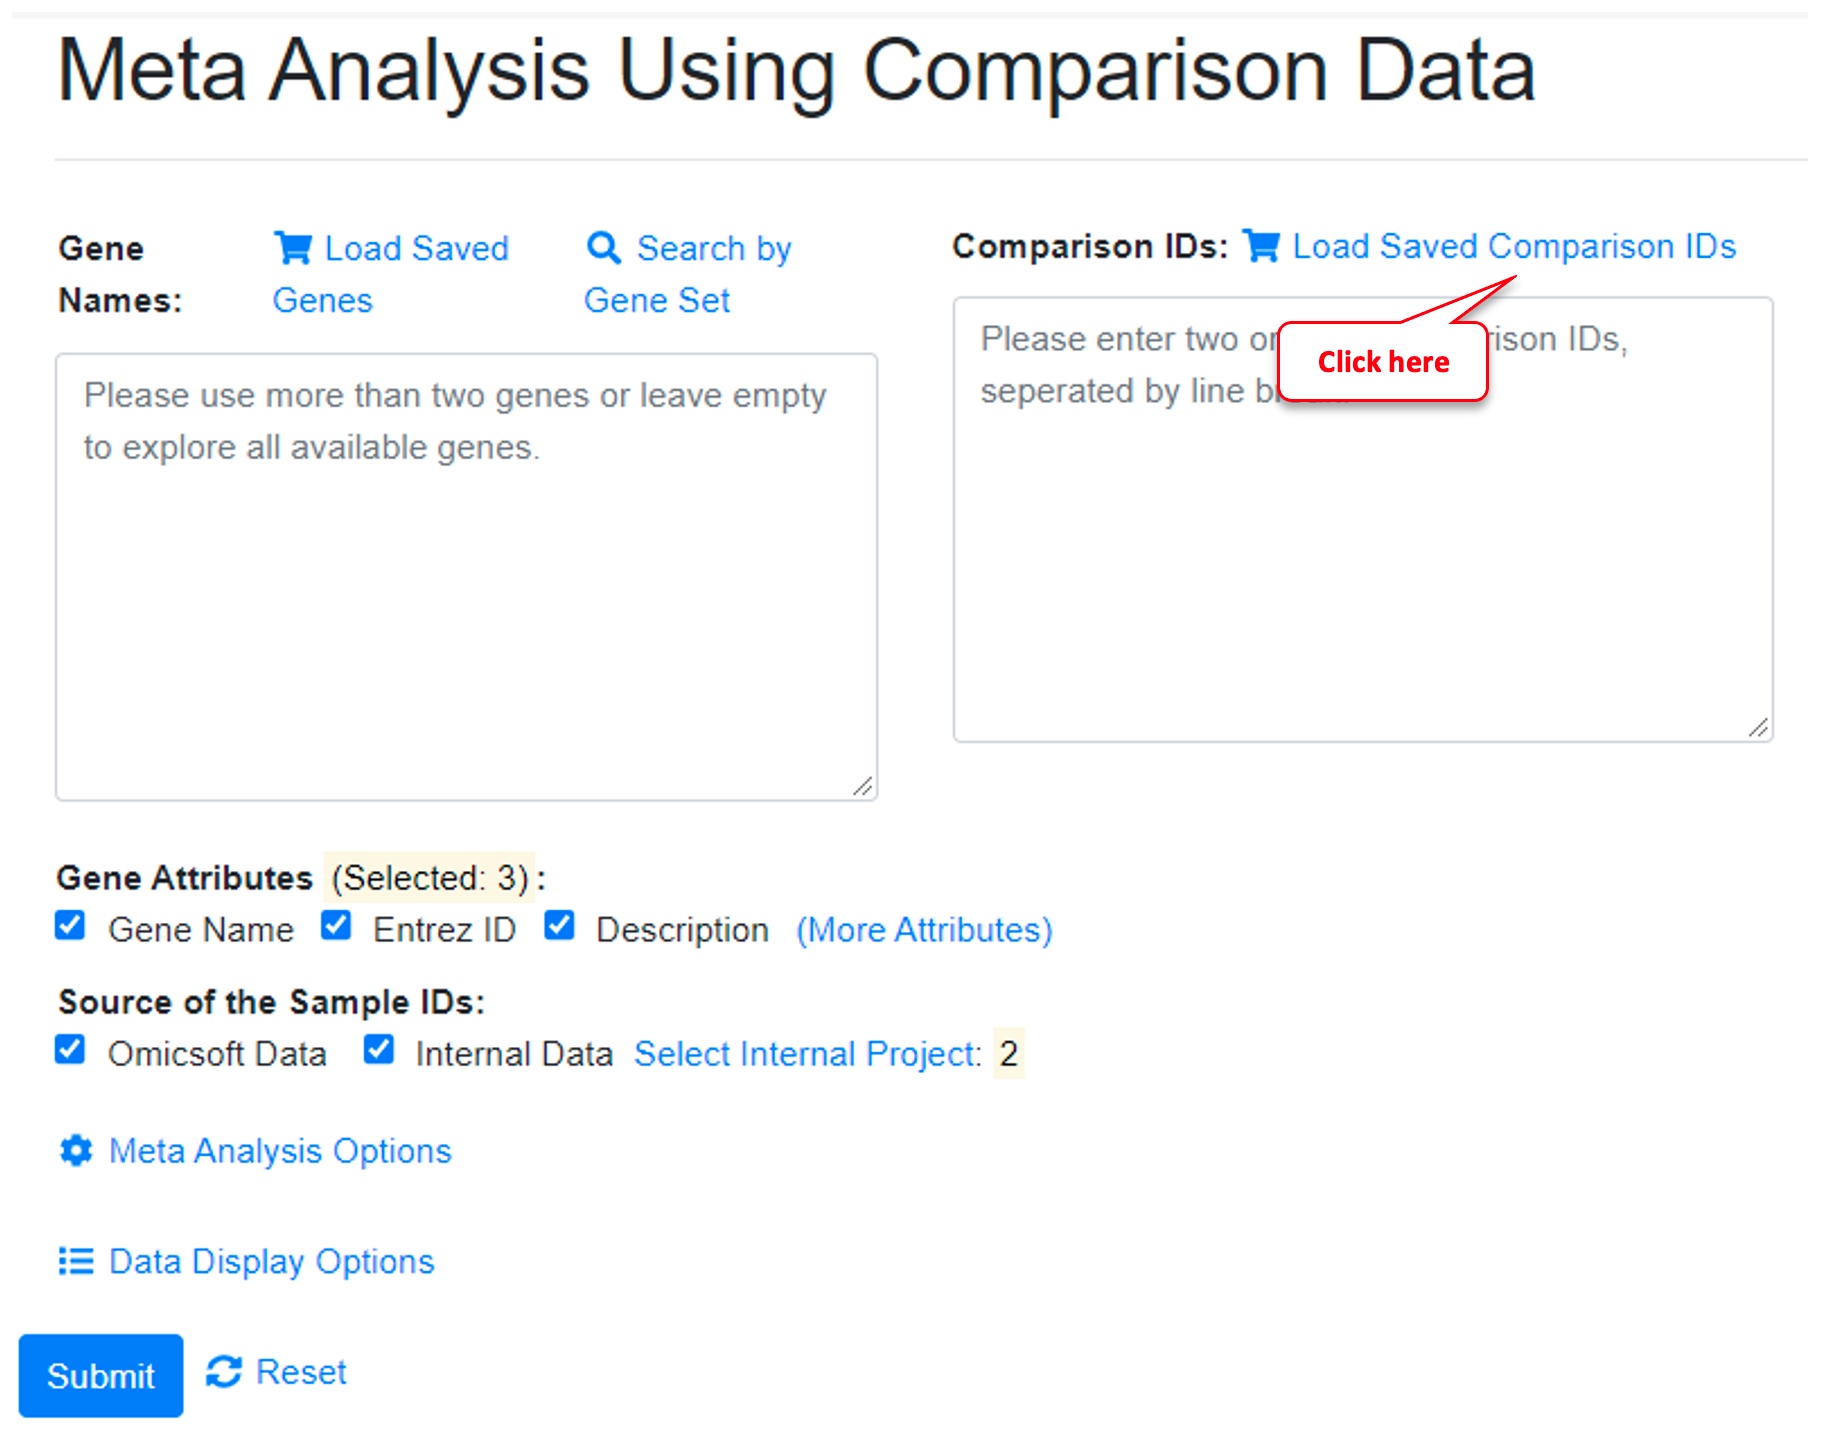
Click on “Load Saved Comparison IDs” (i.e., saved Comparison List).
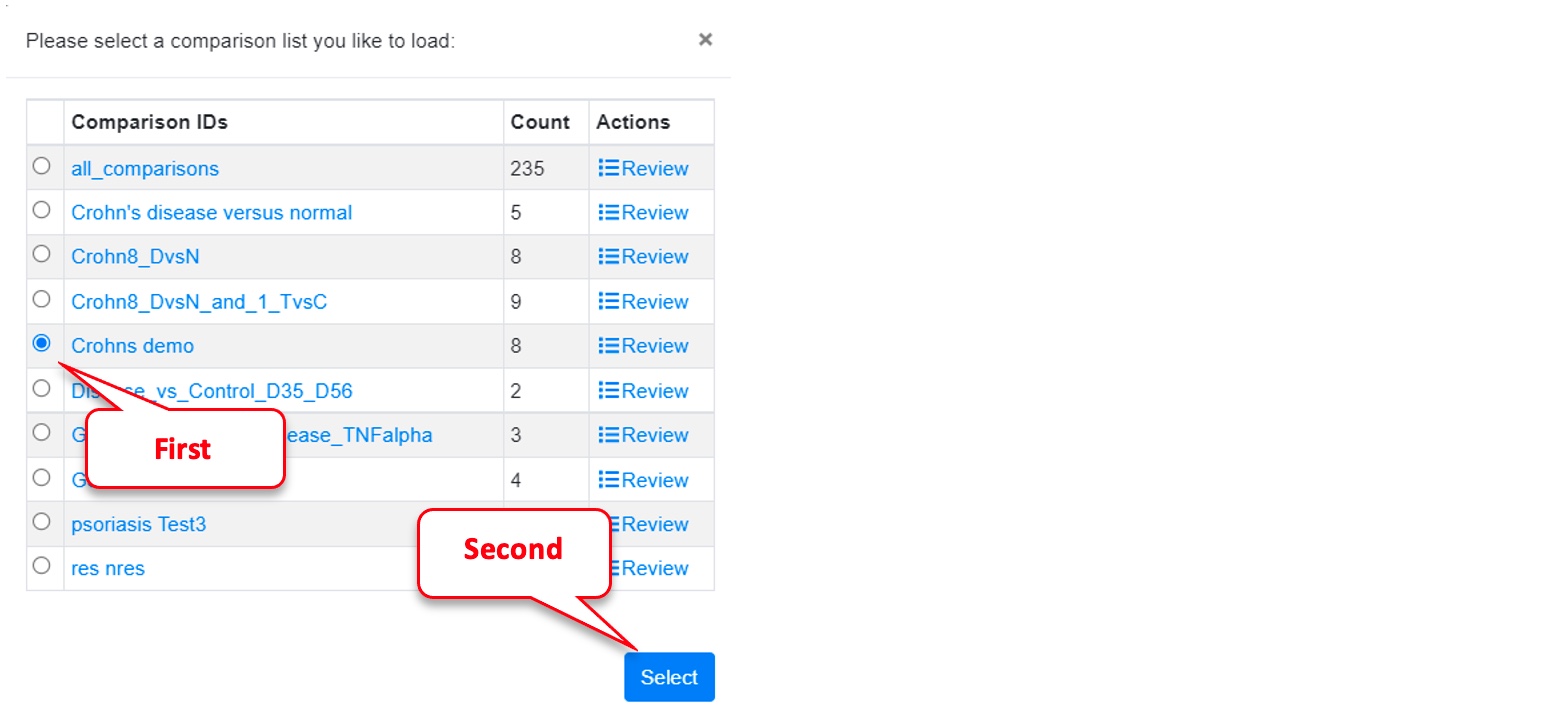
Select the previously created “Crohns demo” list and click on “Select.”
Then click on “Submit.”
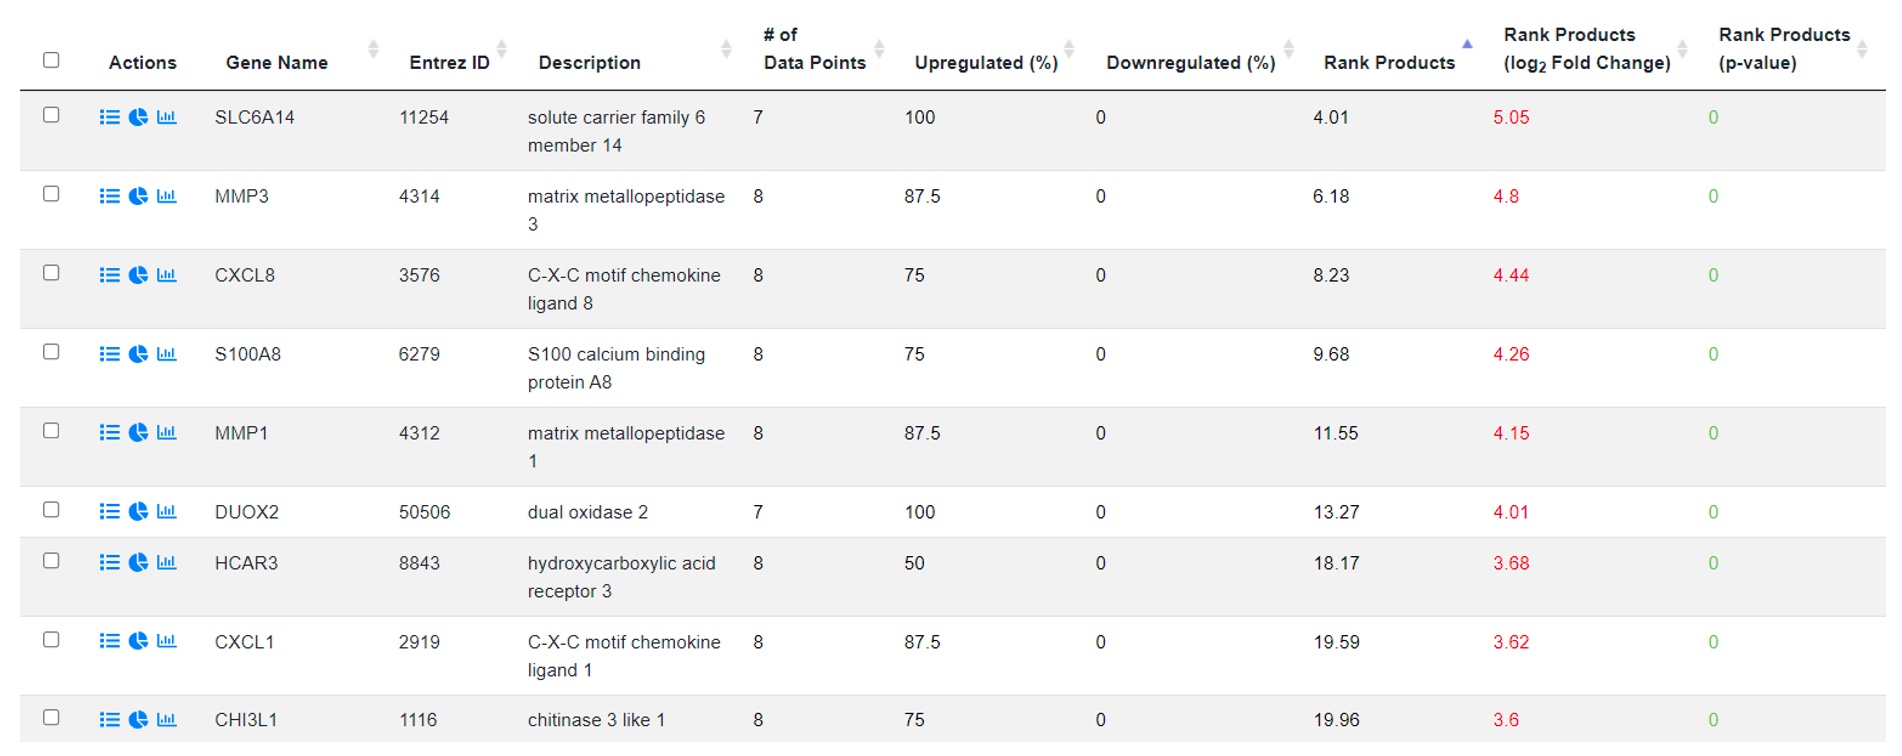
The results table shows a list of genes that have been identified as differentially expressed in any one of the previously selected datasets. The table can be sorted by column headers to get a top set of genes ranked by a variety of metrics. This allows the user to select a subset of genes that have consistent up and down regulation across all conditions/studies.
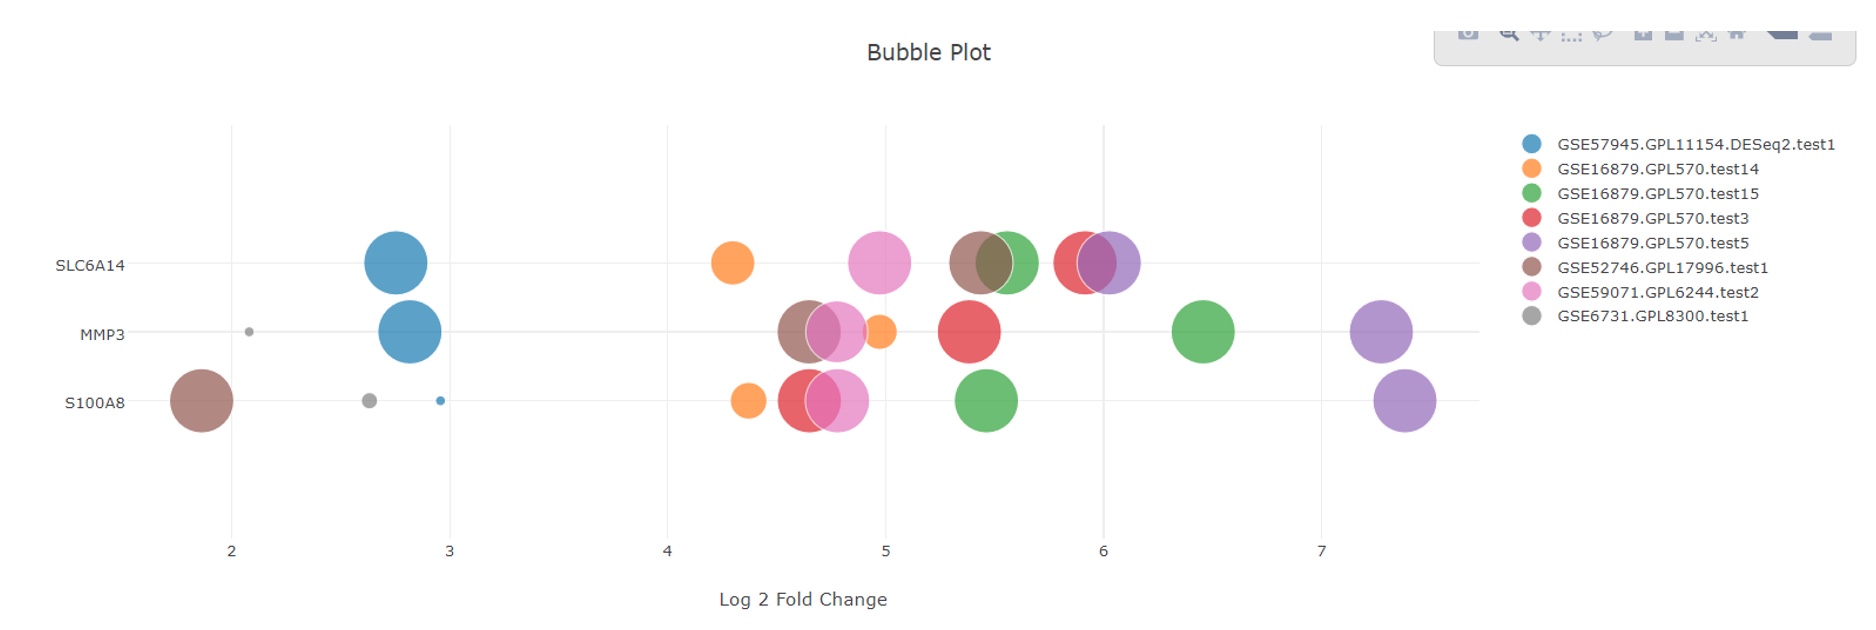
Step 8 Create bubble plot from meta-anlysis results
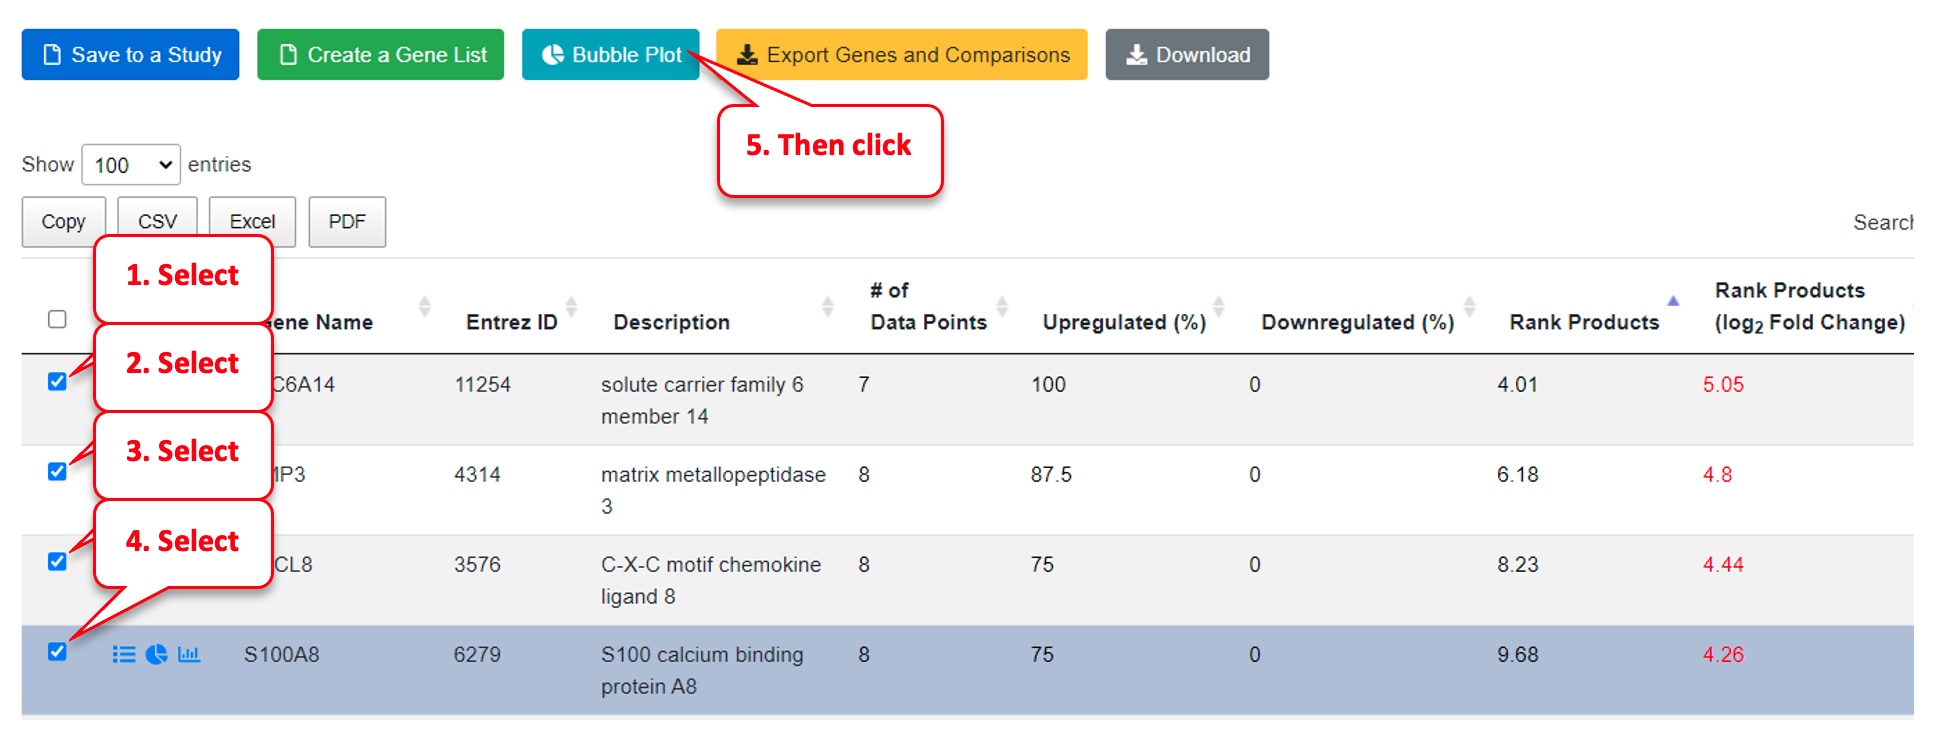
Select the top genes from the Meta Analysis table.
Click on “Bubble Plot” above the table.
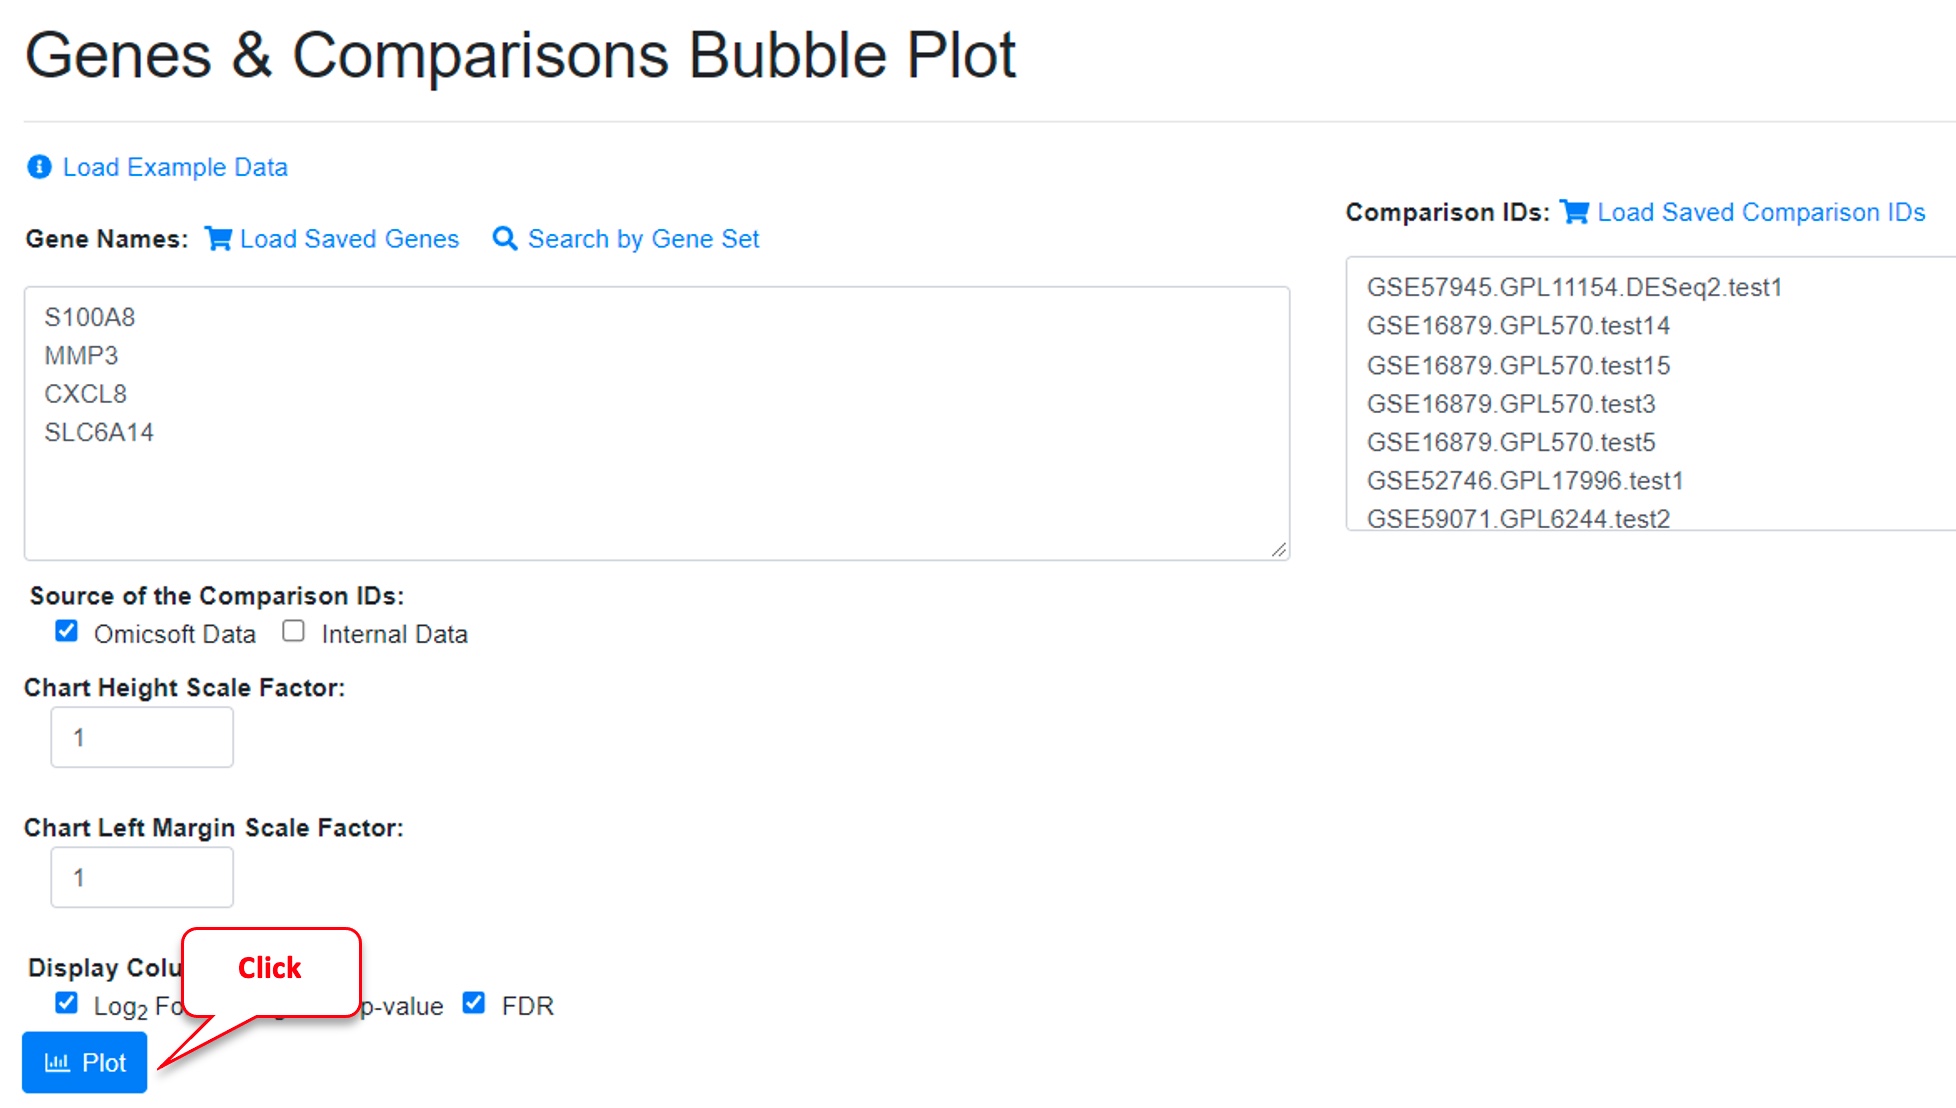
Load the previously saved comparisons by selecting “Load Saved Comparison IDs” and selecting “Crohns demo.” Then click on “Plot” on the bottom of the new page.
The bubble plot gives an intuitive view of the extent of change of each gene (log2 Fold Change on x axis) and the significance (size of the bubble) across the studies. It also allows user to see if any of the studies/comparisons are outliers that display a different pattern from the others with respect to gene expression changes.
