Chapter 1 Overview of Data in OmicsView
The homepage of OmicsView gives an overview of the data curated. The Pie-charts and Bar-graphs are reactive and change depending on the selection. Users can access the different data tables from the left menu under search, or from the shortcuts at the top menu bar. Left menu can be hidden to provide more space for tables and graphs.
1.1 Projects
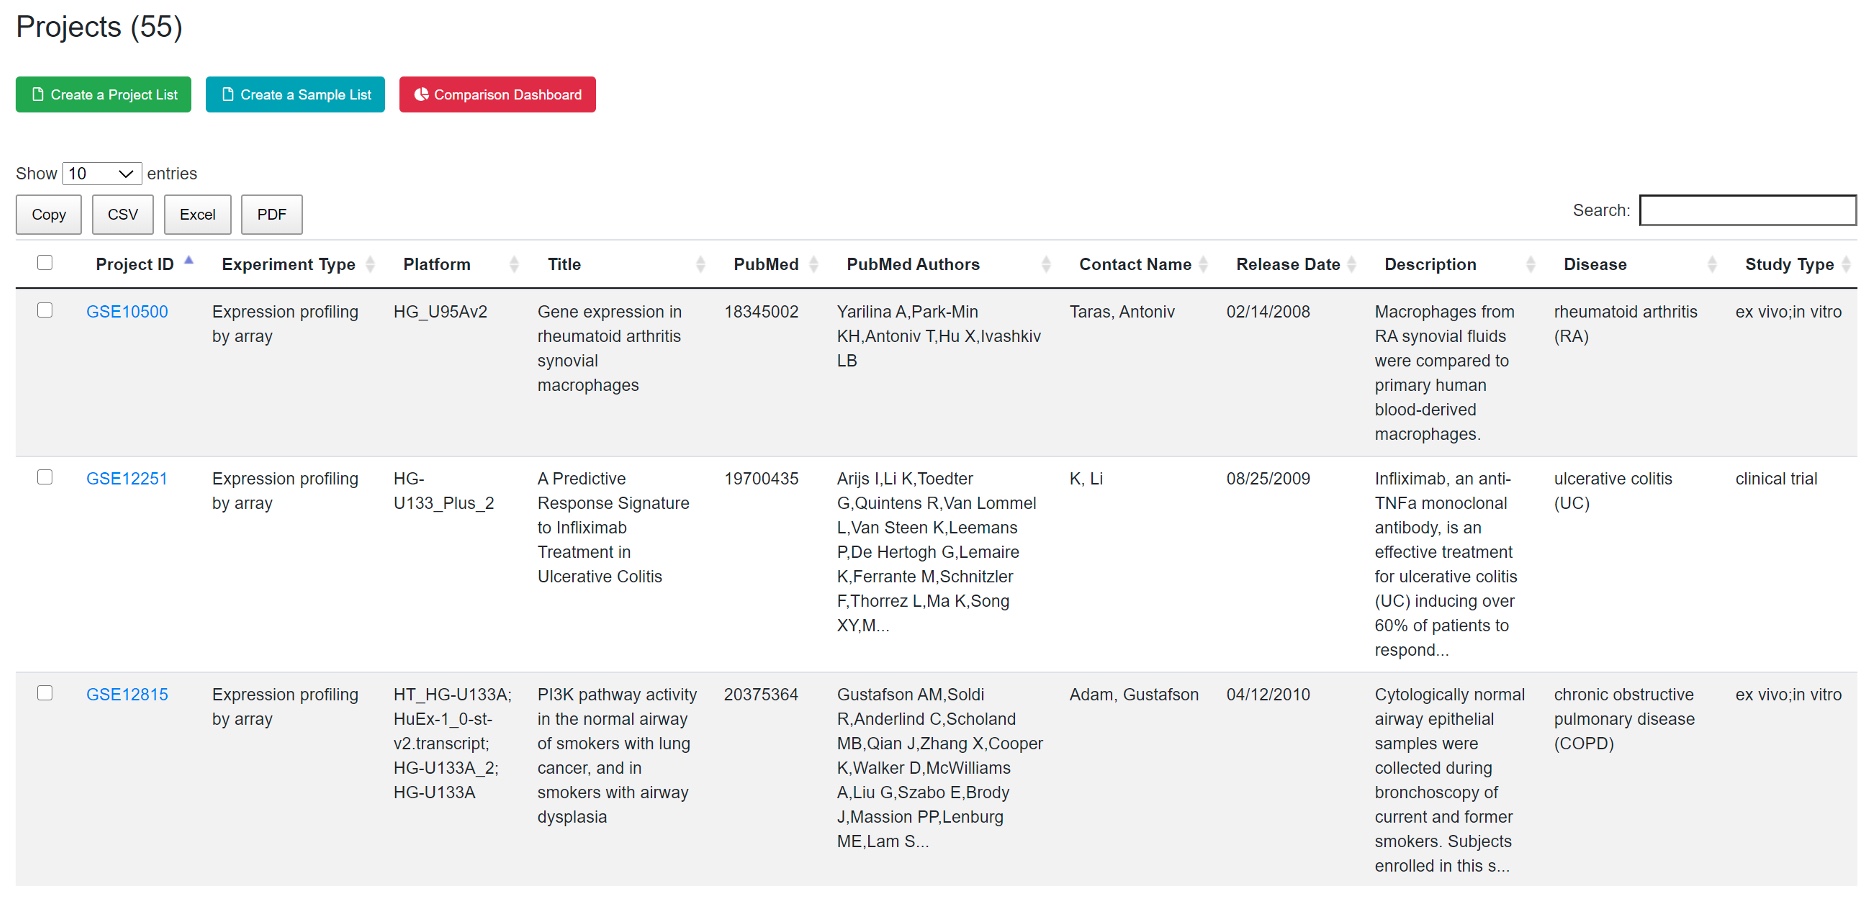
Individual research project is typically associated with a published study and has NCBI GEO accession number. Users can search projects from the home page. In the search result page, click each Project ID to view the full description of a project.
1.2 Samples
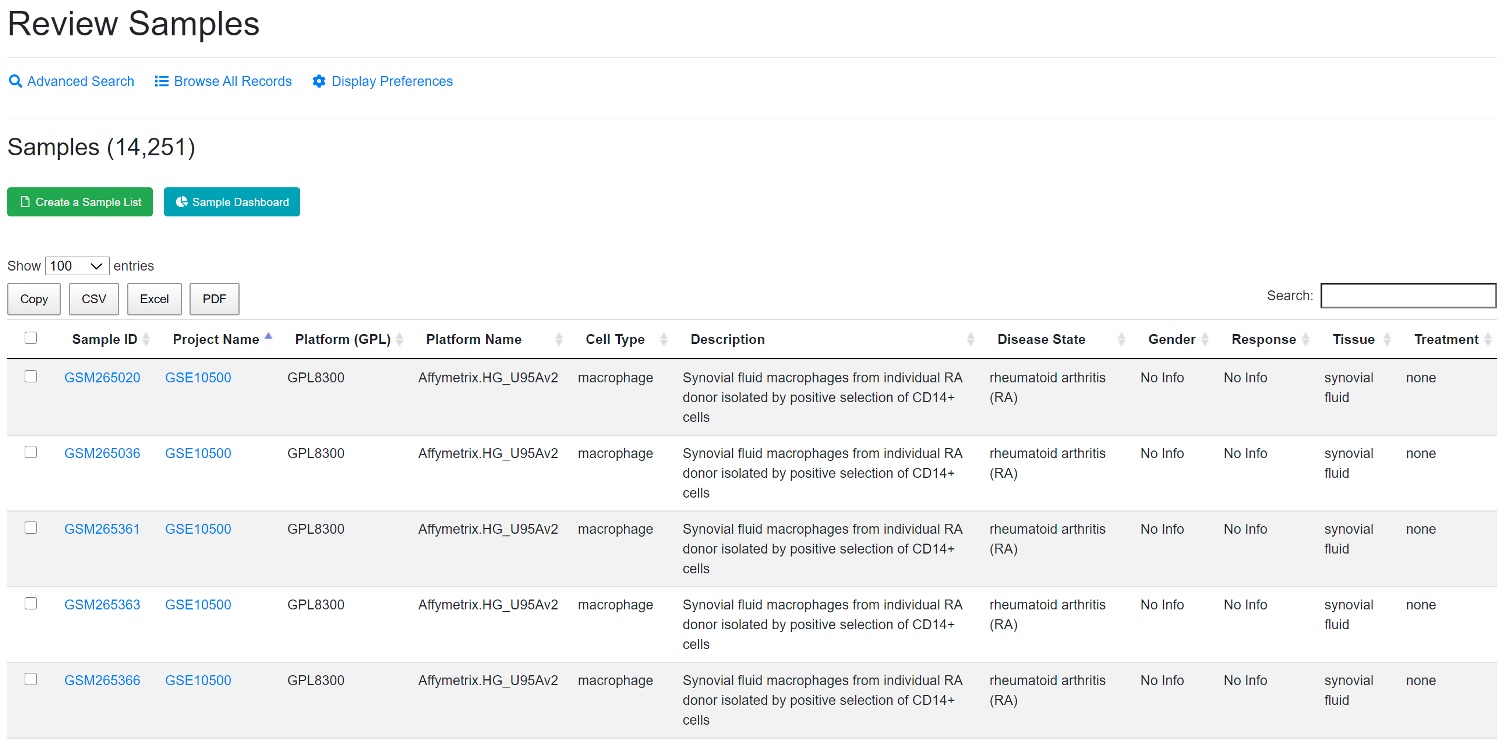
A project may include many samples. Each sample has its own description (full details available by clicking each Sample ID). Each sample has a gene expression profile.
Users can search for specific samples using the search box. To change columns displayed in the table, go to the Display Preferences. Users can create lists by selecting specific samples using the “Create a Sample List” button. Users can then specifically download this list as a CSV.Excel/PDF. Samples from your collection can be loaded to other tools like heatmap.
1.3 Comparisons
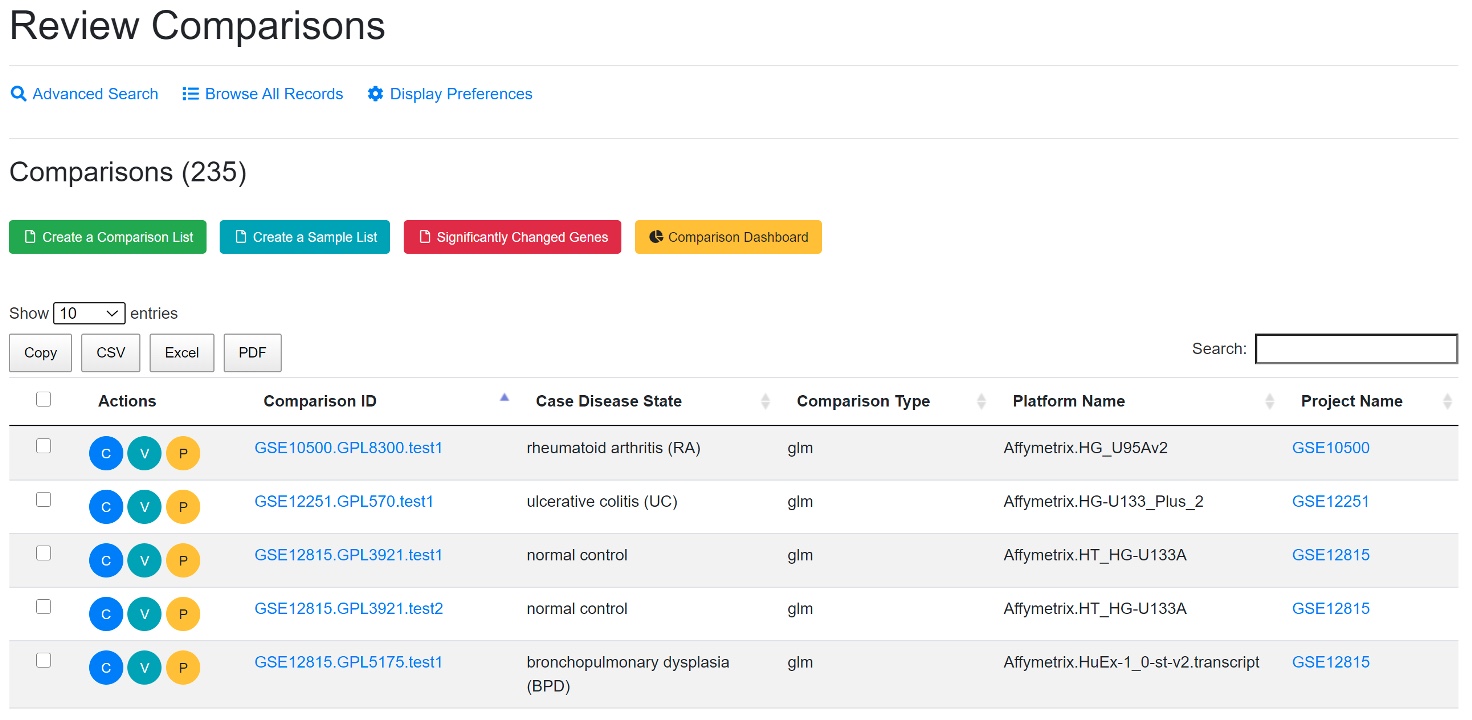
Two groups of samples are compared, and the statistic values (fold change, p-value, adjusted p-values) are computed. There are a lot of meta data available for each comparison. See the dashboard for an overview of key categories, and the detailed description of each comparison has the full information.
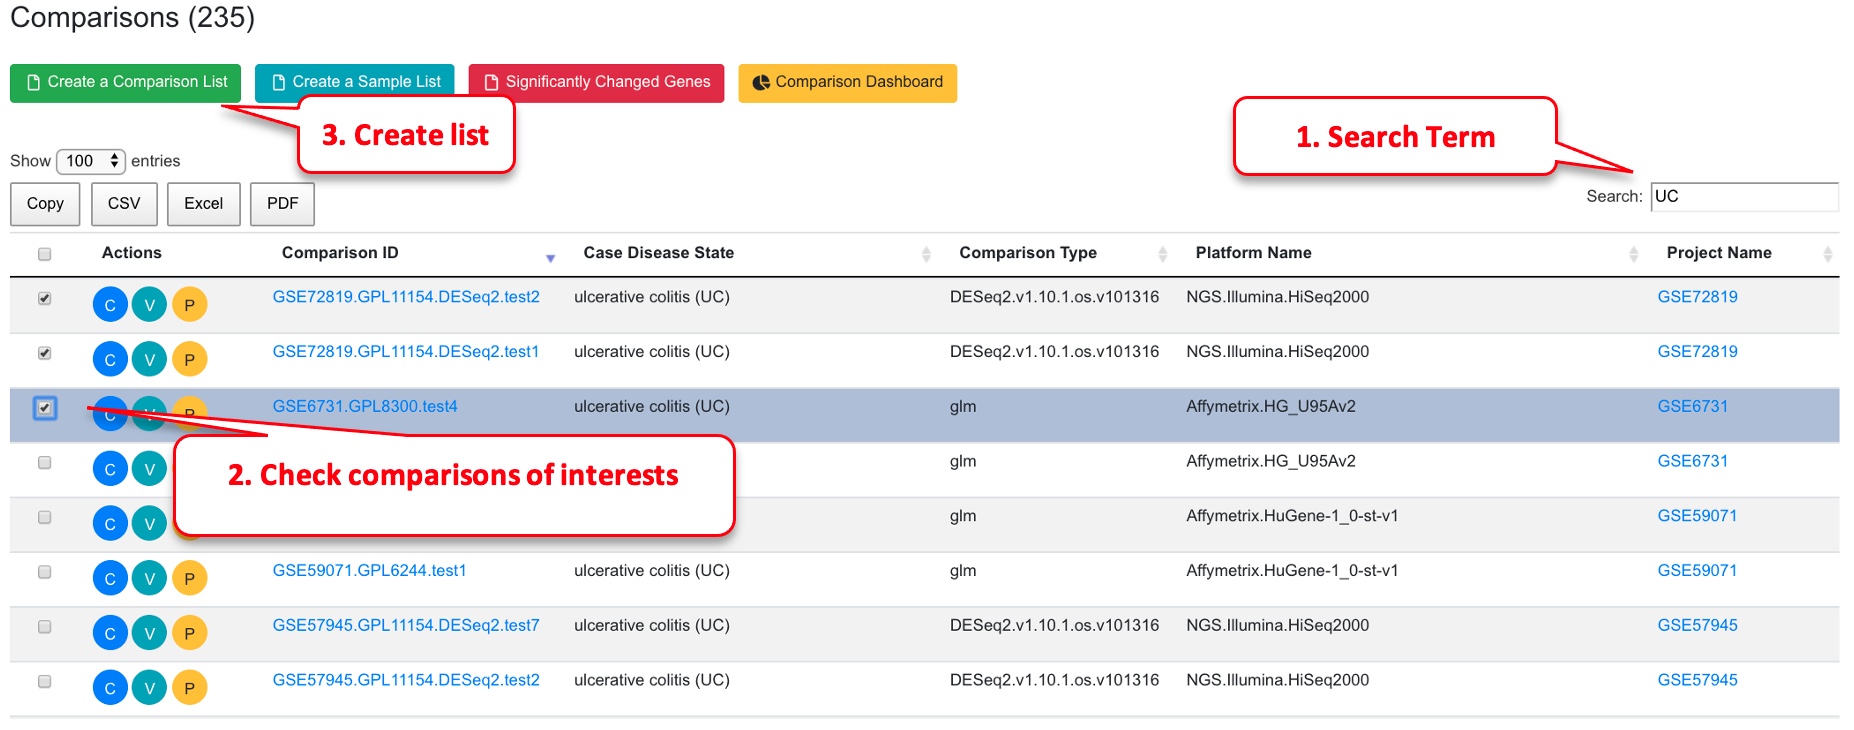
View full details of a comparison by clicking the “C” (Review Comparison) button. View volcano plot by clicking the “V” (View Volcano Chart) button. Users can also map the comparison data onto WikiPathways by clicking the “P” (View Pathway) button. The selected comparisons can be saved to your collection by creating a list using the “Create a Comparison List” button for easy loading into the plotting tools.
1.4 Genes
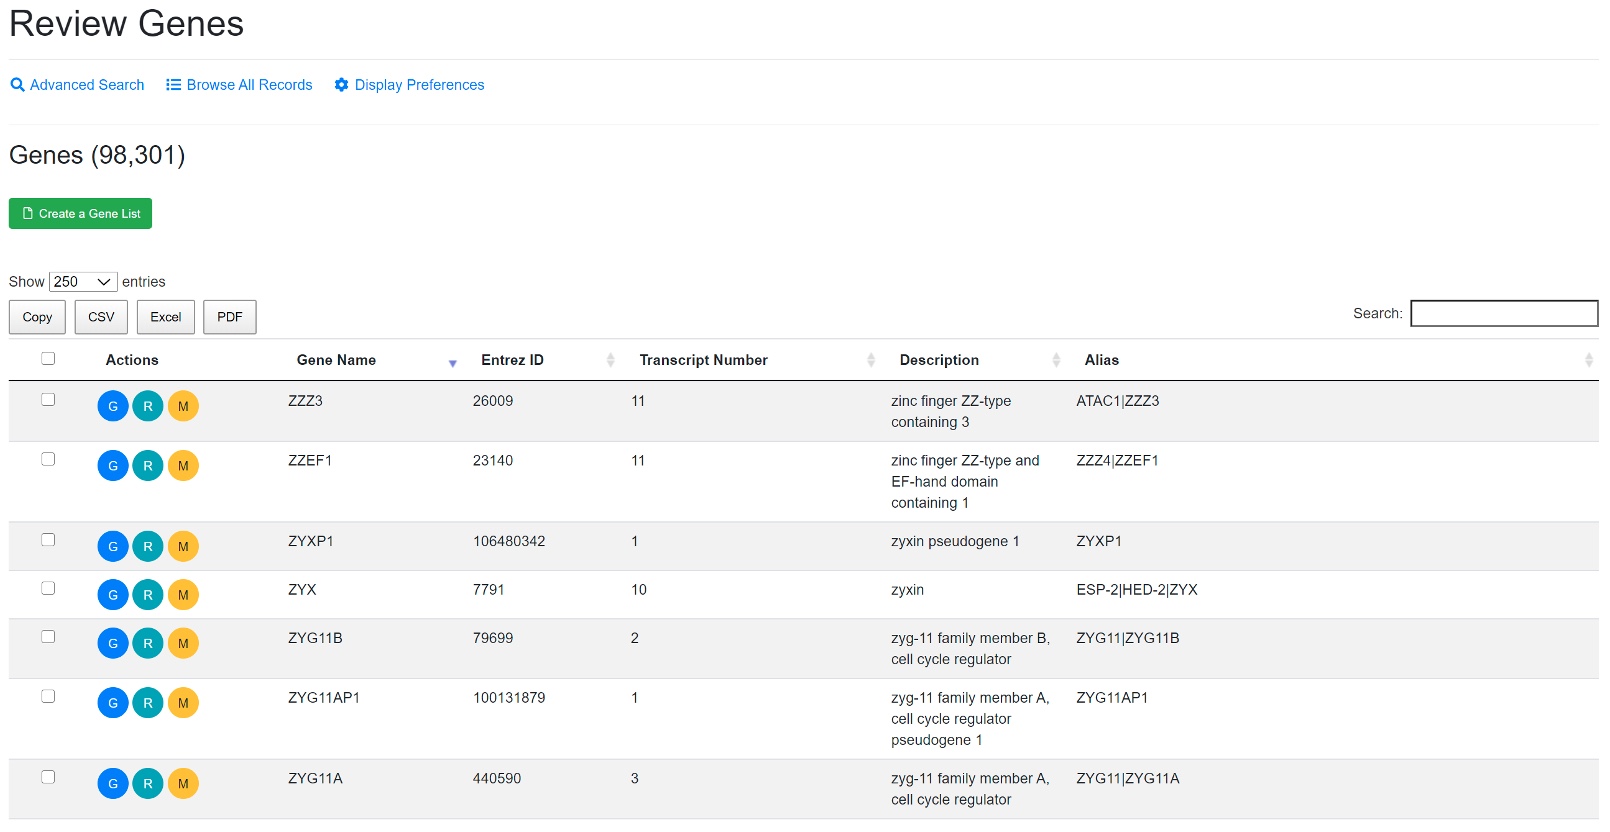
The genome-wide gene expression values were detected in each sample using RNA-Seq or microarrays. All the human genes that have expression values are listed in gene table. The gene annotation from different platforms were all mapped to NCBI gene ID (EntrezID) for consistency across platforms.
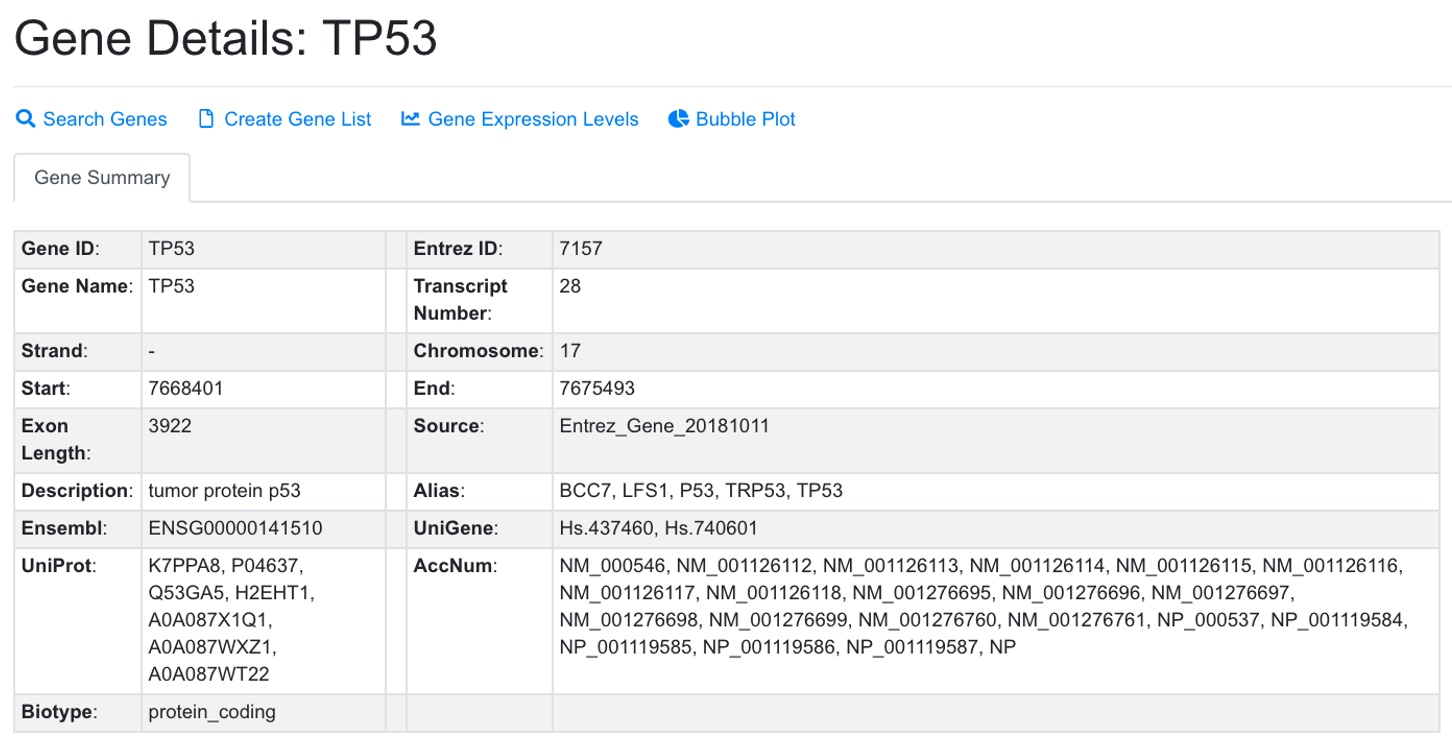
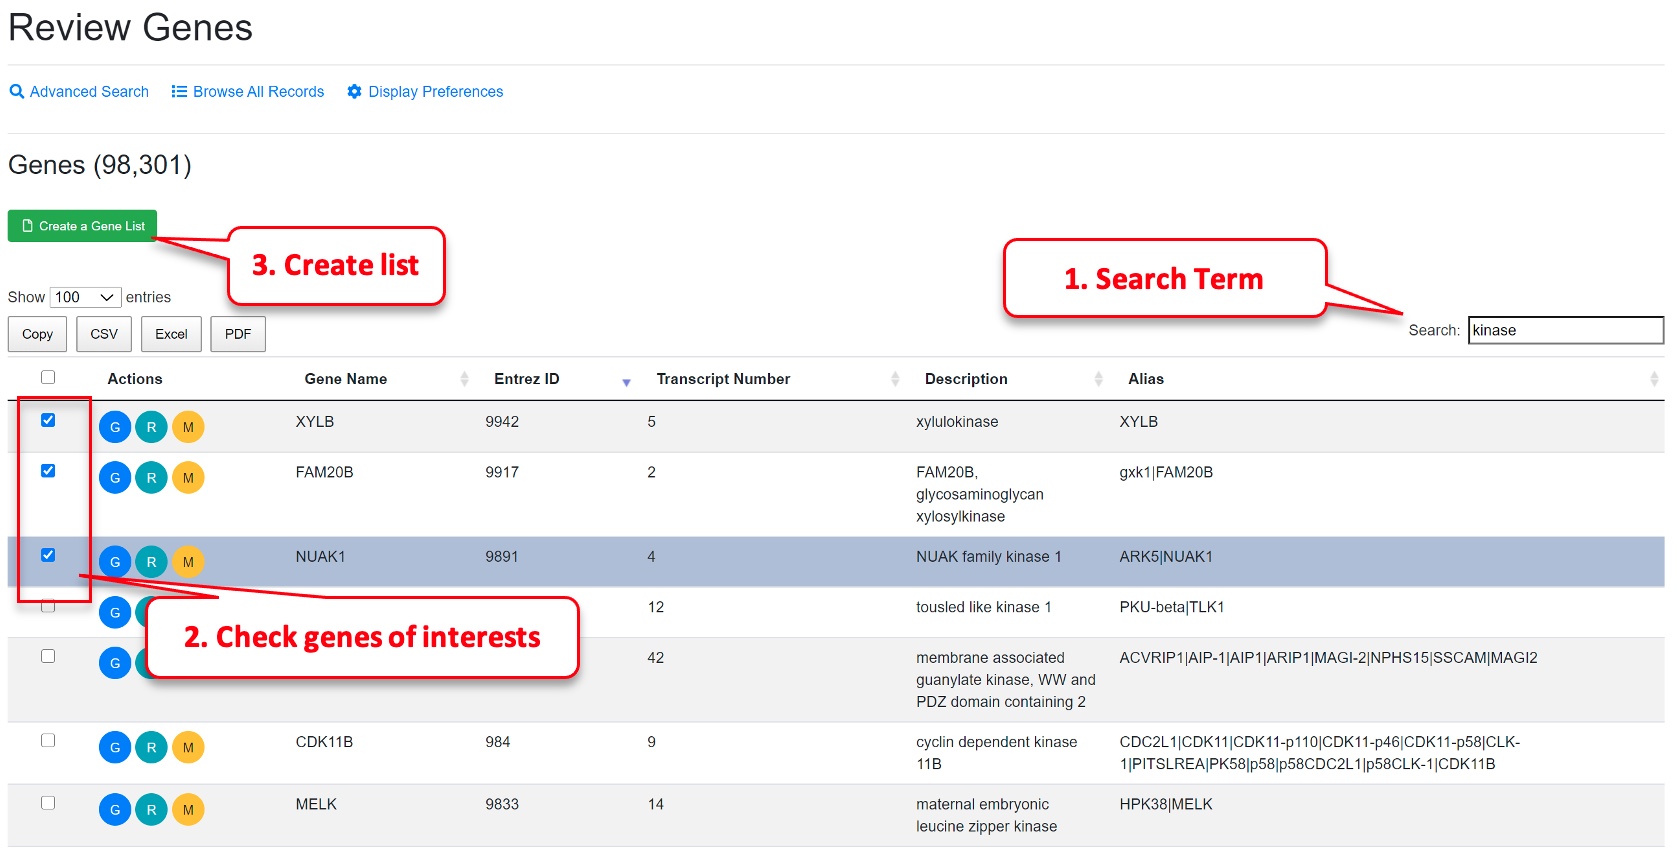
To find a gene, Users can specifically search in each field like gene symbol, gene description, gene alias, NCBI gene ID, Ensembl gene ID or Uniprot ID in the Advanced Search option. For some common genes, the symbols used in publications are often not the official symbol, and users can try search alias field in Advanced Search. For example, TP53 is often referred to as P53 in publication. Users need to search P53 in alias or tumor protein p53 in description to find it if you don’t know its official symbol. The NCBI Gene search https://www.ncbi.nlm.nih.gov/gene is a good source to get official gene symbols and IDs. Users can view full details of a gene by clicking the “G” (Review Gene) button.
From gene details, Users can access RNA-Seq data in a box plot or view all comparisons including this gene in a bubble plot.
1.5 Saved Genes and Comparisons
Users can save selected genes or comparison for future use (e.g., multiple gene and multiple comparisons bubble plot). From gene search, check the genes you want to save, and click the yellow button “save selected genes.”
Similarly, you can save comparisons.
To view saved genes, click “My Results” link on the left menu and then “Gene Lists.”
Similarly, to view the saved comparisons, select “Comparison Lists” under “My Results”:

