Chapter 5 Visium HD
10x Genomics Visium HD is a high-resolution spatial transcriptomics platform that captures the full transcriptome using thousands of gap-free, 2 μm squares. As one of the latest platforms that have the ability fo reach single-cell or even sub-cellular resolution, Visium HD enables researchers to discover new biology underlying certain conditions, and power the identification of disease-related biomarkers and potential therapeutic targets.
The Space Ranger pipeline from 10x Genomics can be used to process FASTQ raw data to gene expression matries. By default, the Space Ranger produces outputs at 3 resolutions: 2 μm, 8 μm, and 16 μm. We use 8 μm for the first-pass analysis, as it’s not too big or too small.
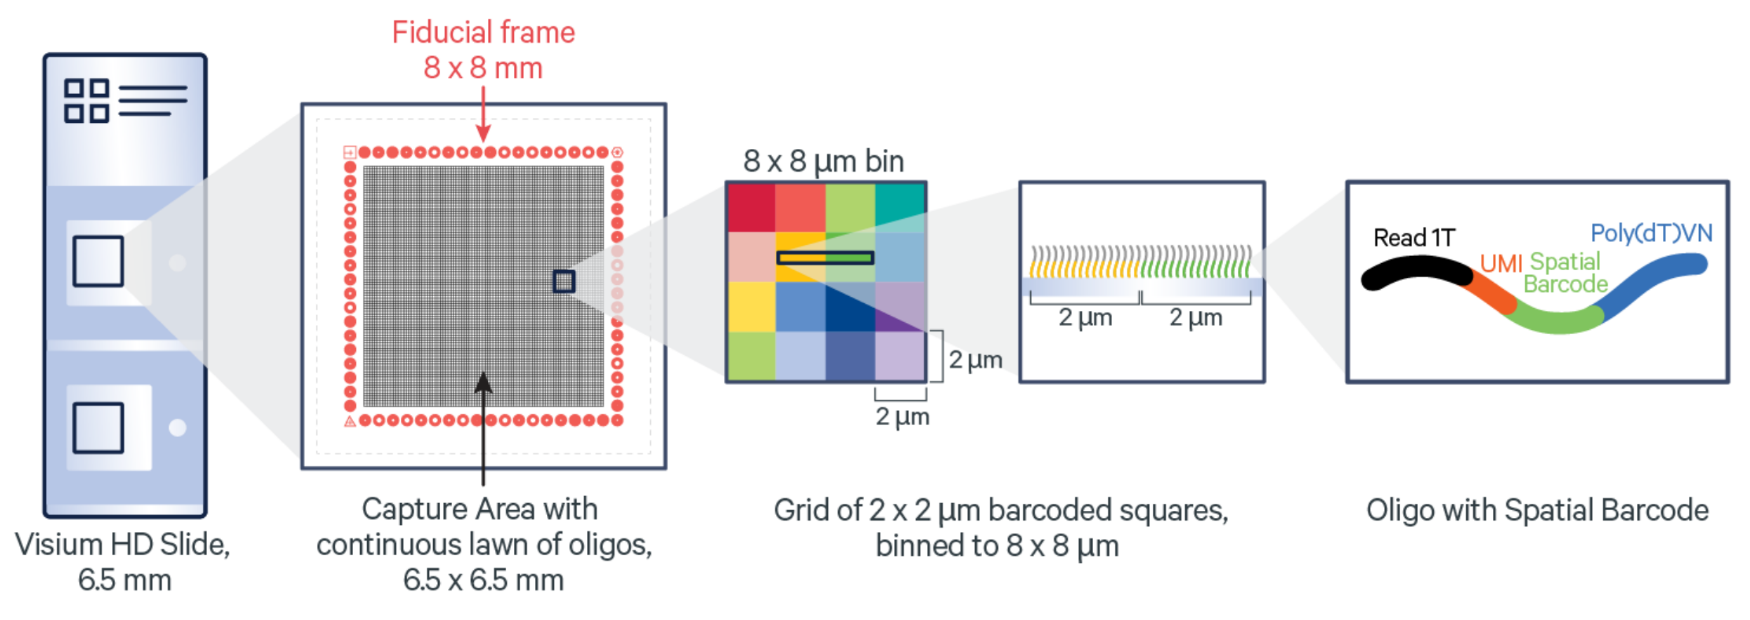
10x Genomics Visium HD slide and barcoded squares: As illustrated in the figure above, each 10x Genomics Visium HD slide has two captures (A1 and D1). The barcoded gap-free squares are 2 μm in size. (Image from: https://www.10xgenomics.com/)
5.1 Space Ranger run
The Space Ranger running step is very similar to Visium. Necessary files inclue Fastq path, reference directory, image, slide ID, slide location, etc. Here, we will use a public demo dataset to guide you through these steps.
The two public demo datasets are from the 10x Genomics website.
A typical Space Ranger run command for Visium HD:
spaceranger count --id="Sample1_FFPE" \
    --transcriptome=~/Data/Reference_files/refdata-gex-mm10-2020-A \
    --fastqs=~/Data/Fastq_files \
    --cytaimage=~/Data/Sample1_FFPE.tif \
    --probe-set=~/Data/Reference_files/Visium_Mouse_Transcriptome_Probe_Set_v2.0_mm10-2020-A.csv \
    --slide=H1-ABDCEFJ \    #Using a random slide ID for illustration
    --area=D1 \
    --localcores=4 \
    --localmem=256 \
    --create-bam=false
The above command was run in the SpaceRanger folder as shown below. This will generate the Space Ranger result directories that can be used to run SpaceSequest.
Here, we can skip the Space Ranger run because 10x Genomics website has provided Space Ranger results, so we can directly download and use them. SpaceSequest workflow requires a directory containing both binned_outputs and spatial folders.
~/SpaceSequest_demo/2_VisiumHD/
  ├── Input_data/
    └── Demo_PSAPP.3Rep.Azimuth.Reference.h5ad  #Downloaded from Azimuth website
  └── SpaceRanger/
    ├── Sample1_FFPE/
      ├── ...
      └── out/
        ├── ...
        ├── cloupe_008um.cloupe
        ├── web_summary.html
        ├── binned_outputs/
          ├── square_002um/
          ├── square_008um/
          └── square_016um/
        └── spatial/
          ├── aligned_fiducials.jpg
          ├── aligned_tissue_image.jpg
          ├── cytassist_image.tiff
          ├── detected_tissue_image.jpg
          ├── tissue_hires_image.png
          └── tissue_lowres_image.png
    └── Sample2_Fixed/
      ├── ...
      └── out/
        ├── ...
        ├── cloupe_008um.cloupe
        ├── web_summary.html
        ├── binned_outputs/
          ├── square_002um/
          ├── square_008um/
          └── square_016um/
        └── spatial/
5.2 Pipeline setup
To illustrate the pipeline setup steps, we set the running directory to be: ~/SpaceSequest_demo/2_VisiumHD/
As the above step showed, we need to place the result folders (binned_outputs, spatial) inside each data folders (out folder under Sample1_FFPE and Sample2_Fixed).
The first step is to generate the config and sampleMeta files by running the visiumhd command by passing the working directory to it.
visiumhd ~/SpaceSequest_demo/2_VisiumHDAfter this step, fill in the config.yml file and the sampleMeta.csv file as below.
project_ID: VisiumHD_demo                                      #required

sampleMeta: ~/SpaceSequest_demo/2_VisiumHD/sampleMeta.csv      #path to the sampleMeta file

output_dir: ~/SpaceSequest_demo/2_VisiumHD/output              #output directory

bin_resolution: 8um                                            #defaul 8um, also 16um or 2um are available

cluster_resolution: 0.3                                        #resolution for the FindClusters step

reference: ~/SpaceSequest_demo/2_VisiumHD/Reference/allen_mop_2020.rds  #path to an Azimuth reference data, optional

reference_name: subclass                                       #column name of the cell type label you would like to transfer

integrate_data: True                                           #True or False to merge/integrate all the data in the sampleMeta file

integrate_with_harmony: True                                   #True or False to use Harmony for integration. Default as True
The sampleMeta.csv file contains file name and path to the Space Ranger output. It needs to have the binned_outputs inside.
The first column sets the sample names for the final output files.
Sample,Directory

Mouse_brain_FFPE,~/SpaceSequest_demo/2_VisiumHD/Sample1_FFPE/outs

Mouse_brain_FixedFrozen,~/SpaceSequest_demo/2_VisiumHD/Sample2_Fixed/outs
Finally submit the following command:
#Run the data

visiumhd ~/SpaceSequest_demo/2_VisiumHD/config.yml
Finally check the results in the output_dir folder specified in the config.yml file. The output files contain several figures (QC plots, UMAP), and multiple Rdata files storing the results.
5.3 Results
The output directory contains processing results for each individual data, as well as integrated dataset, if the integrate_data parameter was set to True.
Main results in the directory:
~/SpaceSequest_demo/2_VisiumHD
  #For Mouse_brain_FFPE
  ├── ...
  ├── VisiumHD_demo.Mouse_brain_FFPE.RData
  ├── VisiumHD_demo.Mouse_brain_FFPE.plot.count_feature.png
  ├── VisiumHD_demo.Mouse_brain_FFPE.plot.counts.png
  ├── VisiumHD_demo.Mouse_brain_FFPE.plot.Spatial.annotated_cluster.png
  ├── VisiumHD_demo.Mouse_brain_FFPE.plot.Spatial.cluster.png
  ├── VisiumHD_demo.Mouse_brain_FFPE.plot.UMAP.full.png
  └── VisiumHD_demo.Mouse_brain_FFPE.plot.UMAP.sketch.png

  #For Mouse_brain_FFPE
  ├── ...
  ├── VisiumHD_demo.Mouse_brain_FixedFrozen.RData
  ├── VisiumHD_demo.Mouse_brain_FixedFrozen.plot.count_feature.png
  ├── VisiumHD_demo.Mouse_brain_FixedFrozen.plot.counts.png
  ├── VisiumHD_demo.Mouse_brain_FixedFrozen.plot.Spatial.annotated_cluster.png
  ├── VisiumHD_demo.Mouse_brain_FixedFrozen.plot.Spatial.cluster.png
  ├── VisiumHD_demo.Mouse_brain_FixedFrozen.plot.UMAP.full.png
  └── VisiumHD_demo.Mouse_brain_FixedFrozen.plot.UMAP.sketch.png

  #Integrated results
  ├── ...
  ├── VisiumHD_demo.integrated.RData
  ├── VisiumHD_demo.integrated.plot.UMAP.annotated.full.png
  ├── VisiumHD_demo.integrated.plot.UMAP.dataset.full.png
  ├── VisiumHD_demo.integrated.plot.UMAP.original_cluster.full.png
  └── VisiumHD_demo.integrated.plot.UMAP.original_cluster.sketch.png
Some example figures:
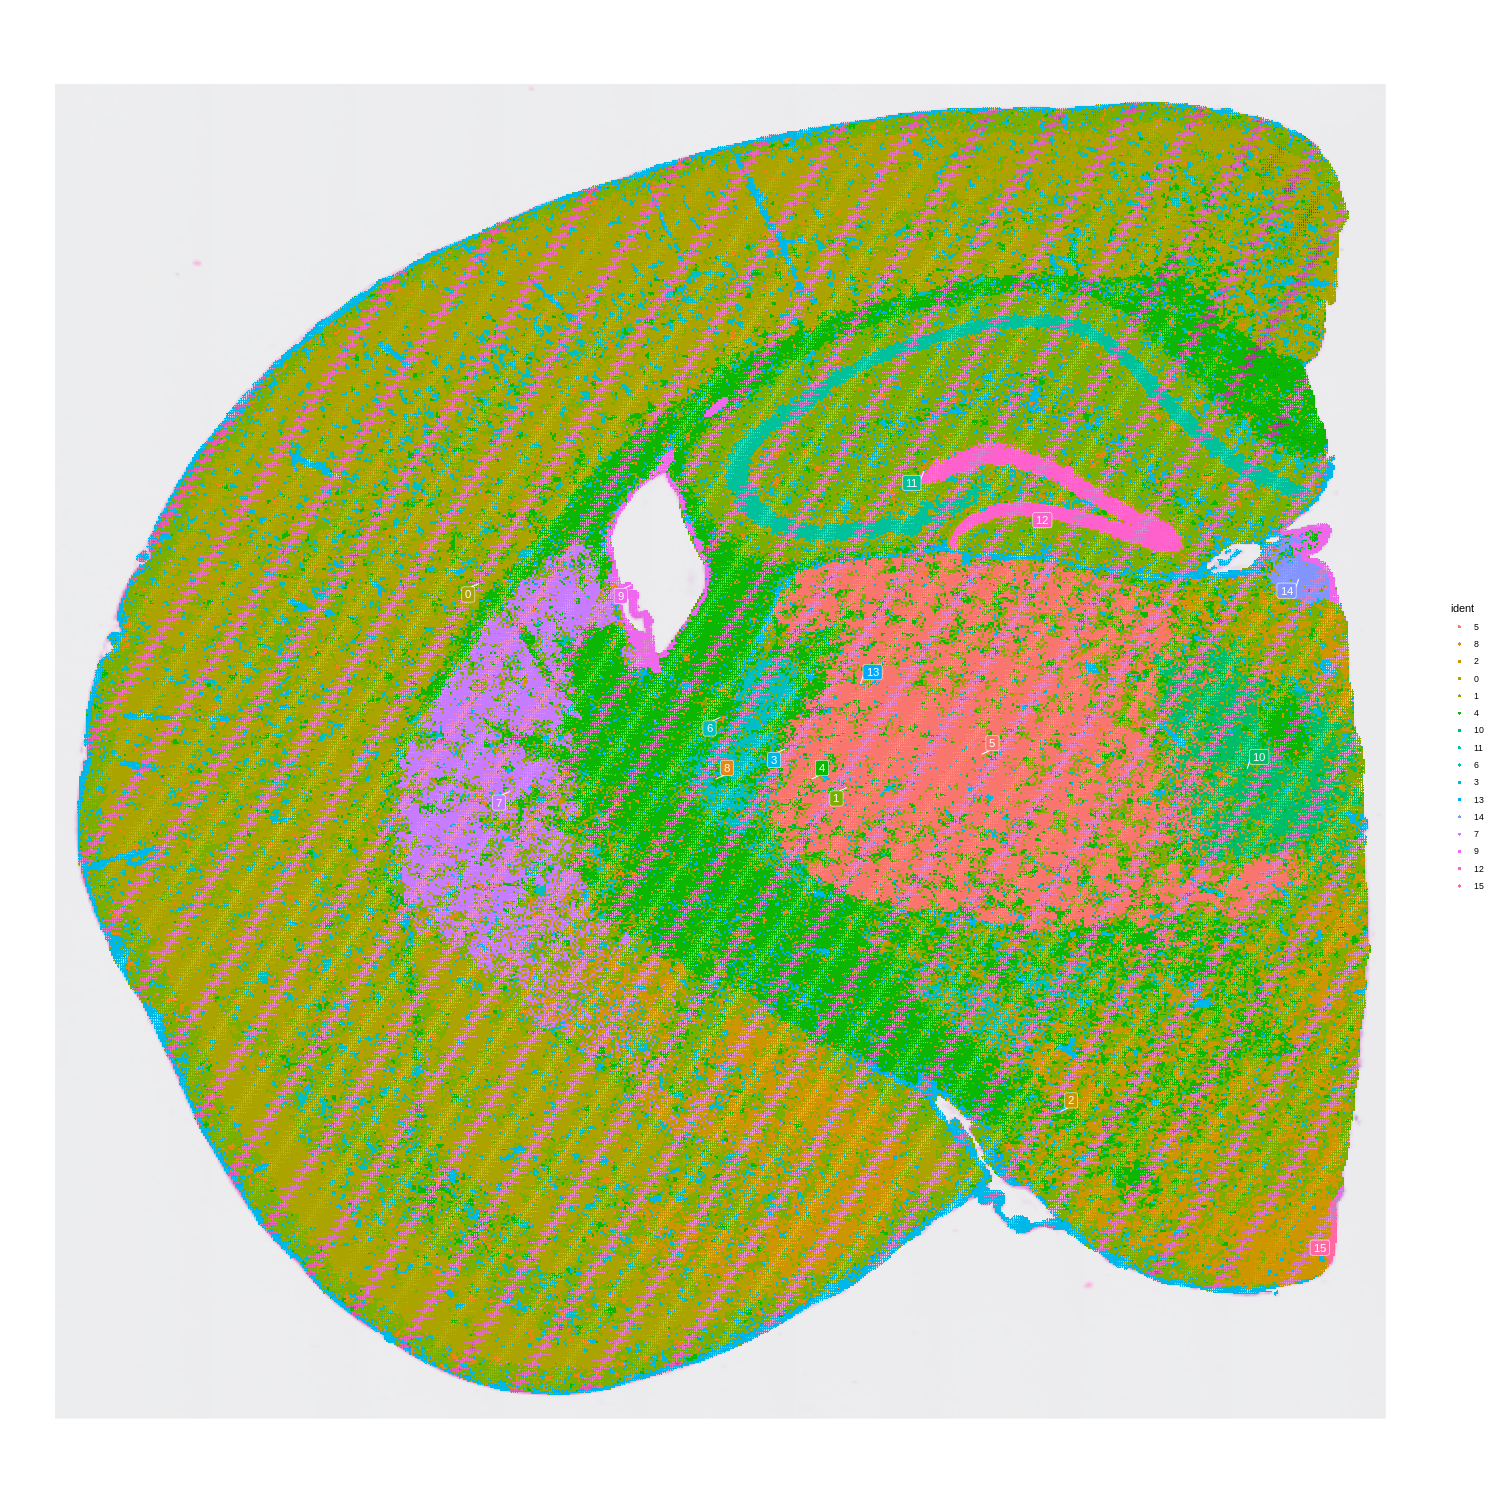
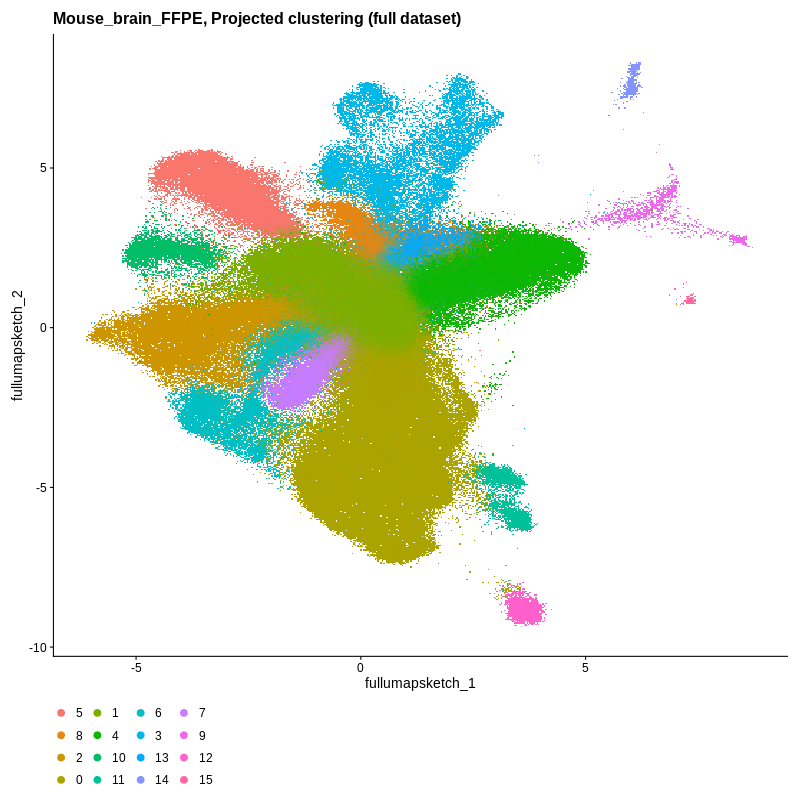
Visium HD spatial-transcriptomics output. (Left) Tissue image with capture spots overlaid. (Right) UMAP embedding of spatial barcodes colored by cluster.
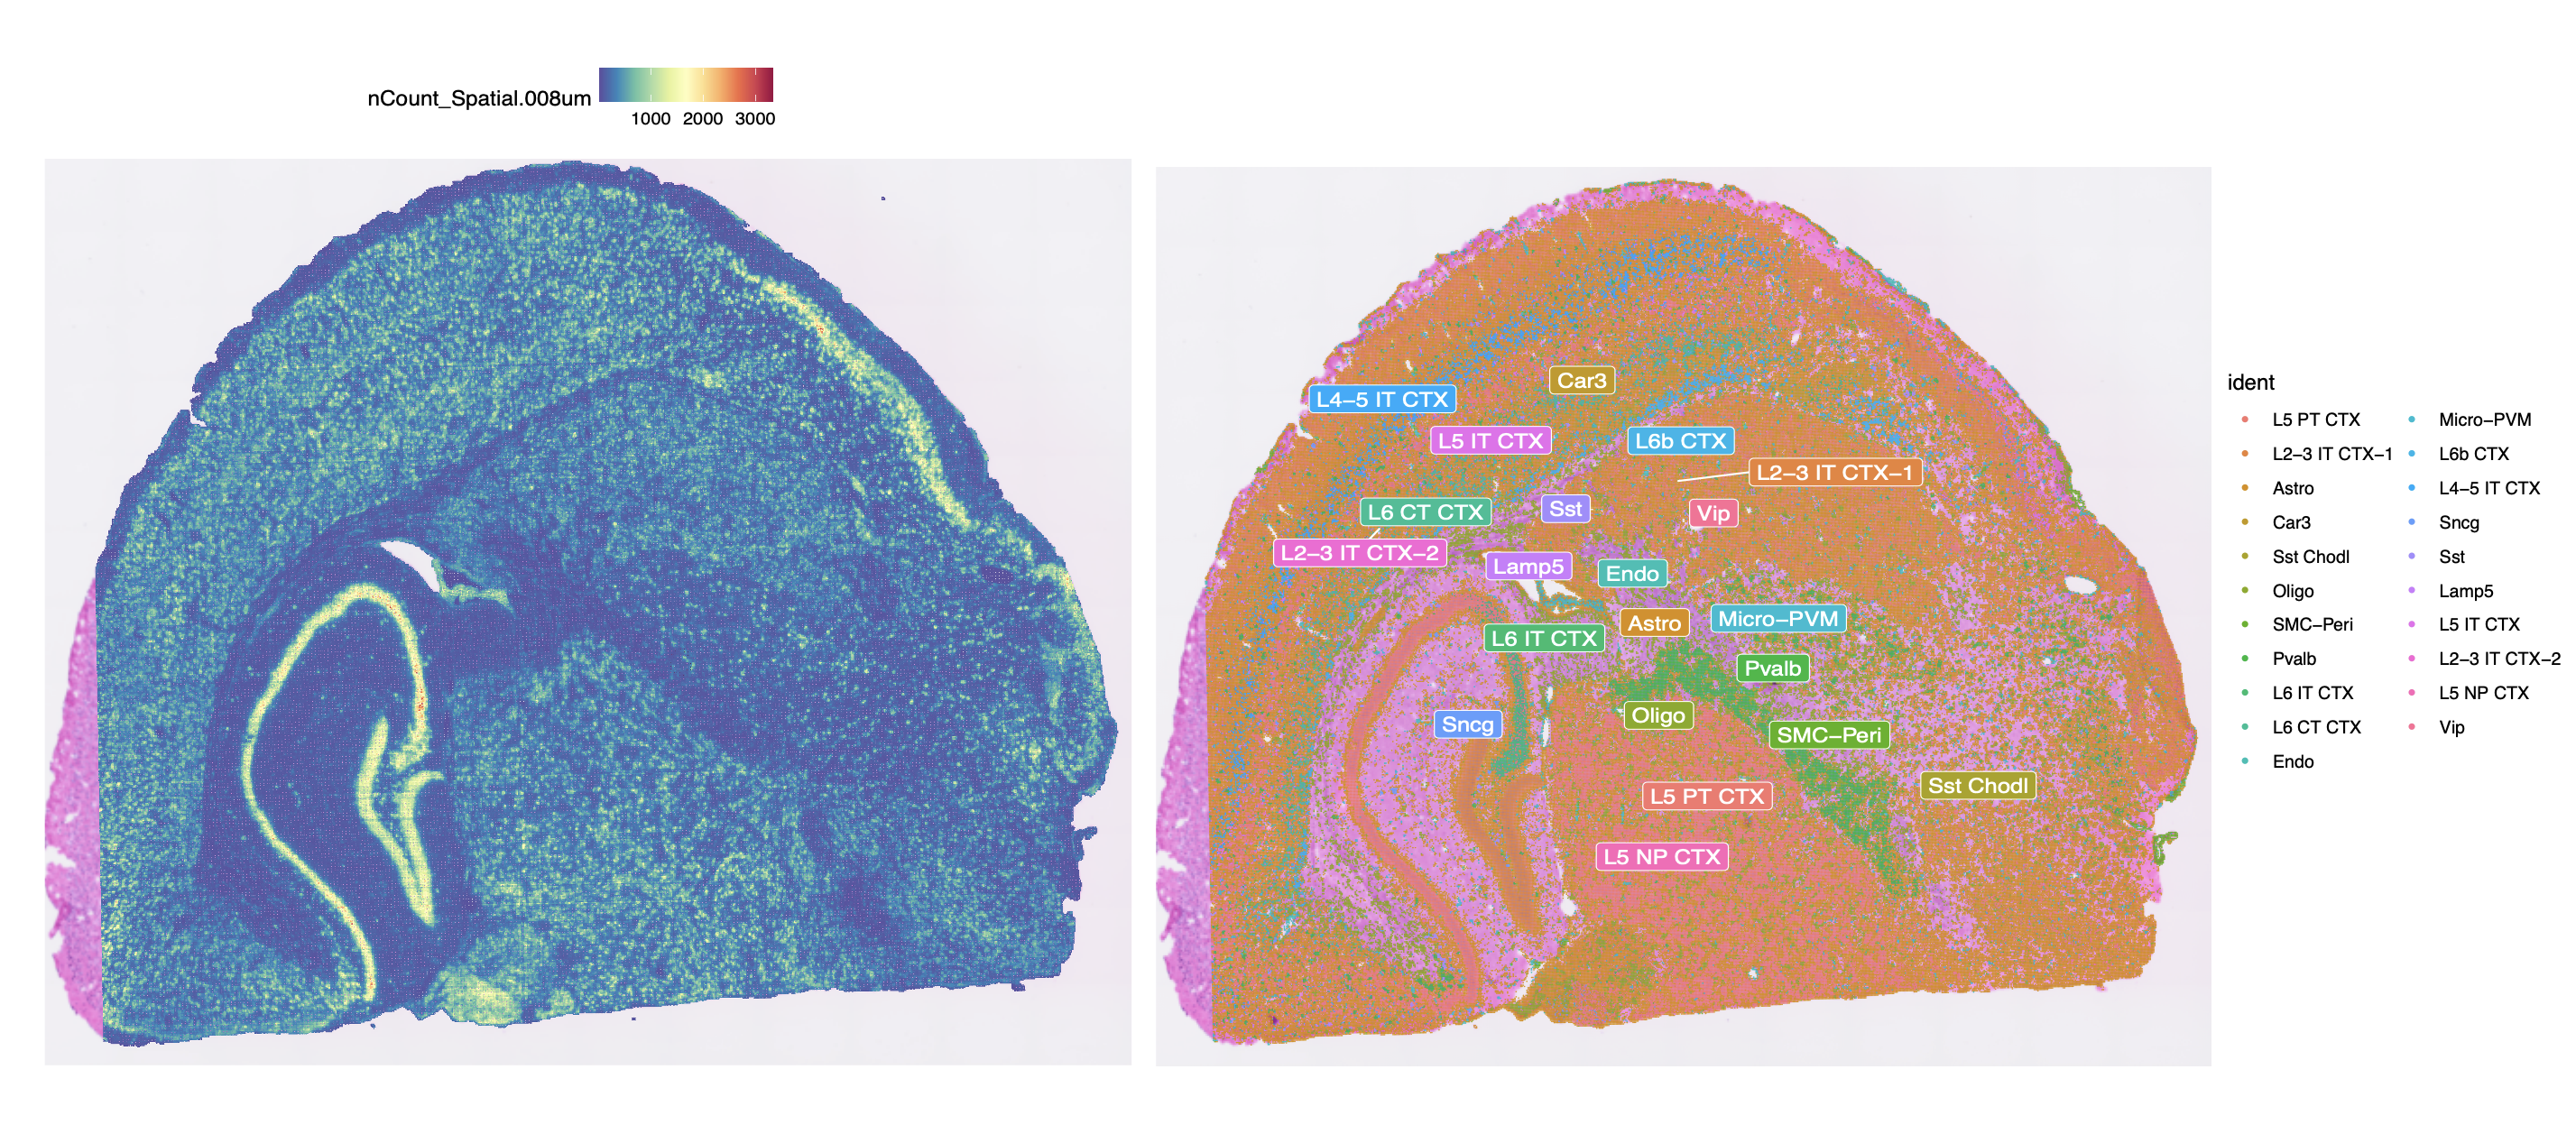
Additional Visium HD results. (Left) Gene expression counts (nCount) at 8 μm resolution. (Right) Cell type annotation on the spatial tissue.