Chapter 1 QC plots
Quality control (QC) is of single-cell RNA-Seq experiment is critical to downstream analyses. In this section, we present a series of QC plots for better understanding of data quality.
Please be aware that these figures were generated based on the metrics_summary.csv files associated with each sample. For the processed data directly downloaded from NCBI/GEO or EBI, they may not have these information, and thus no QC plots will be generated here.
In total there are 19 figures showing different aspects of the data. These plots can be further grouped into the following categories:
General QC
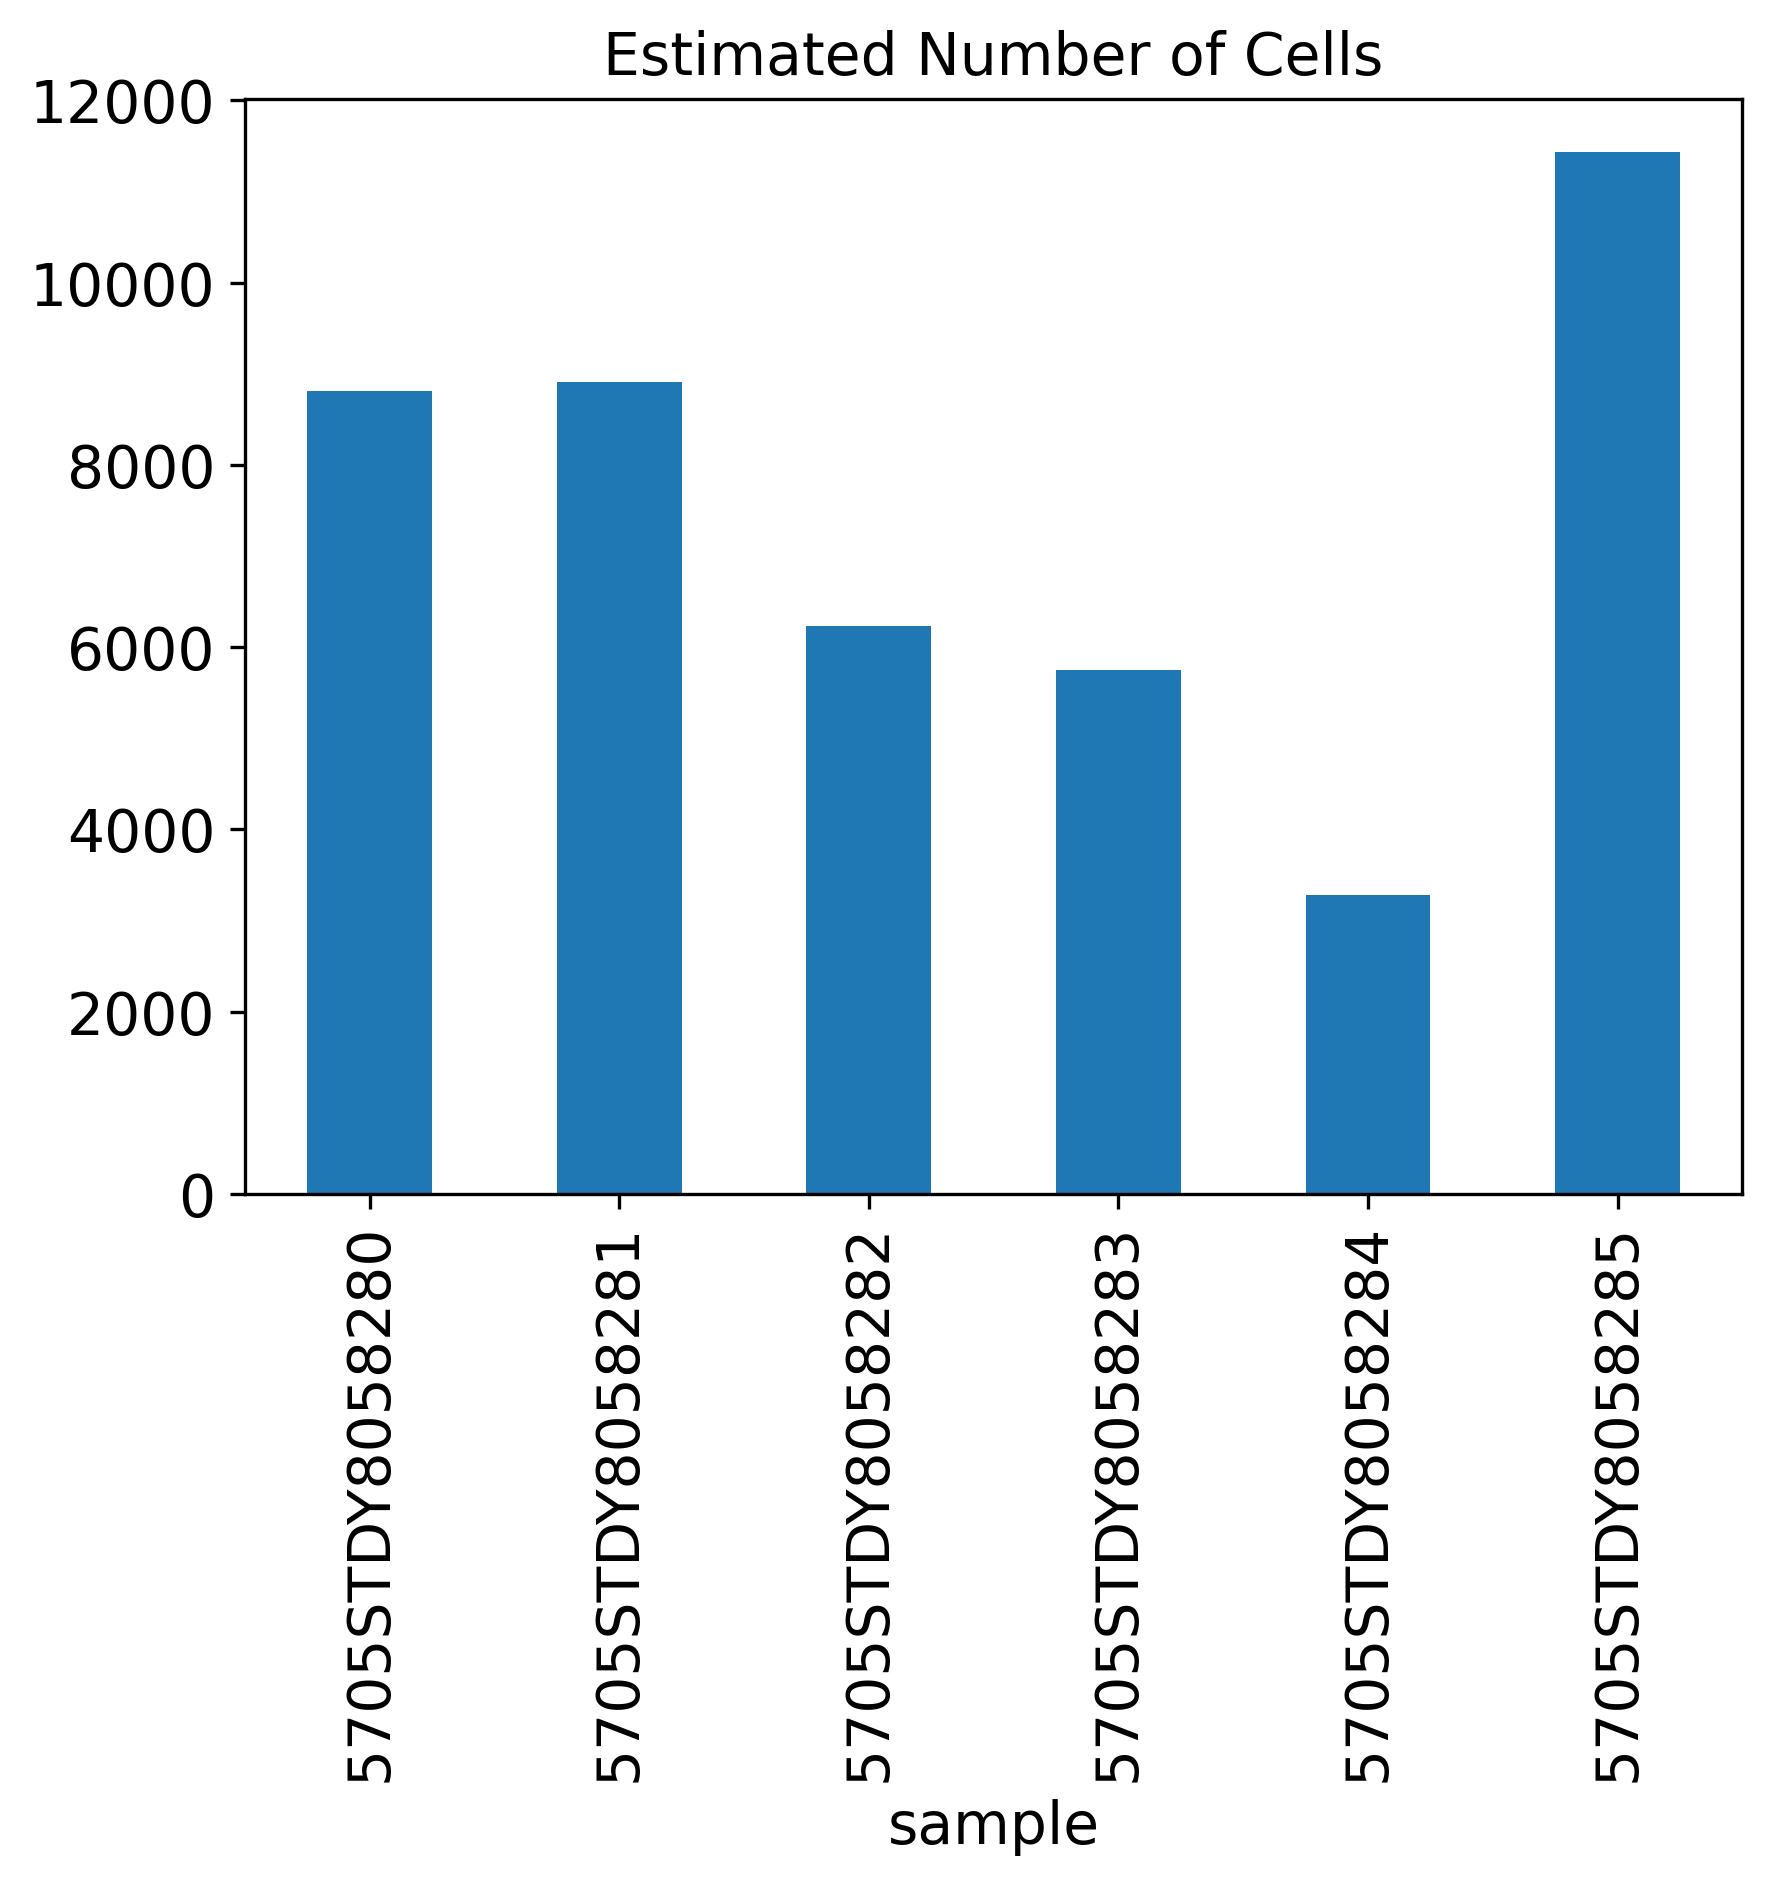
Estimated Number of Cells
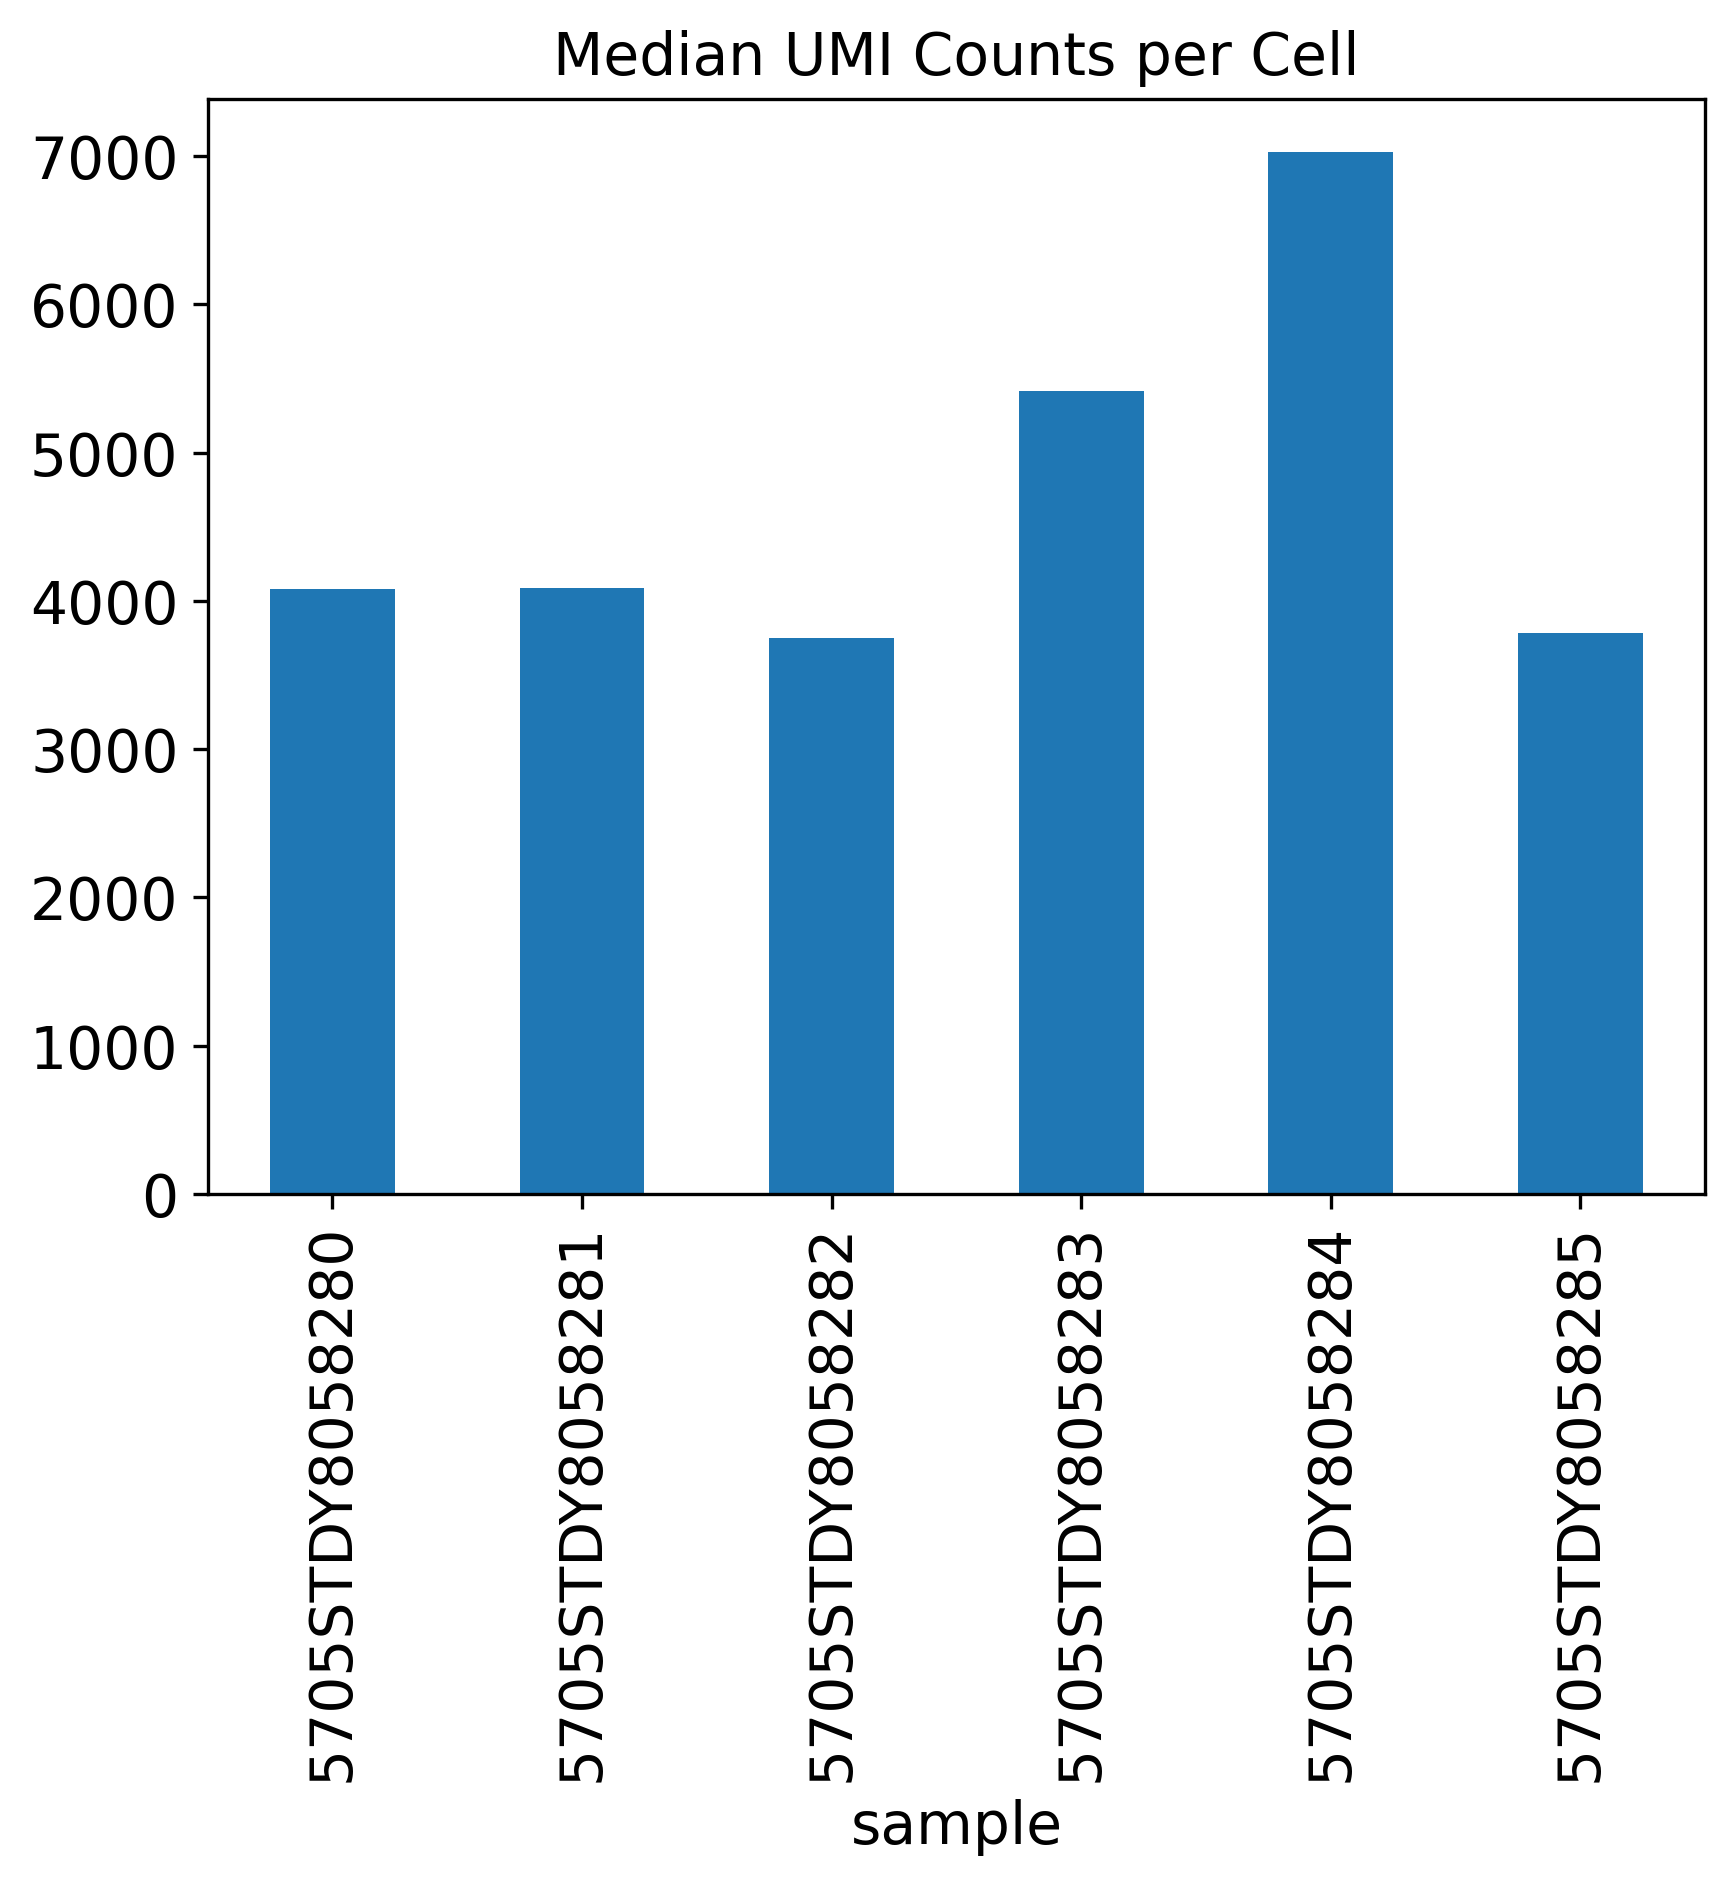
Median UMI Counts per Cell
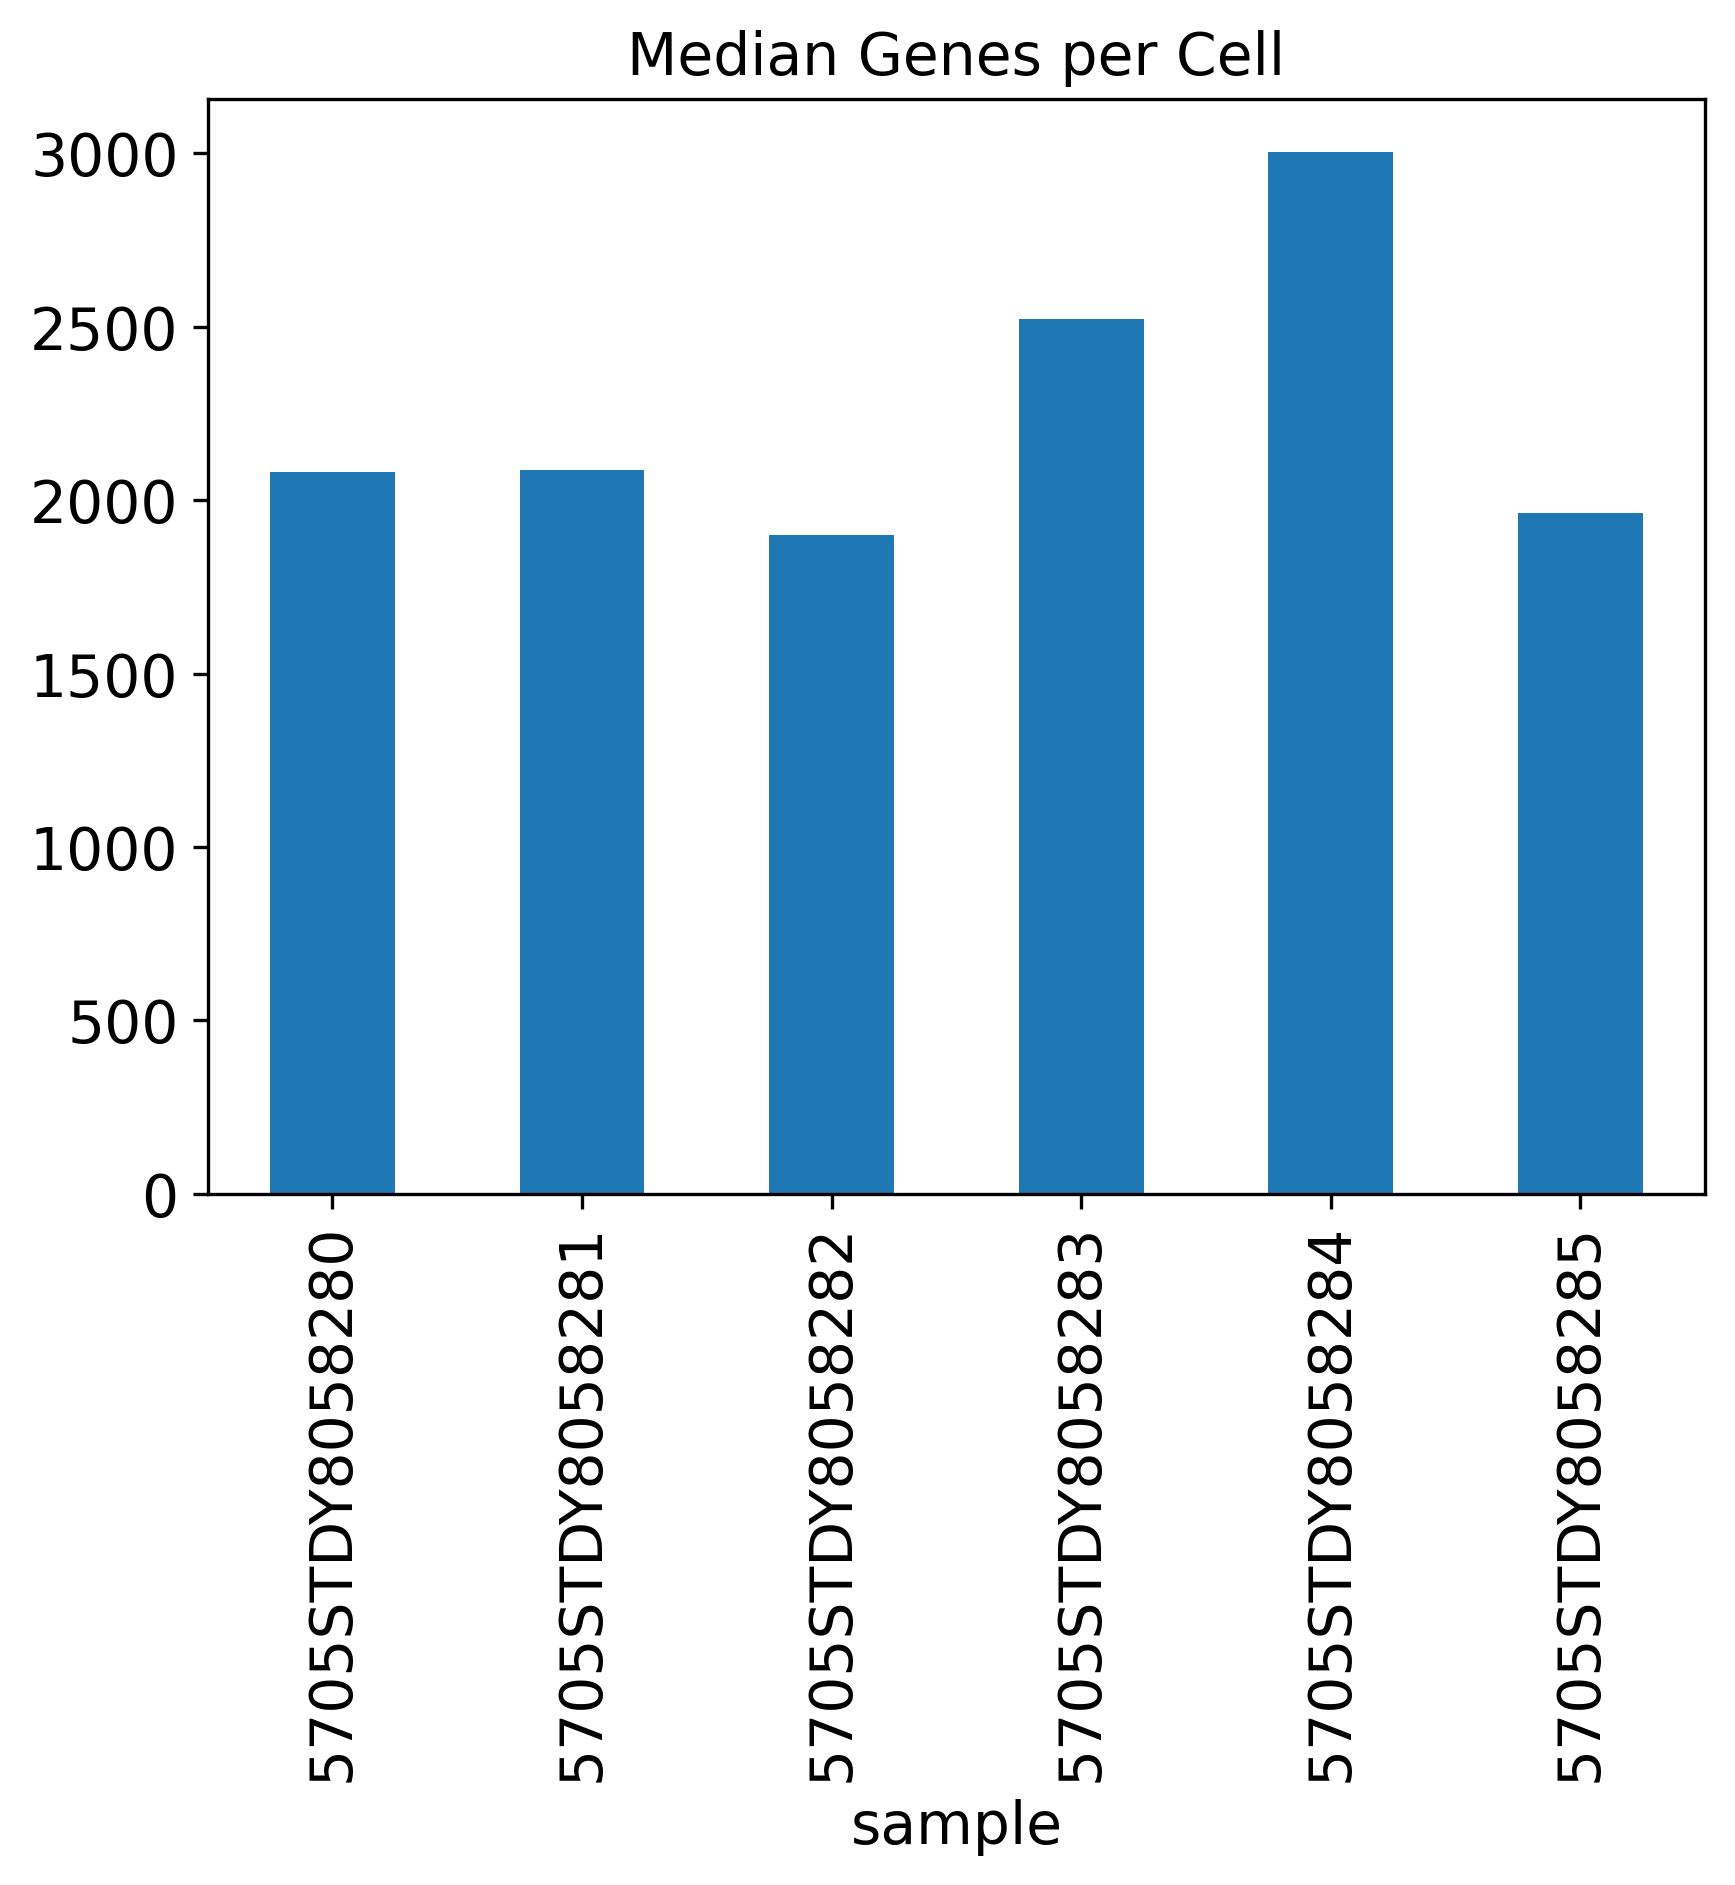
Median Genes per Cell
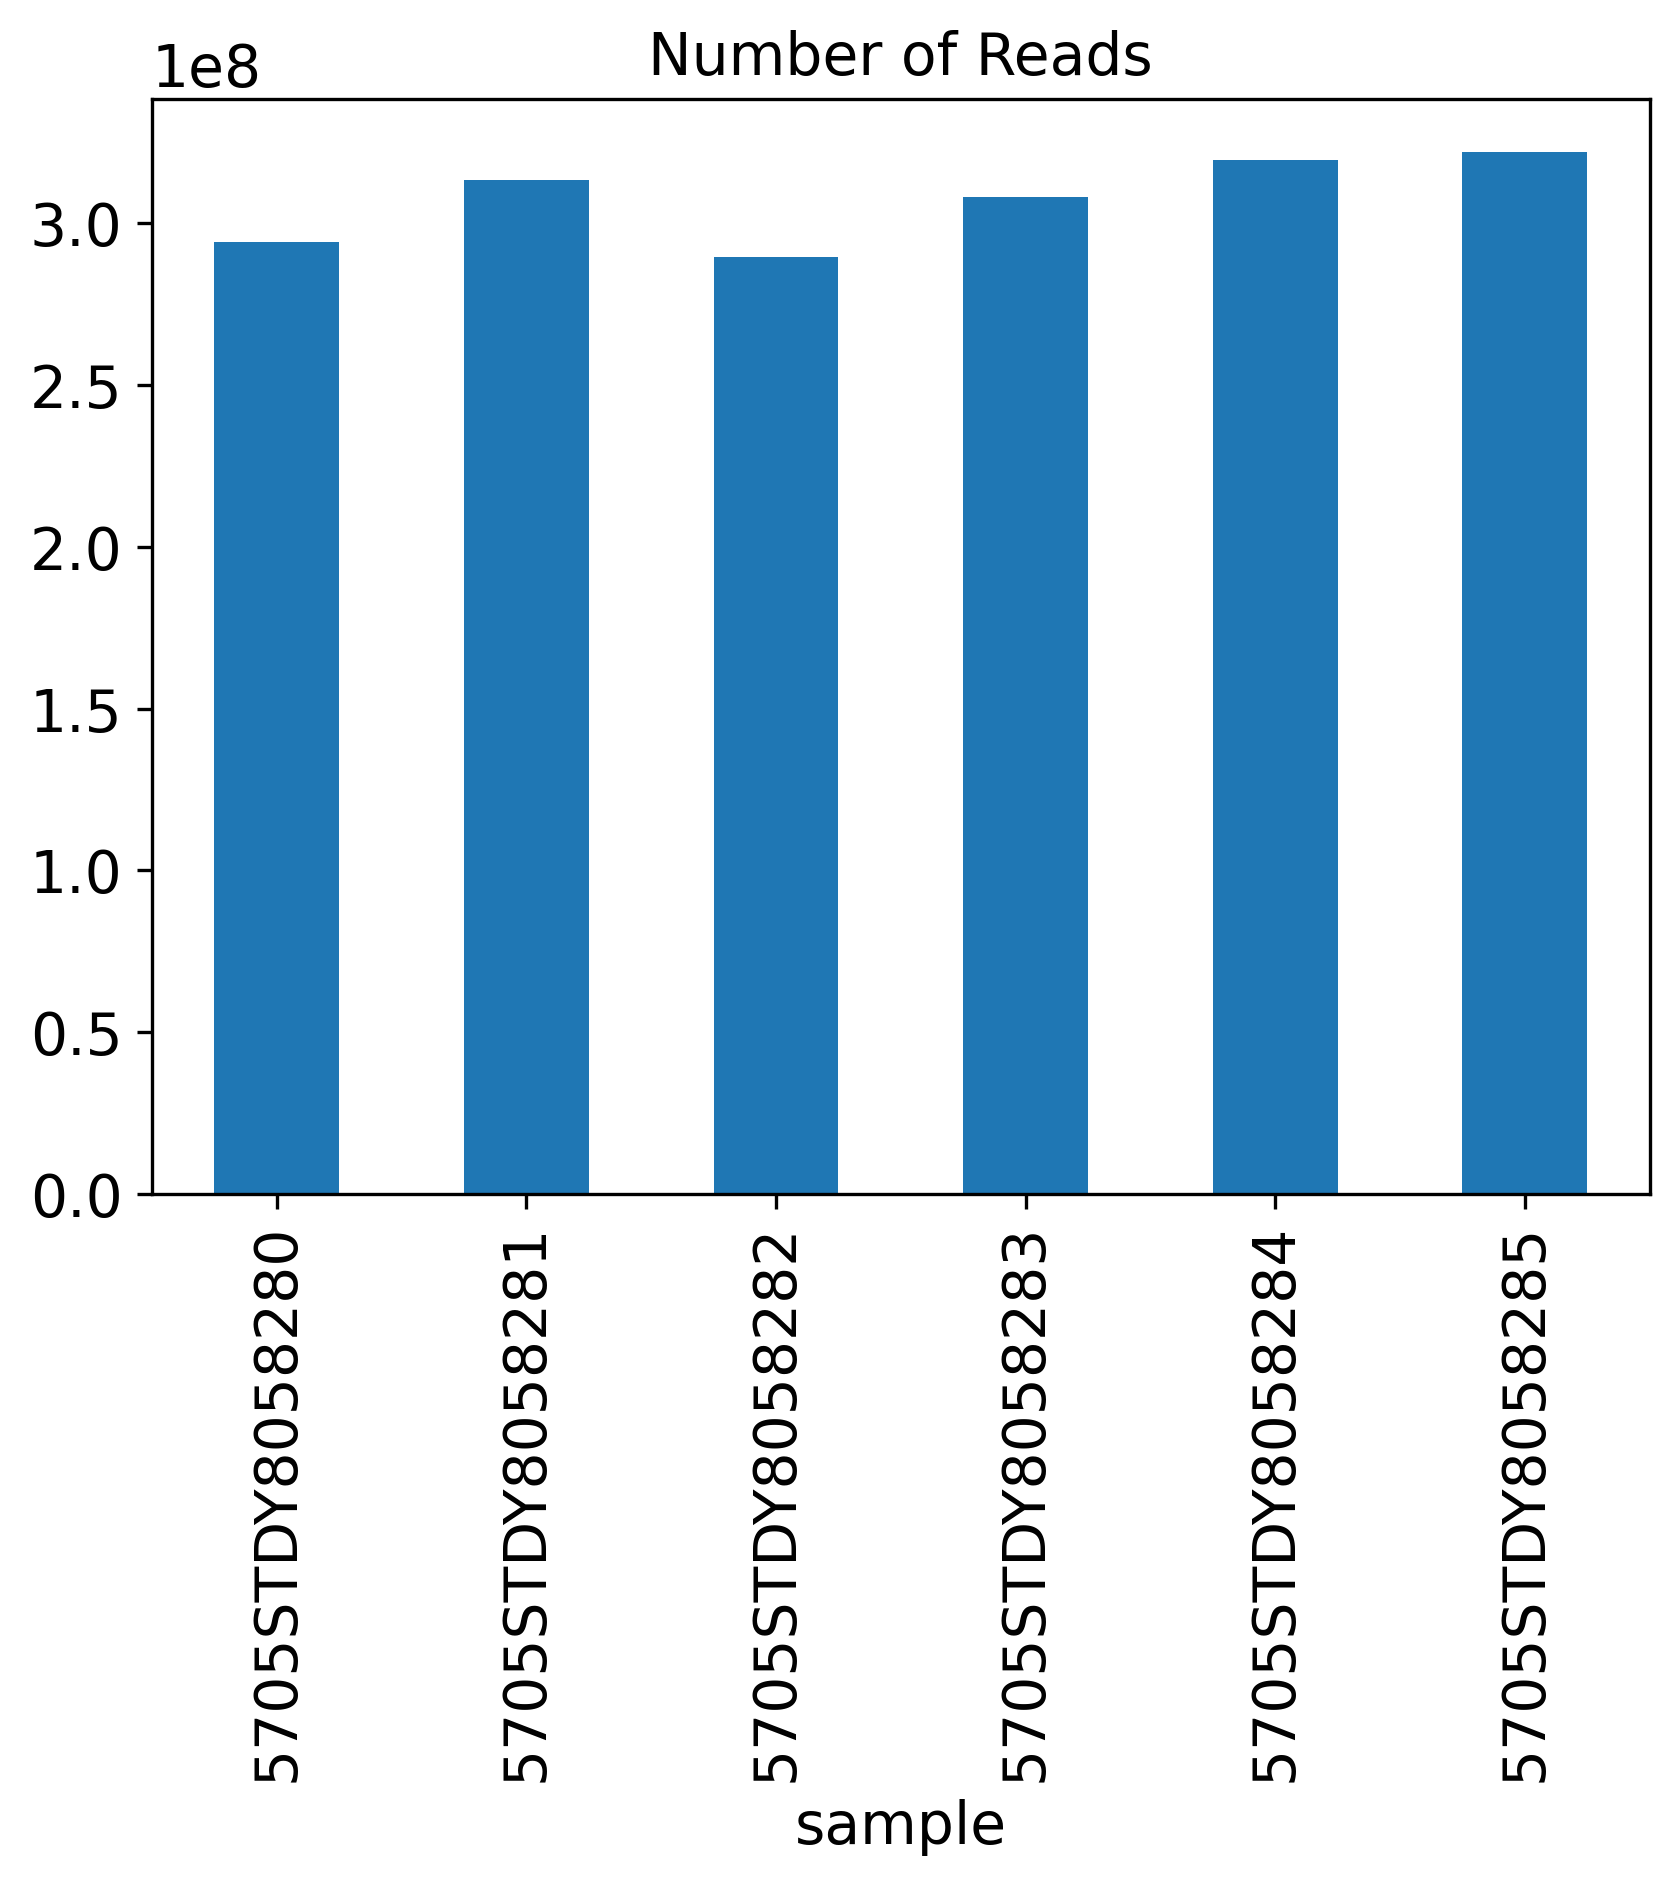
Number of Reads
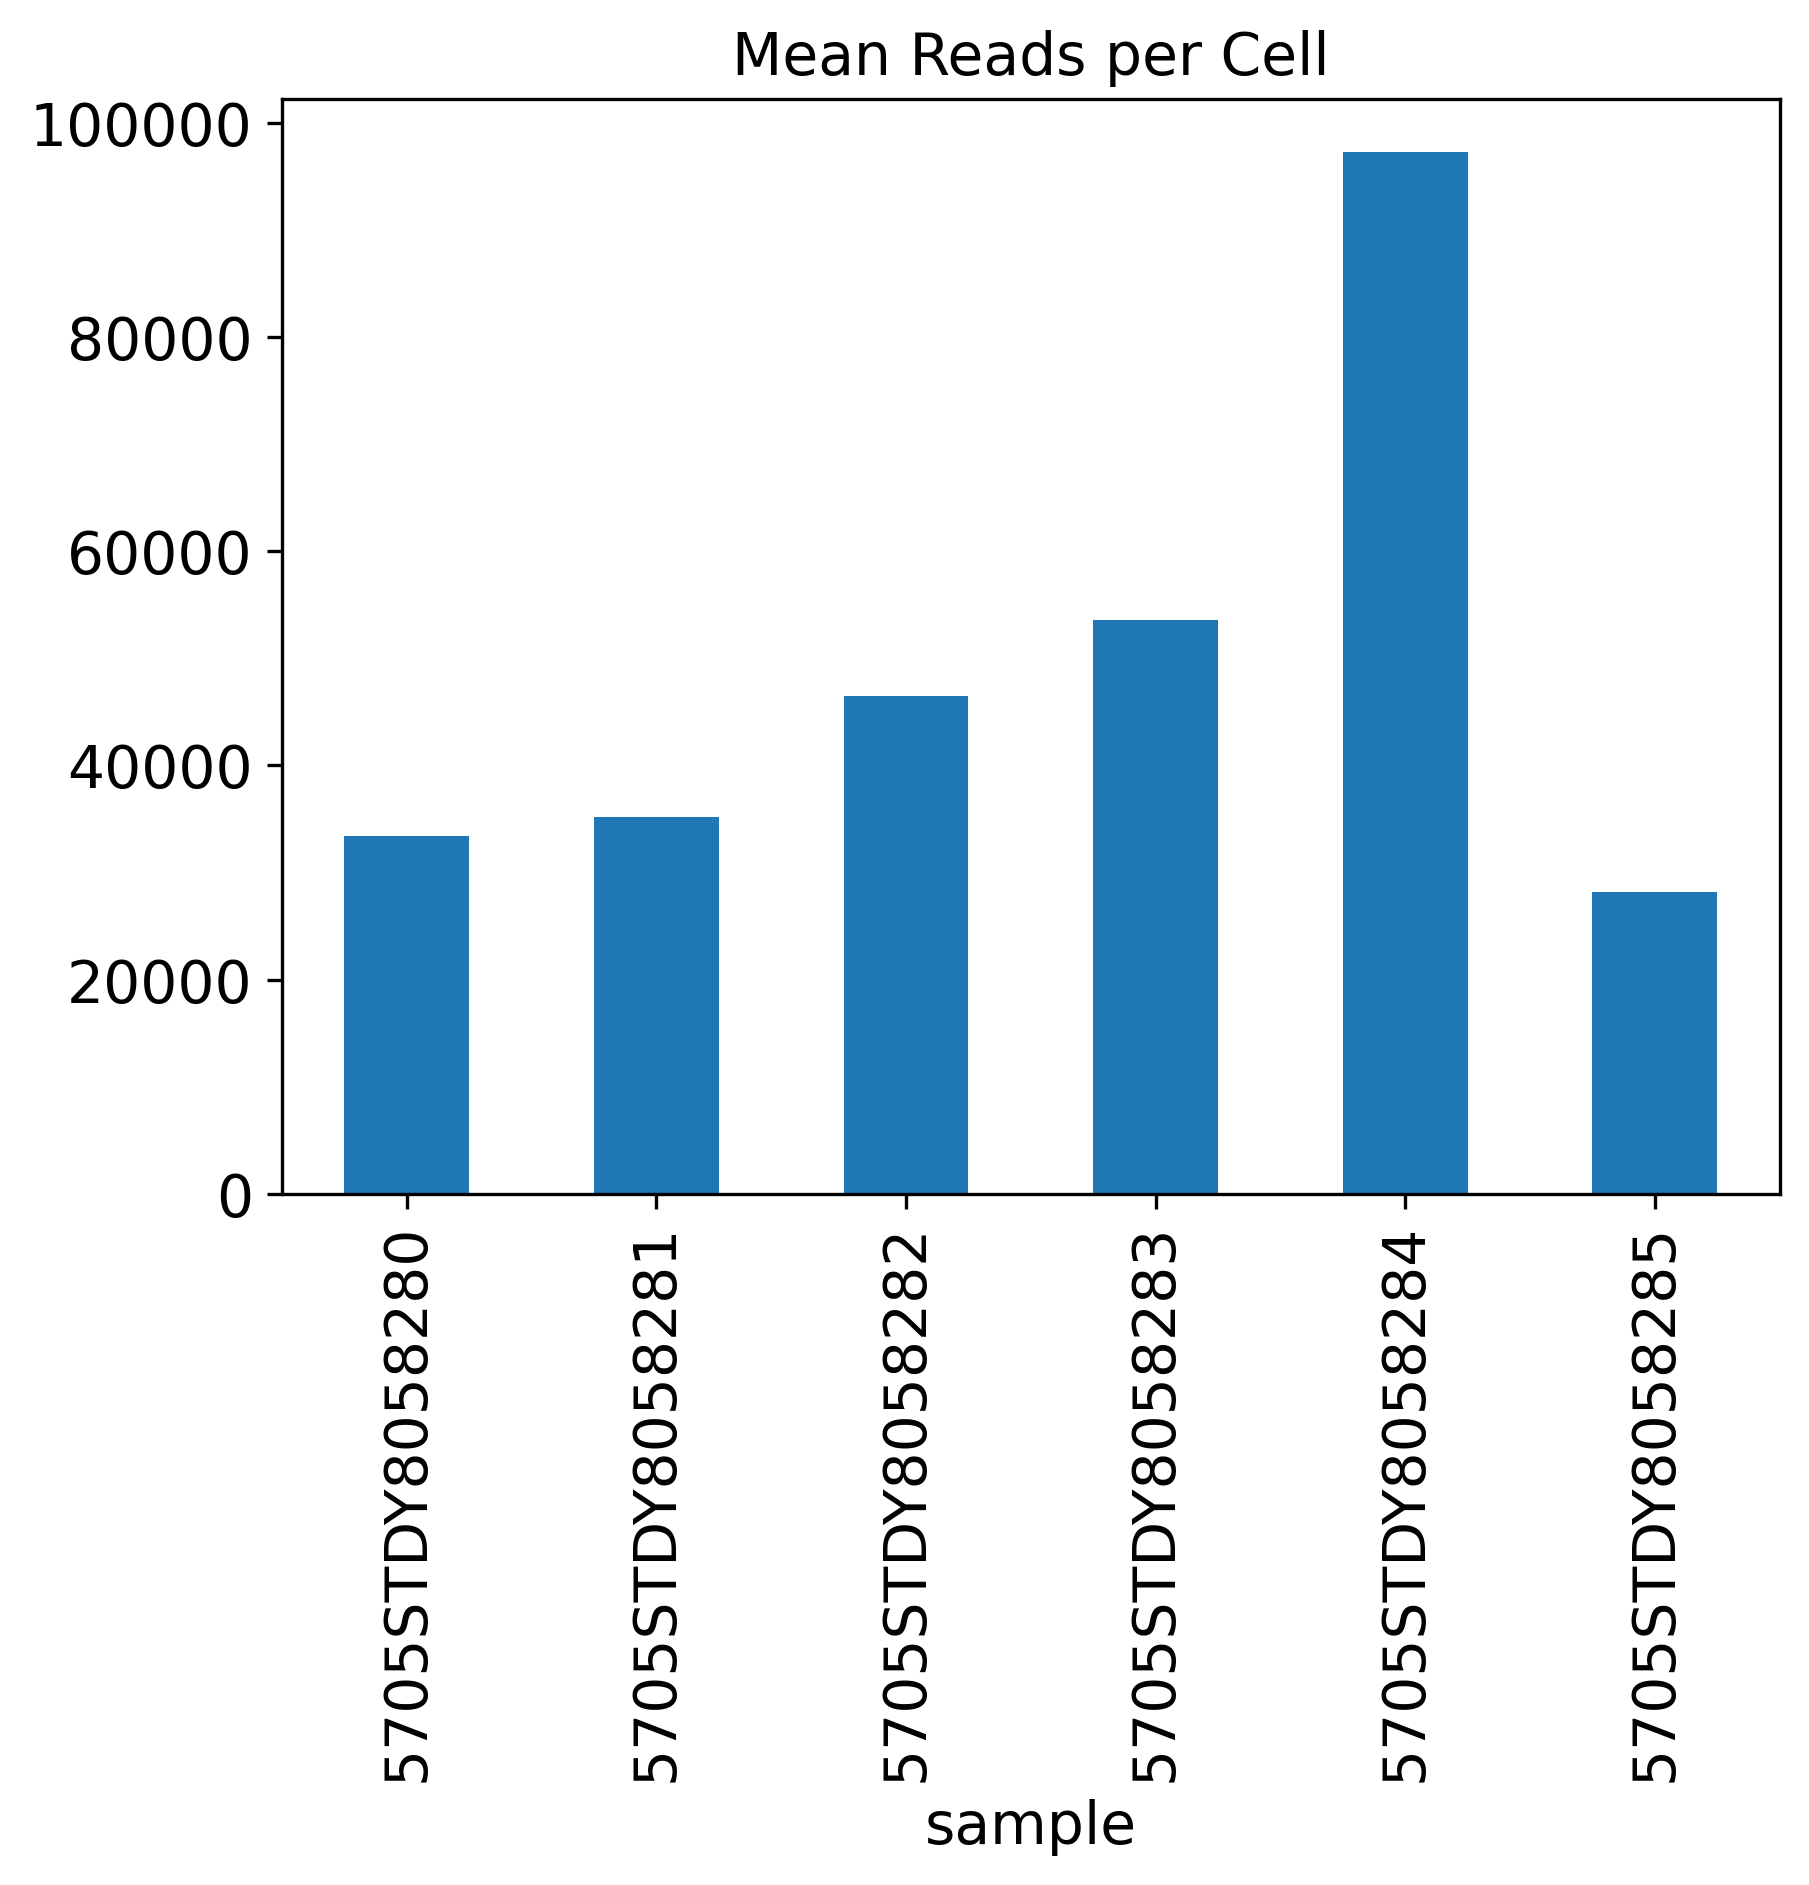
Mean Reads per Cell
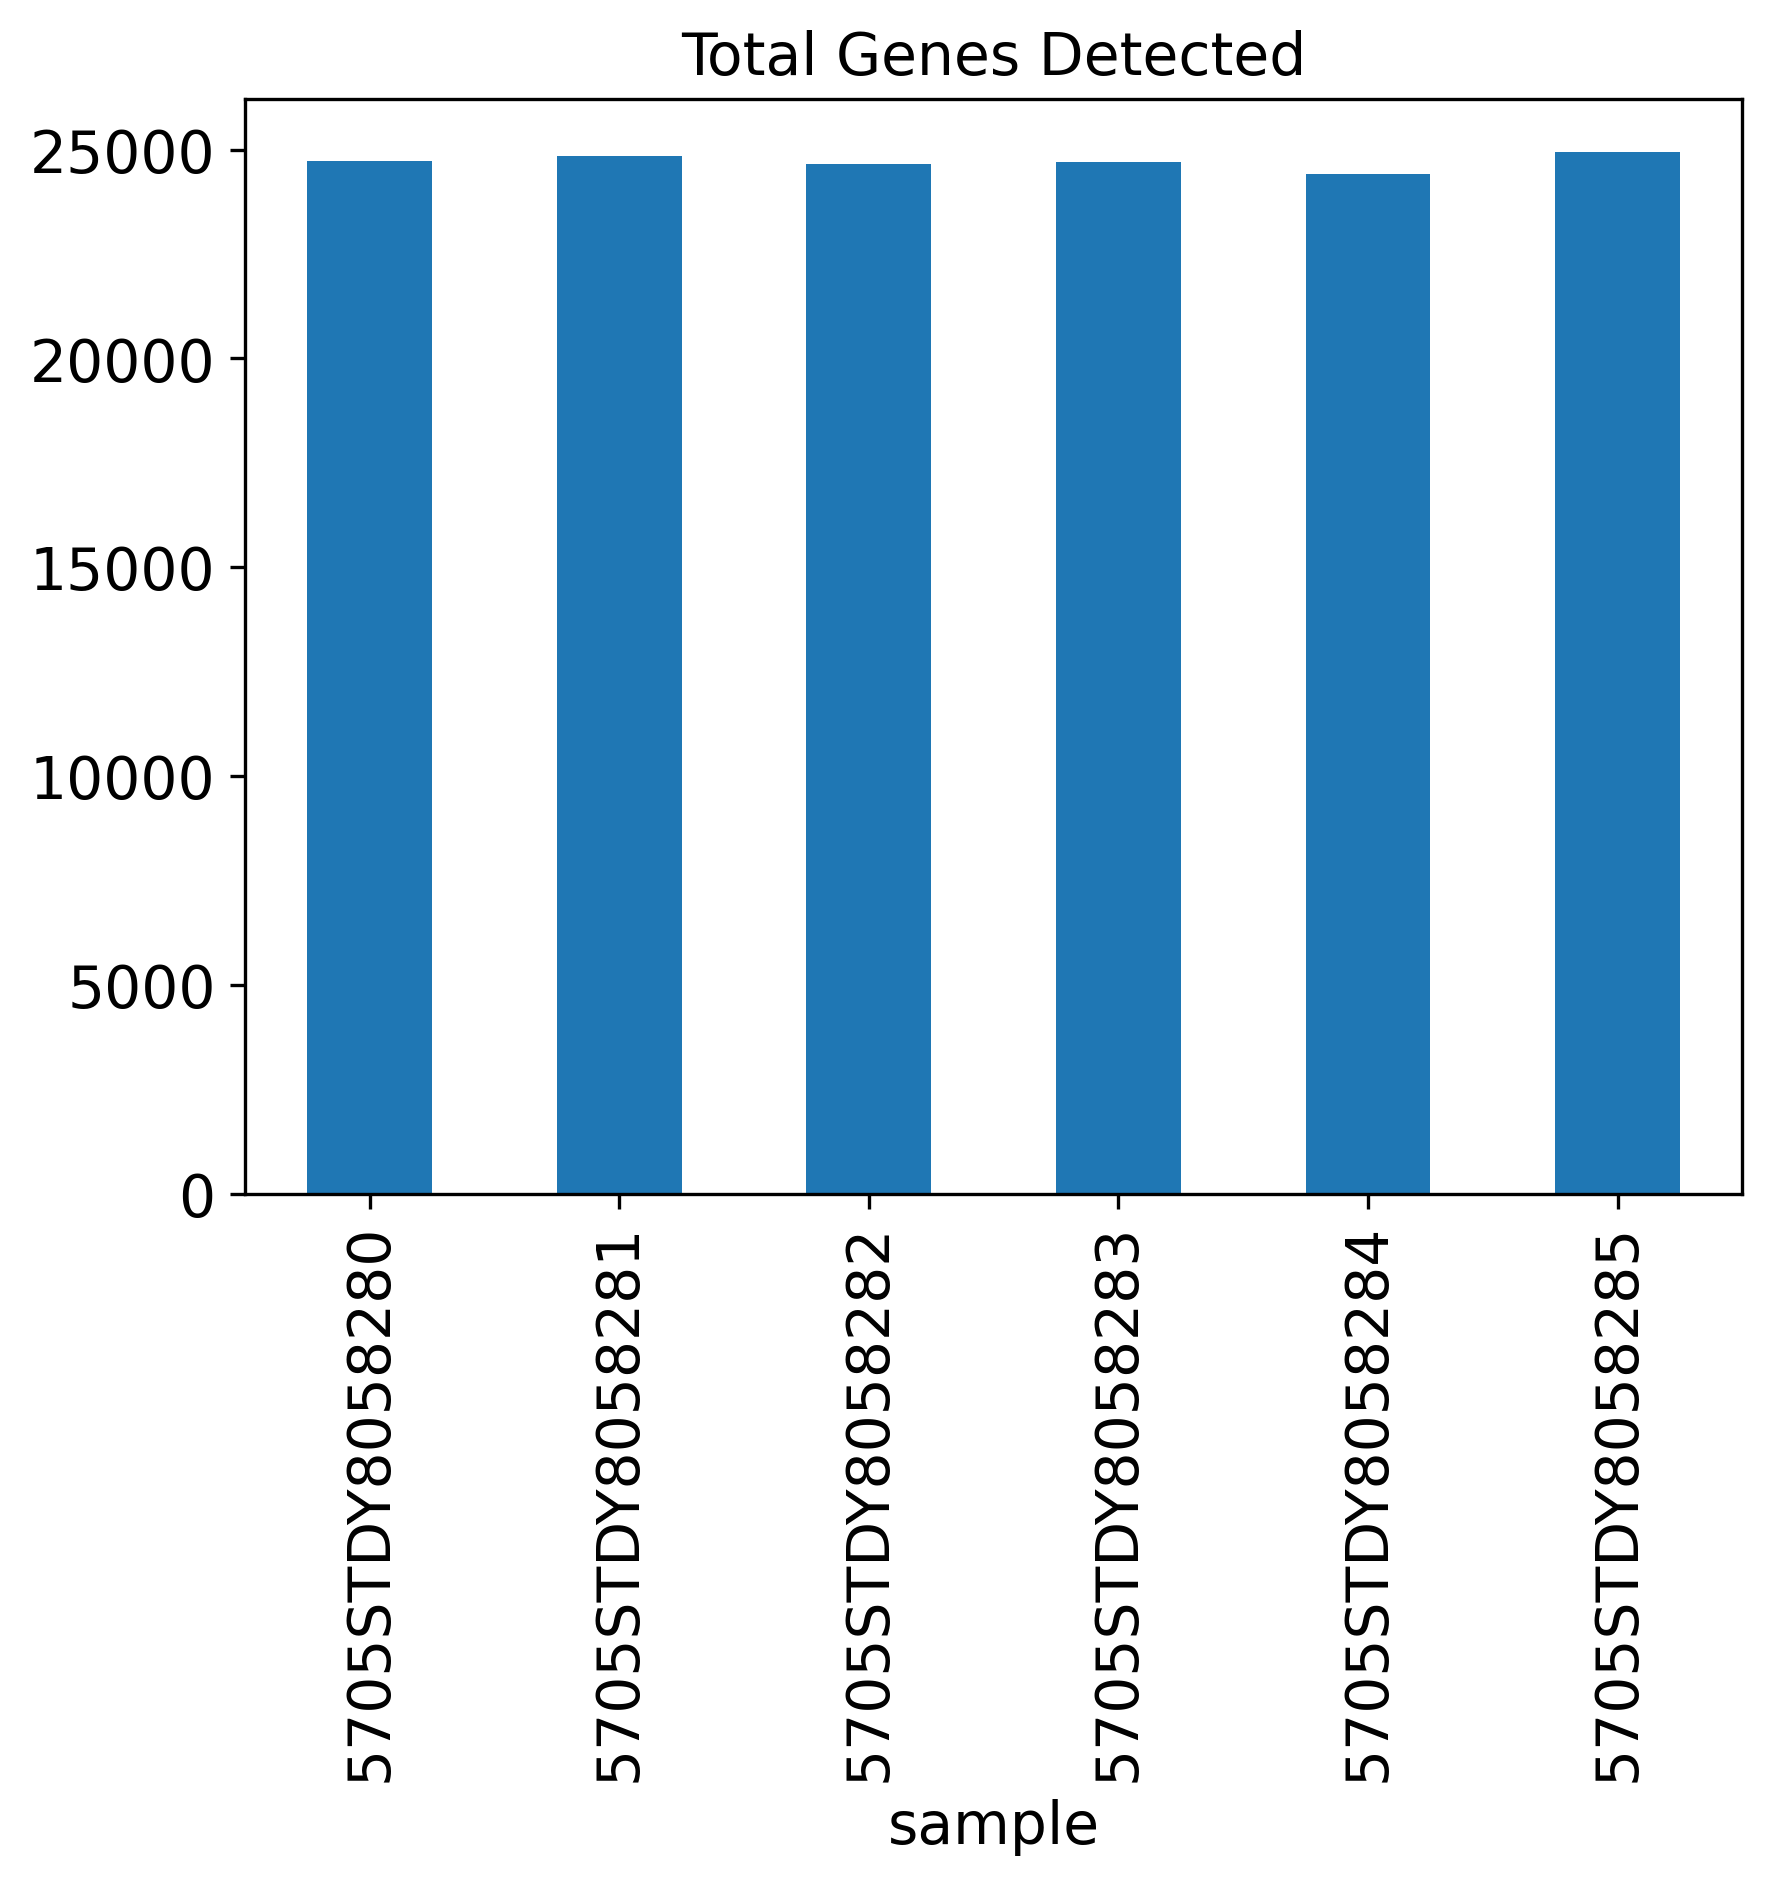
Total Genes Detected
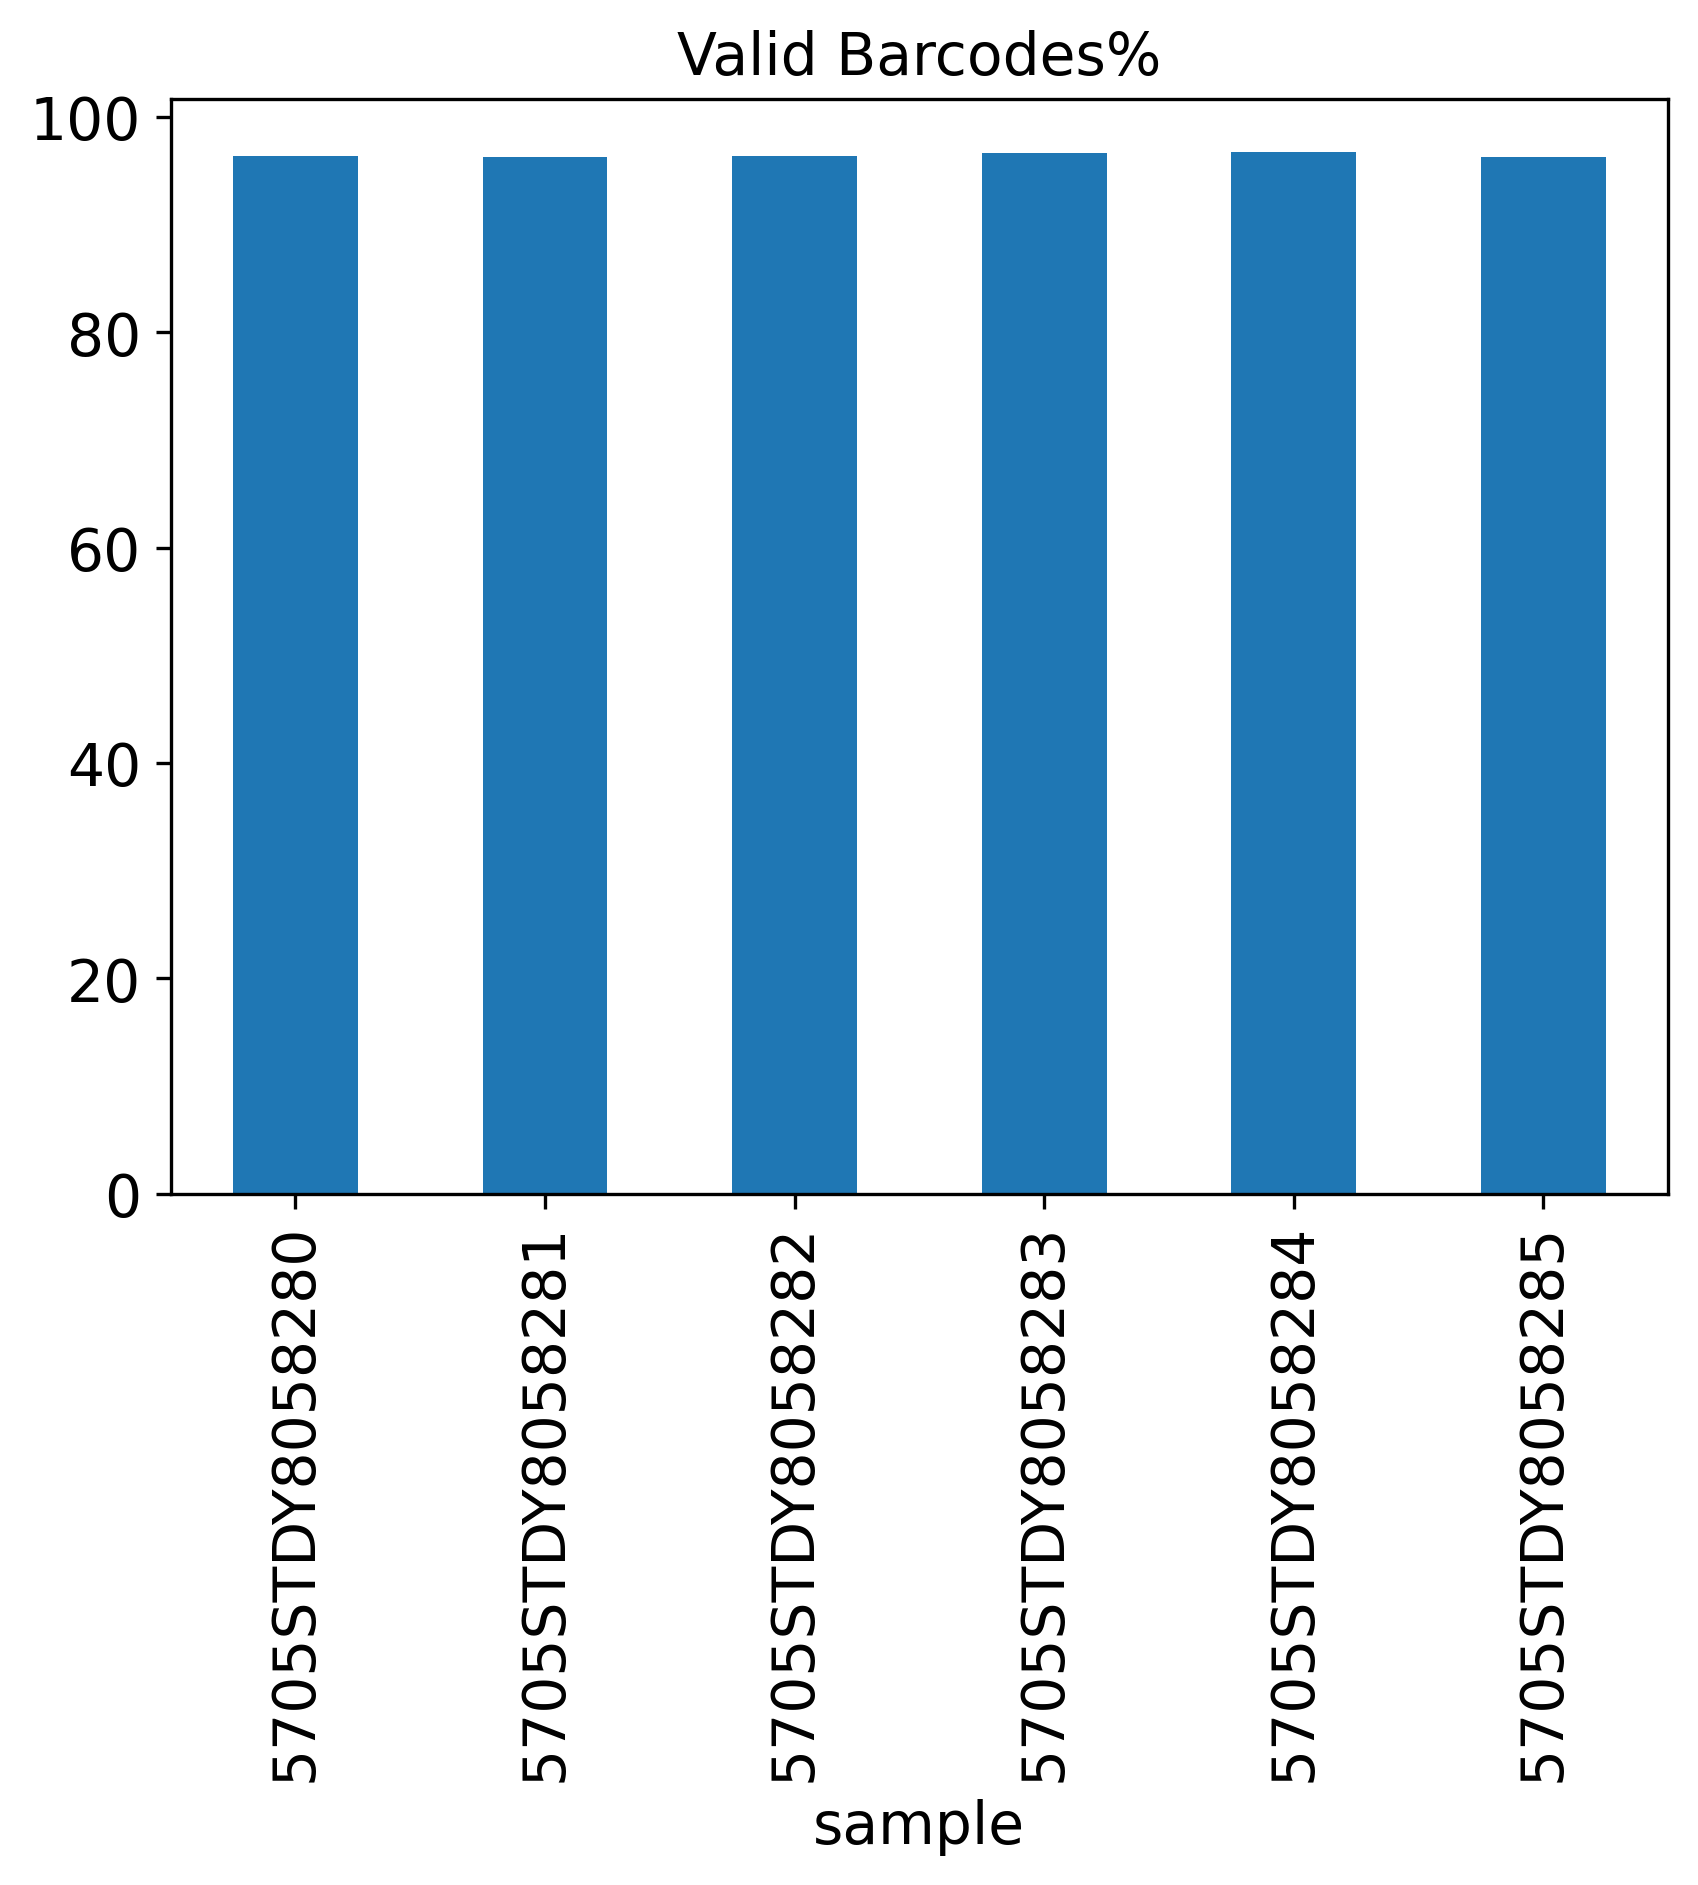
Valid Barcodes%
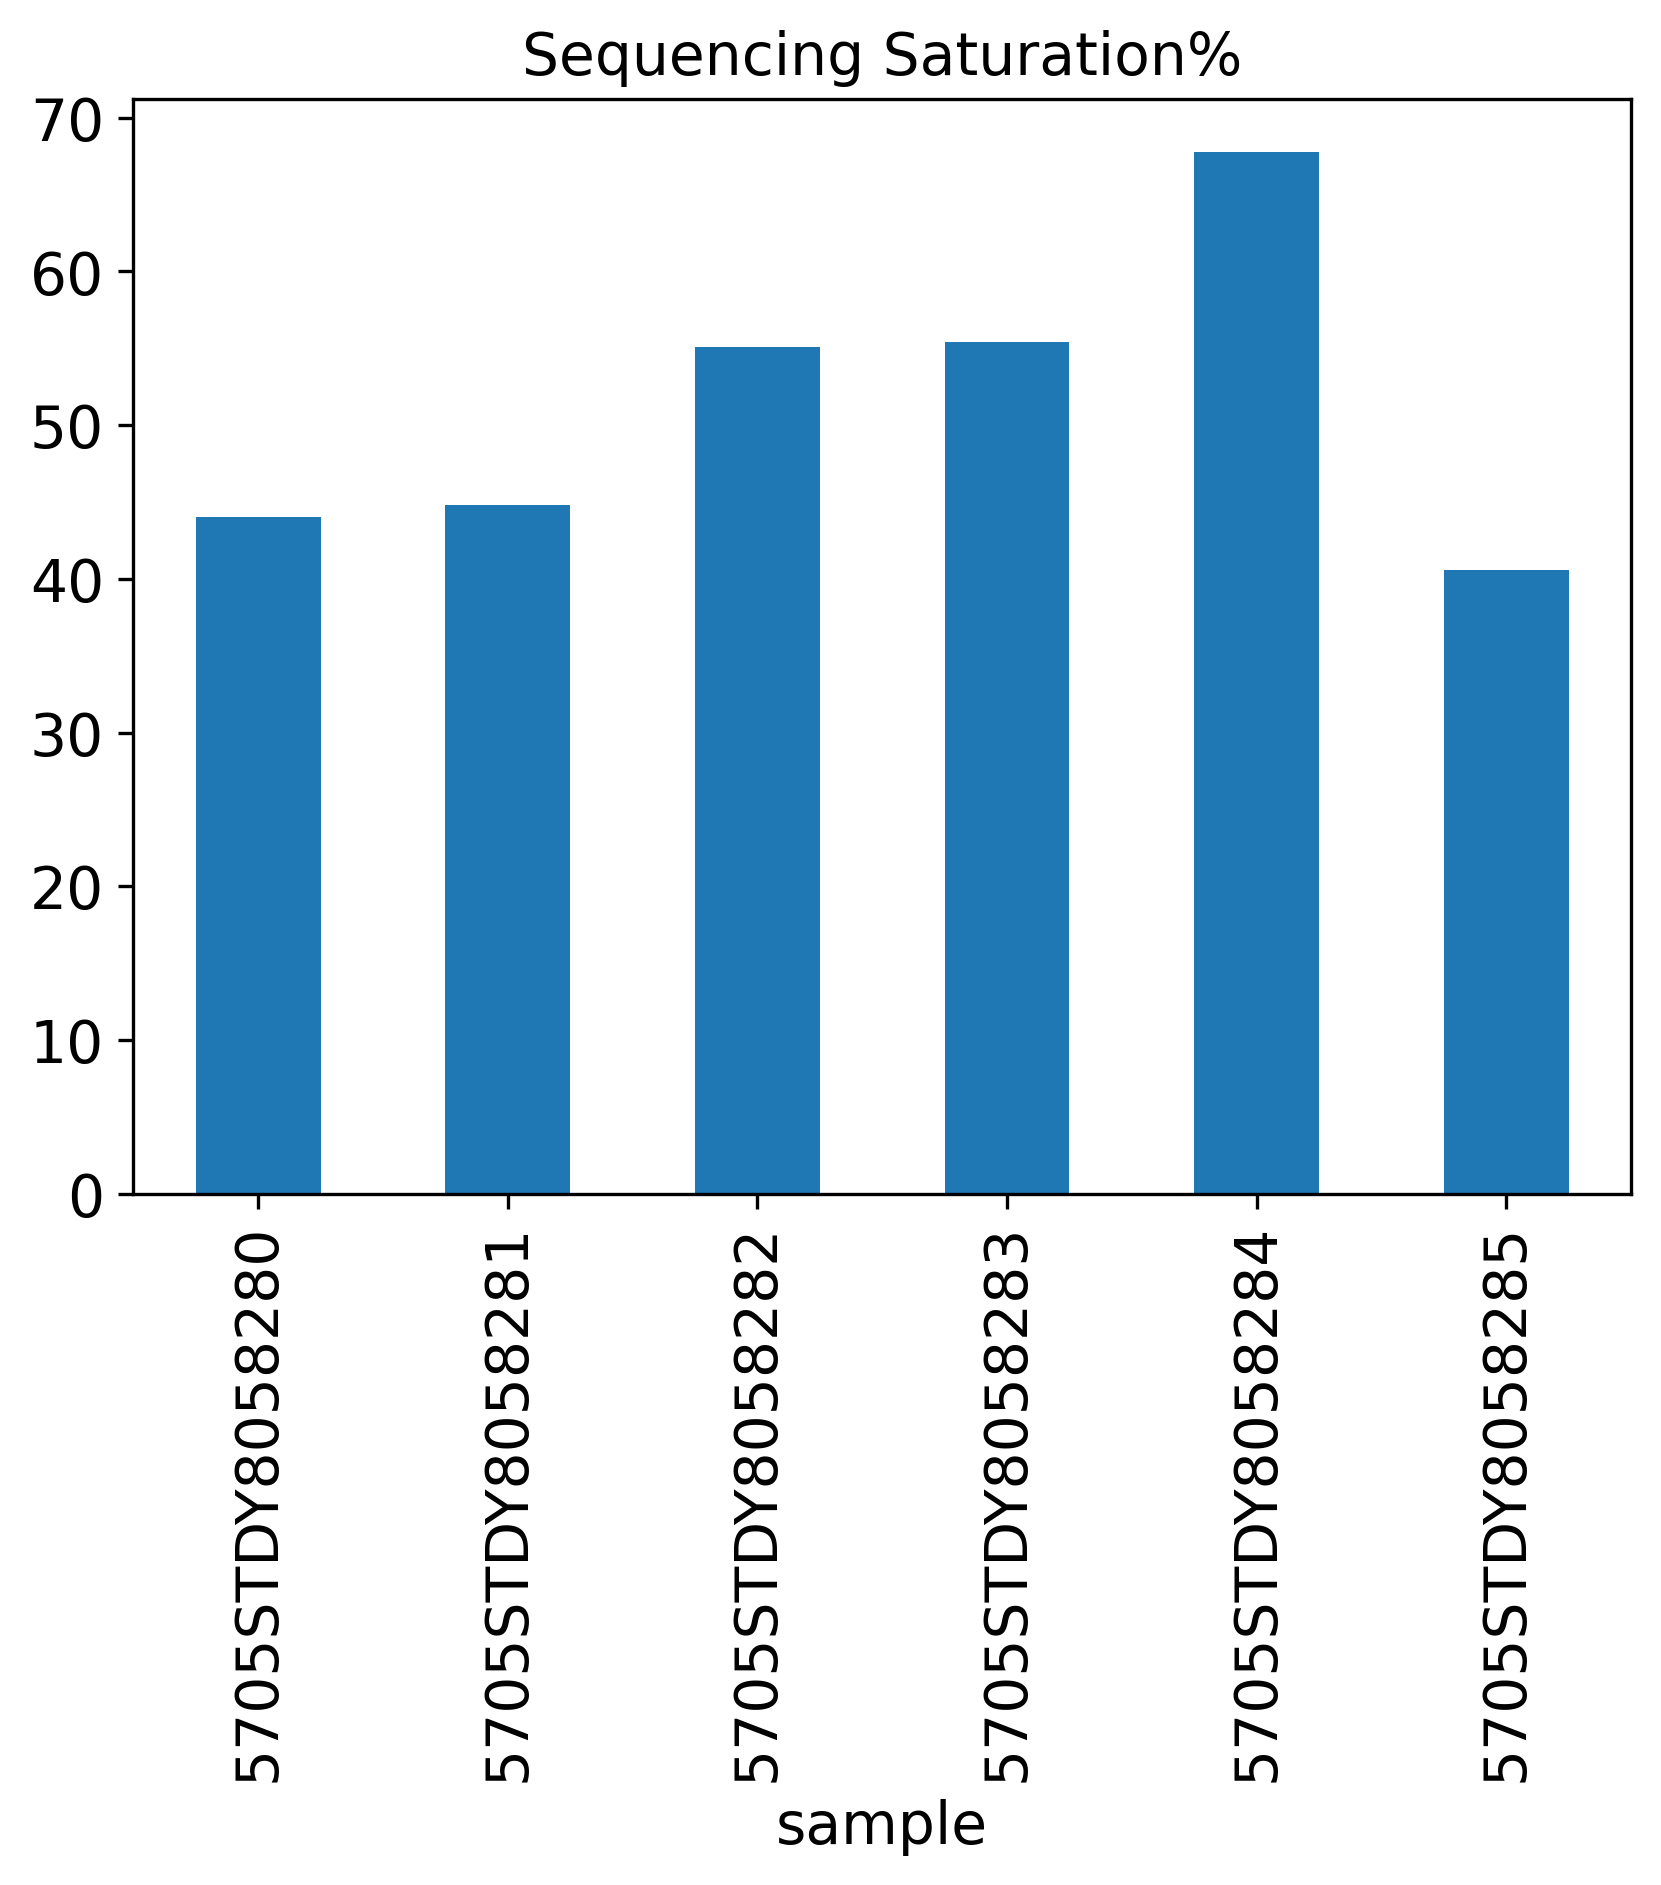
Sequencing Saturation%
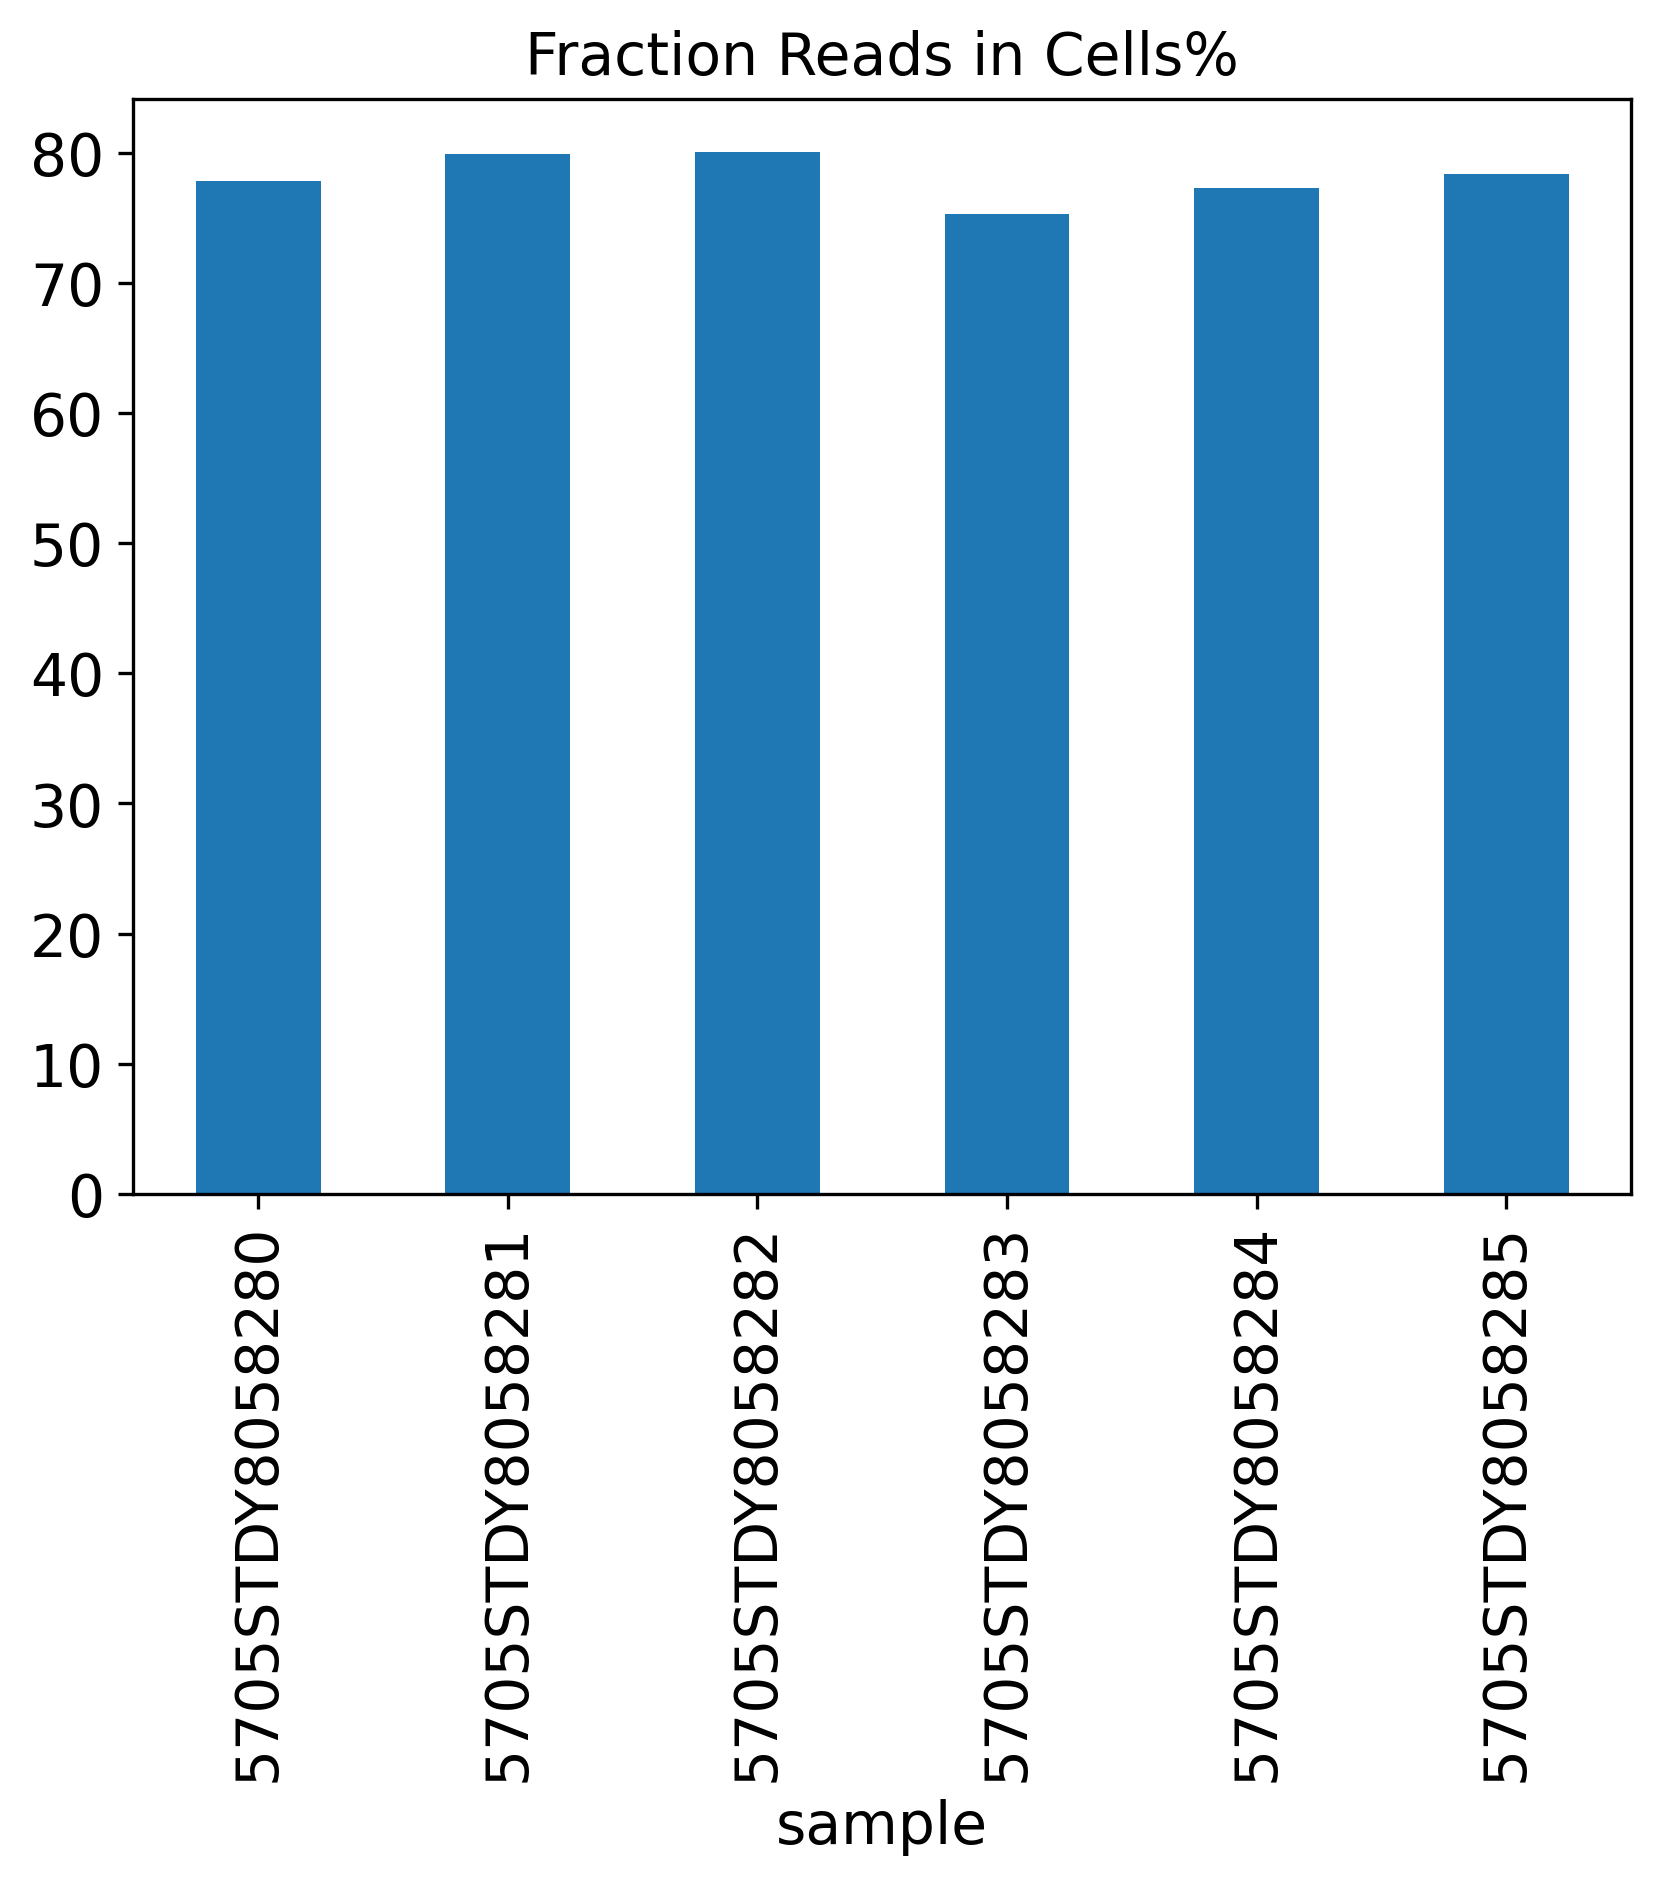
Fraction Reads in Cells%
Q30 Bases Percentage
Q30 Bases in Barcode%
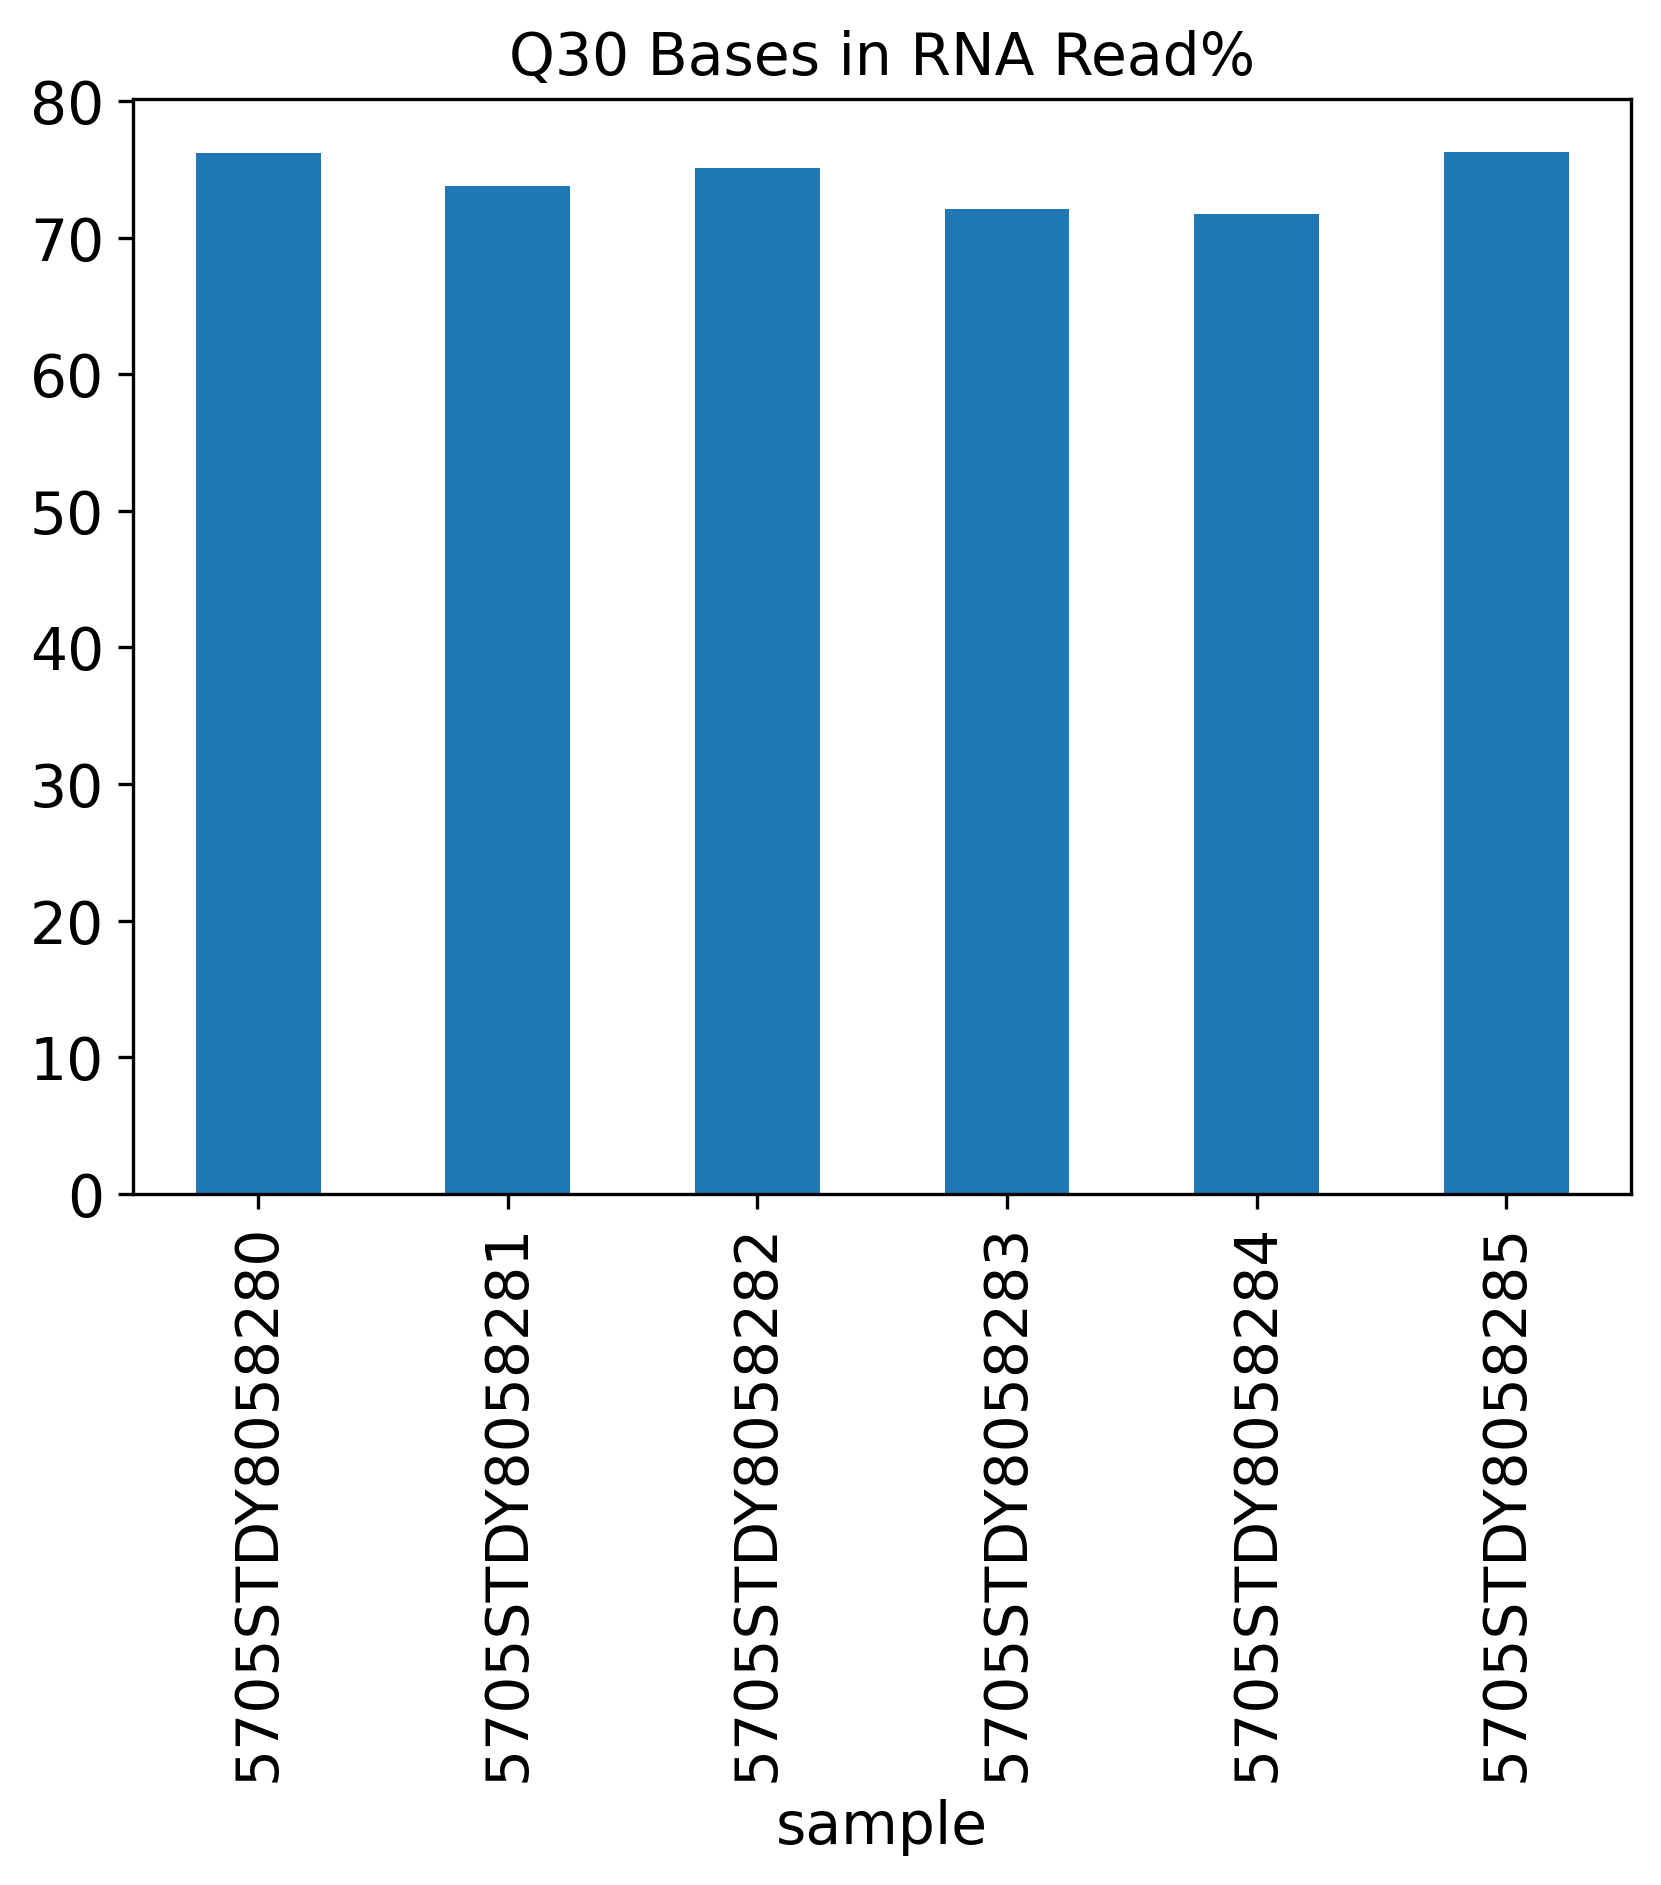
Q30 Bases in RNA Read%
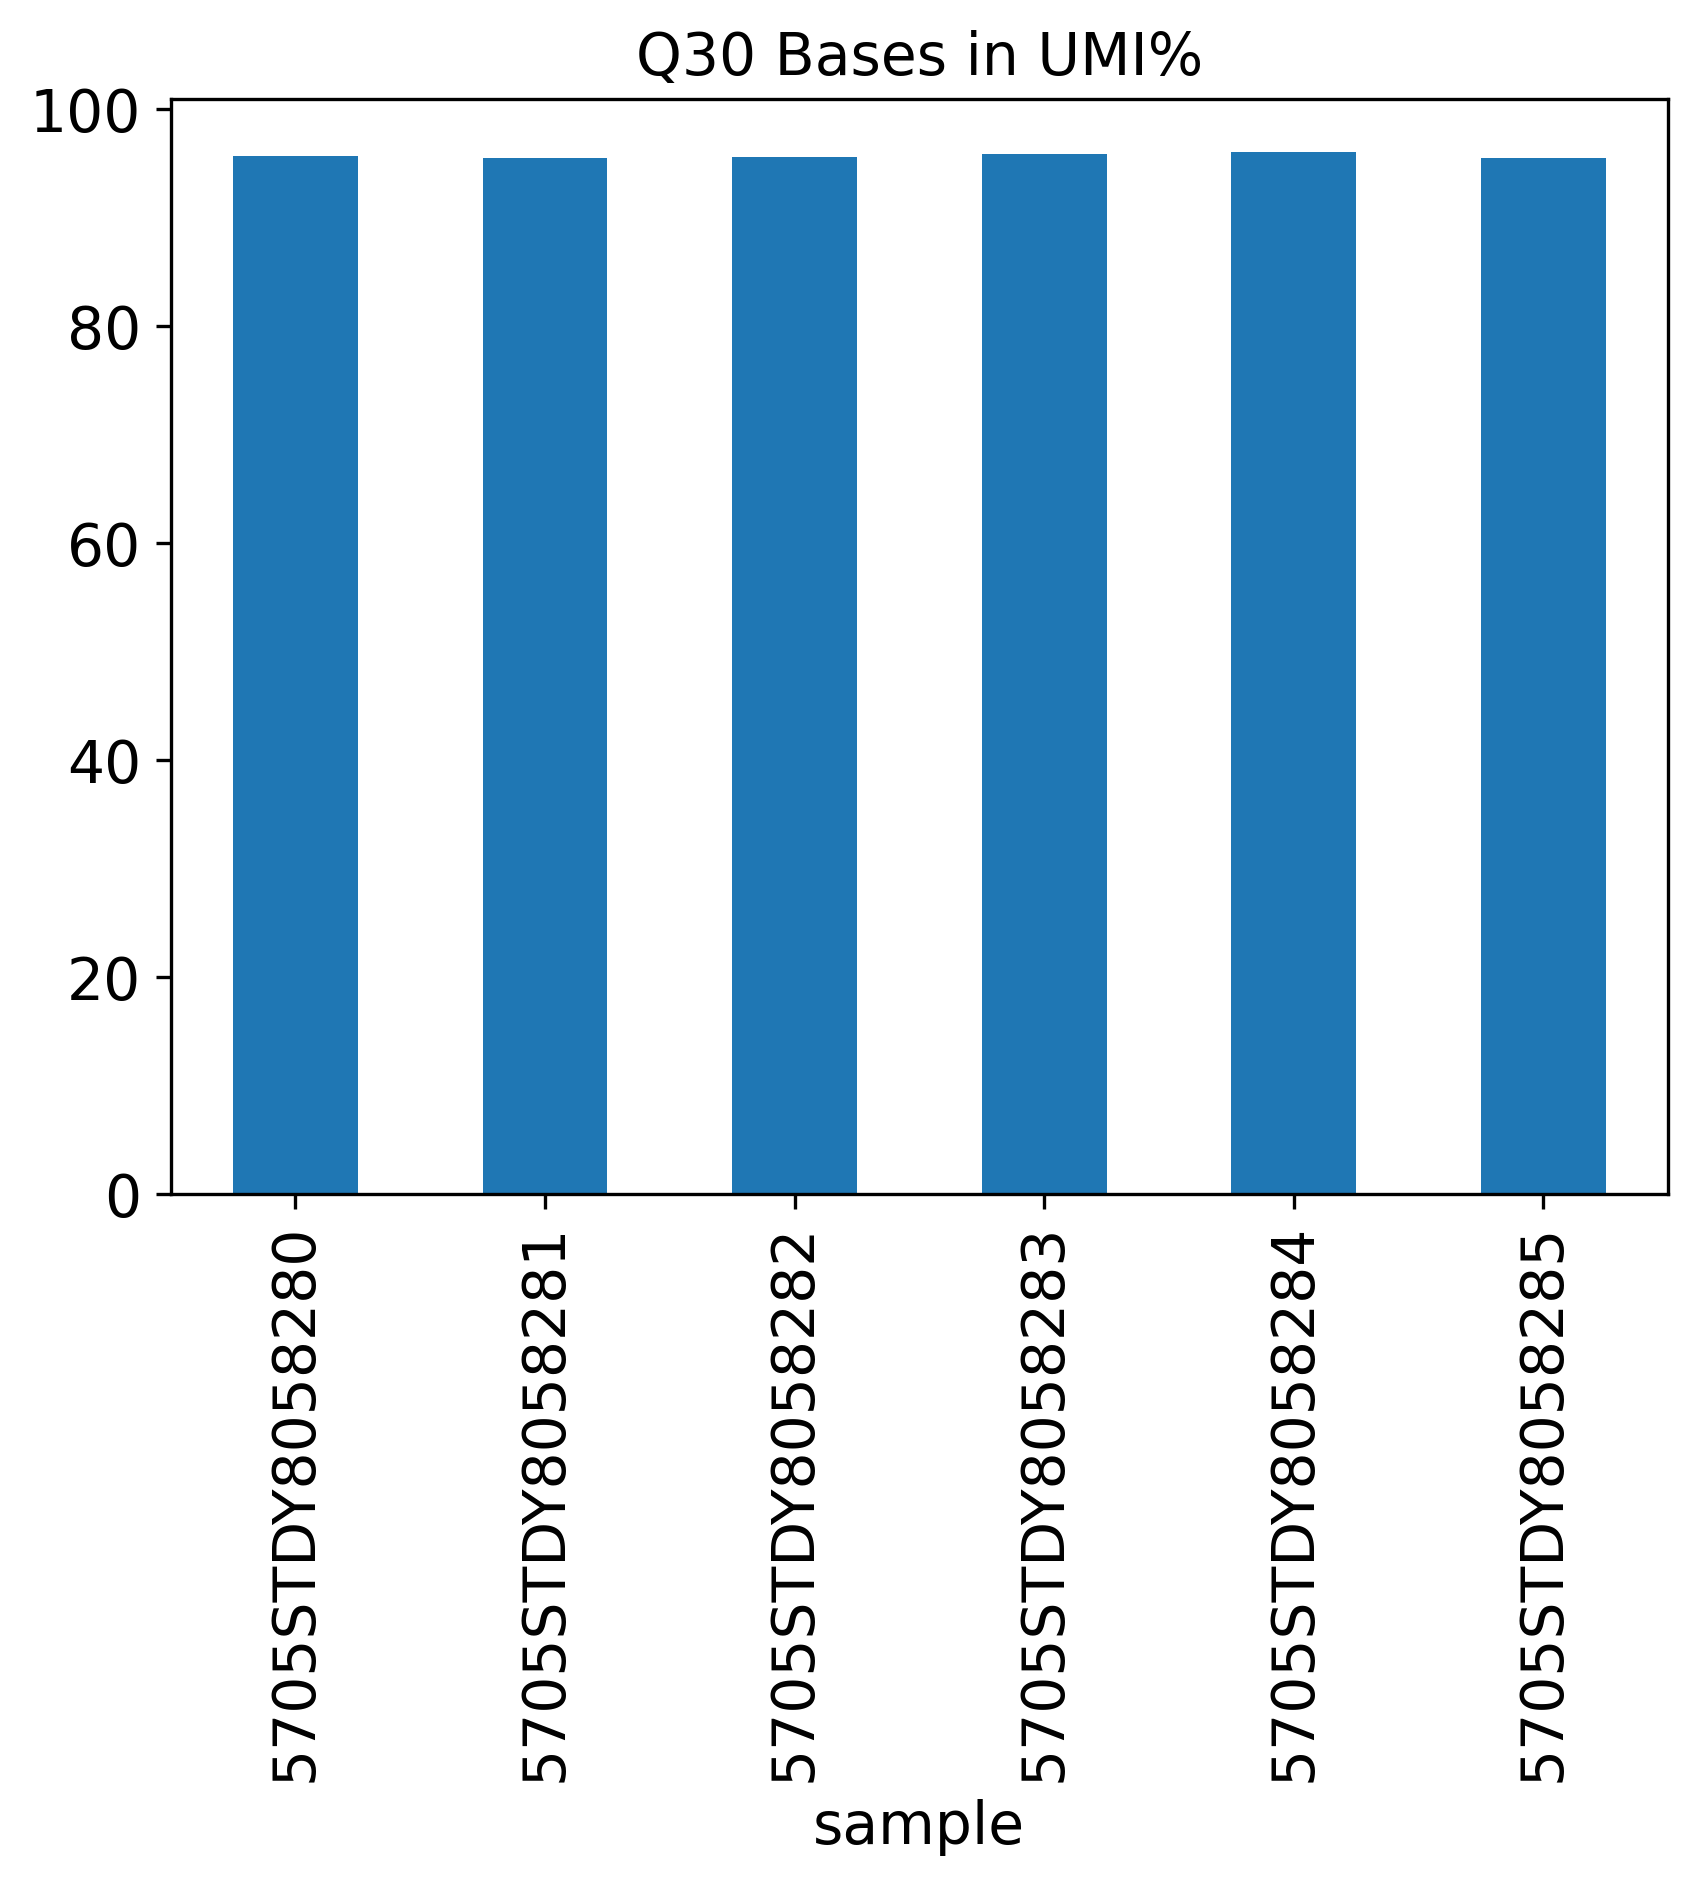
Q30 Bases in UMI%
Reads Mapping Summary
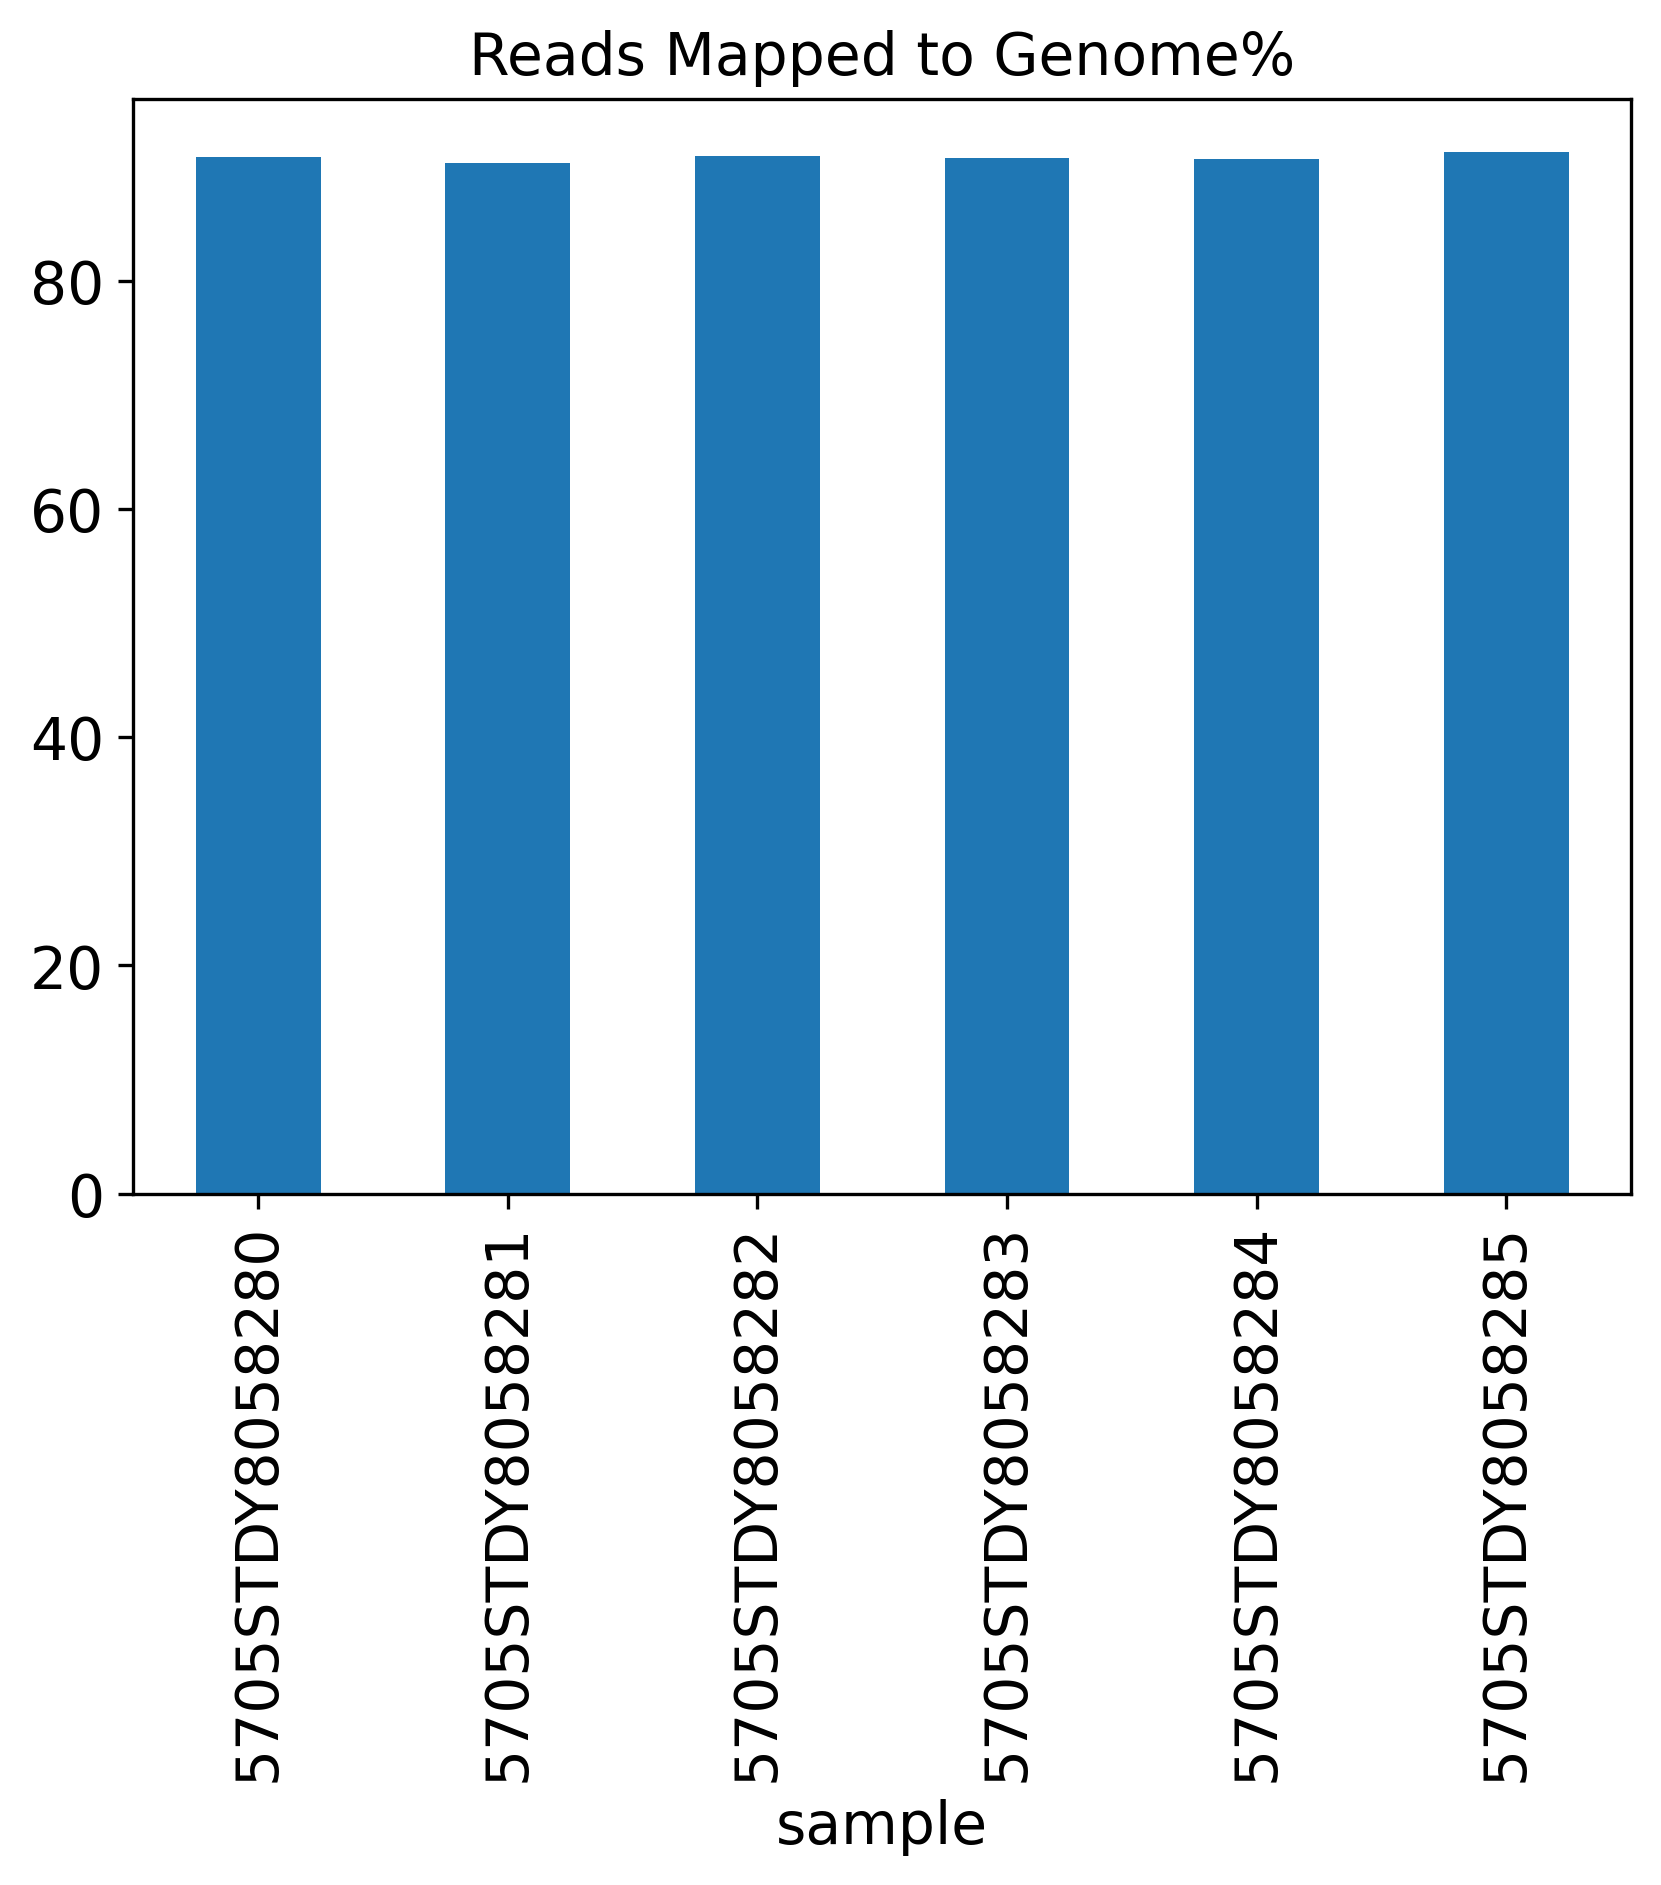
Reads Mapped to Genome%
Reads Mapped Confidently to Genome%
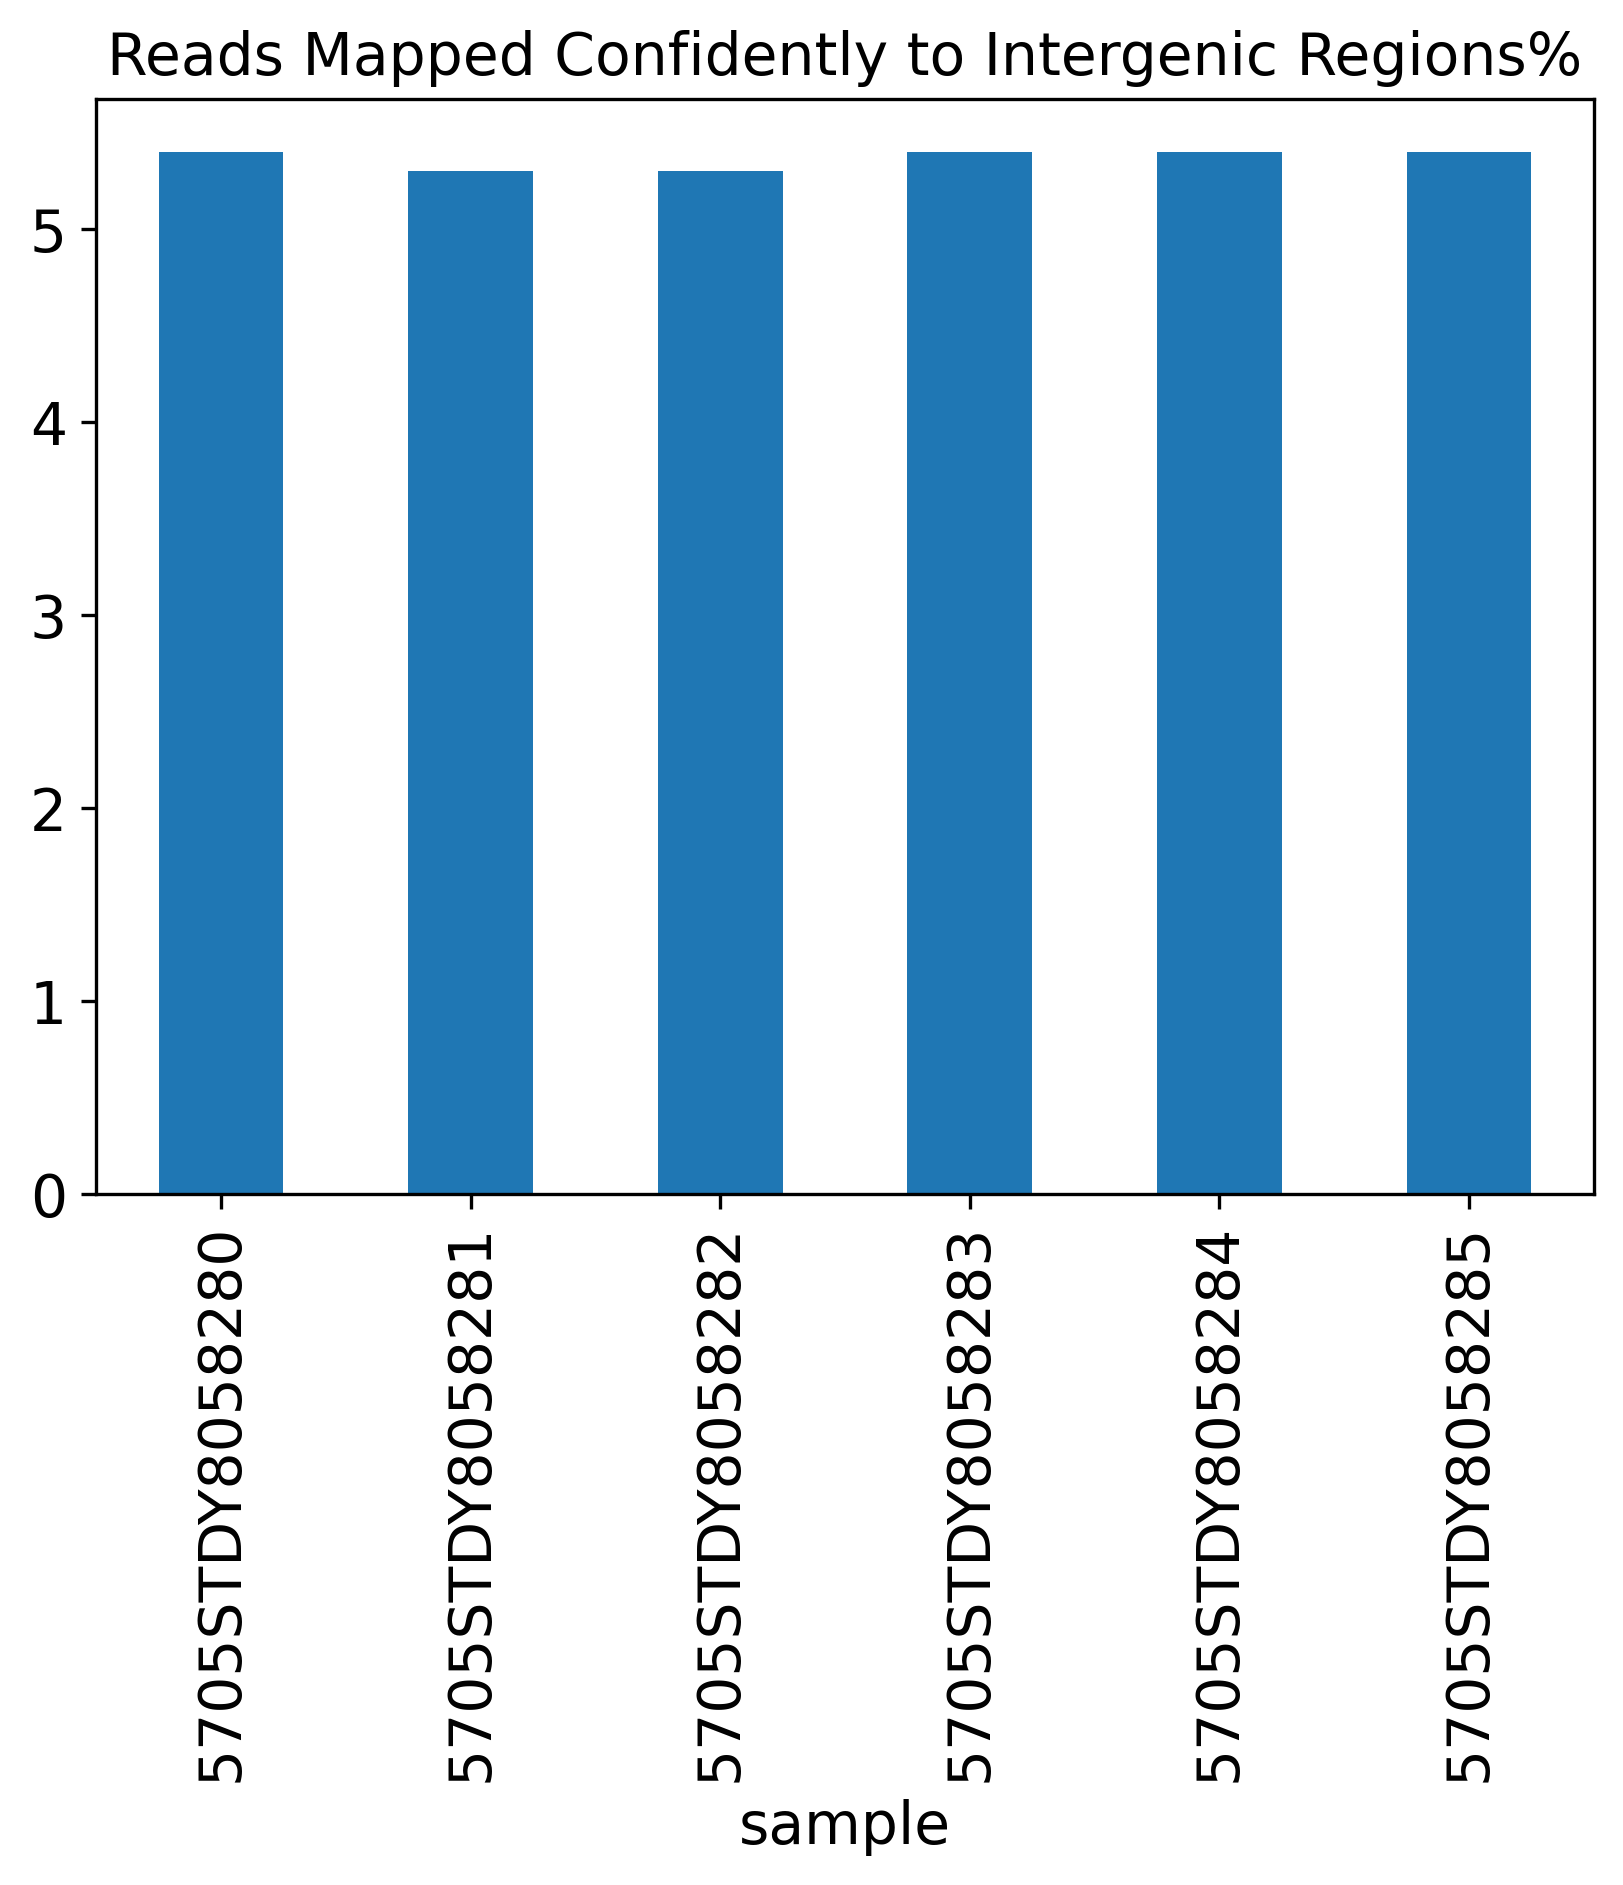
Reads Mapped Confidently to Intergenic Regions%
Reads Mapped Confidently to Intronic Regions%
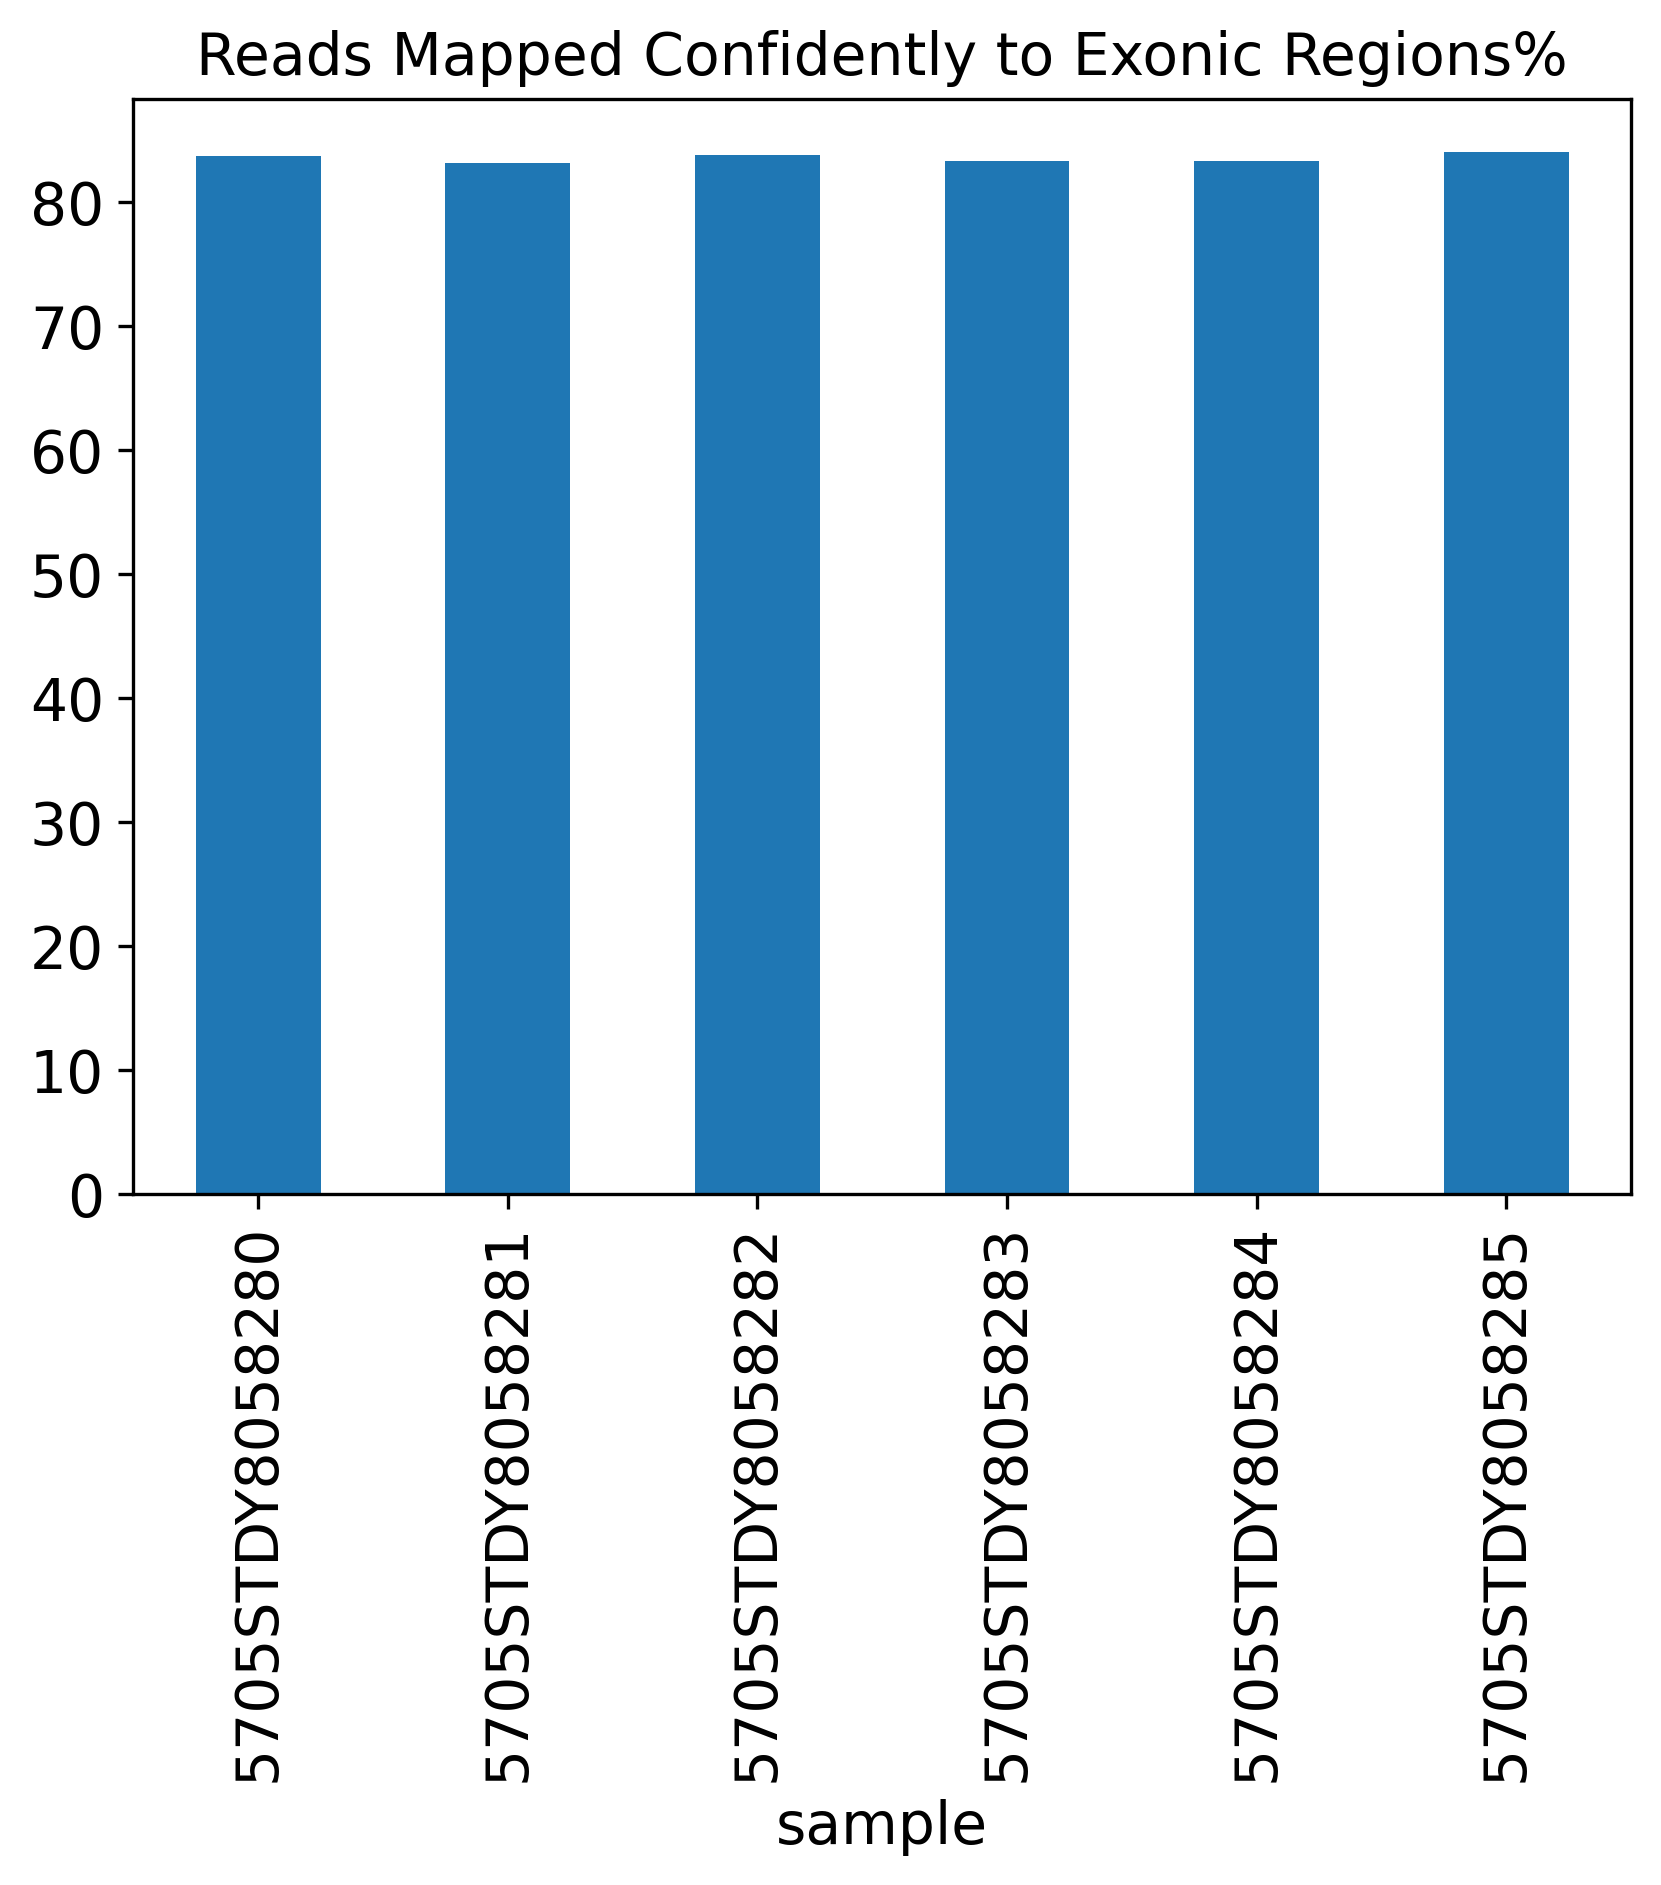
Reads Mapped Confidently to Exonic Regions%
Reads Mapped Confidently to Transcriptome%
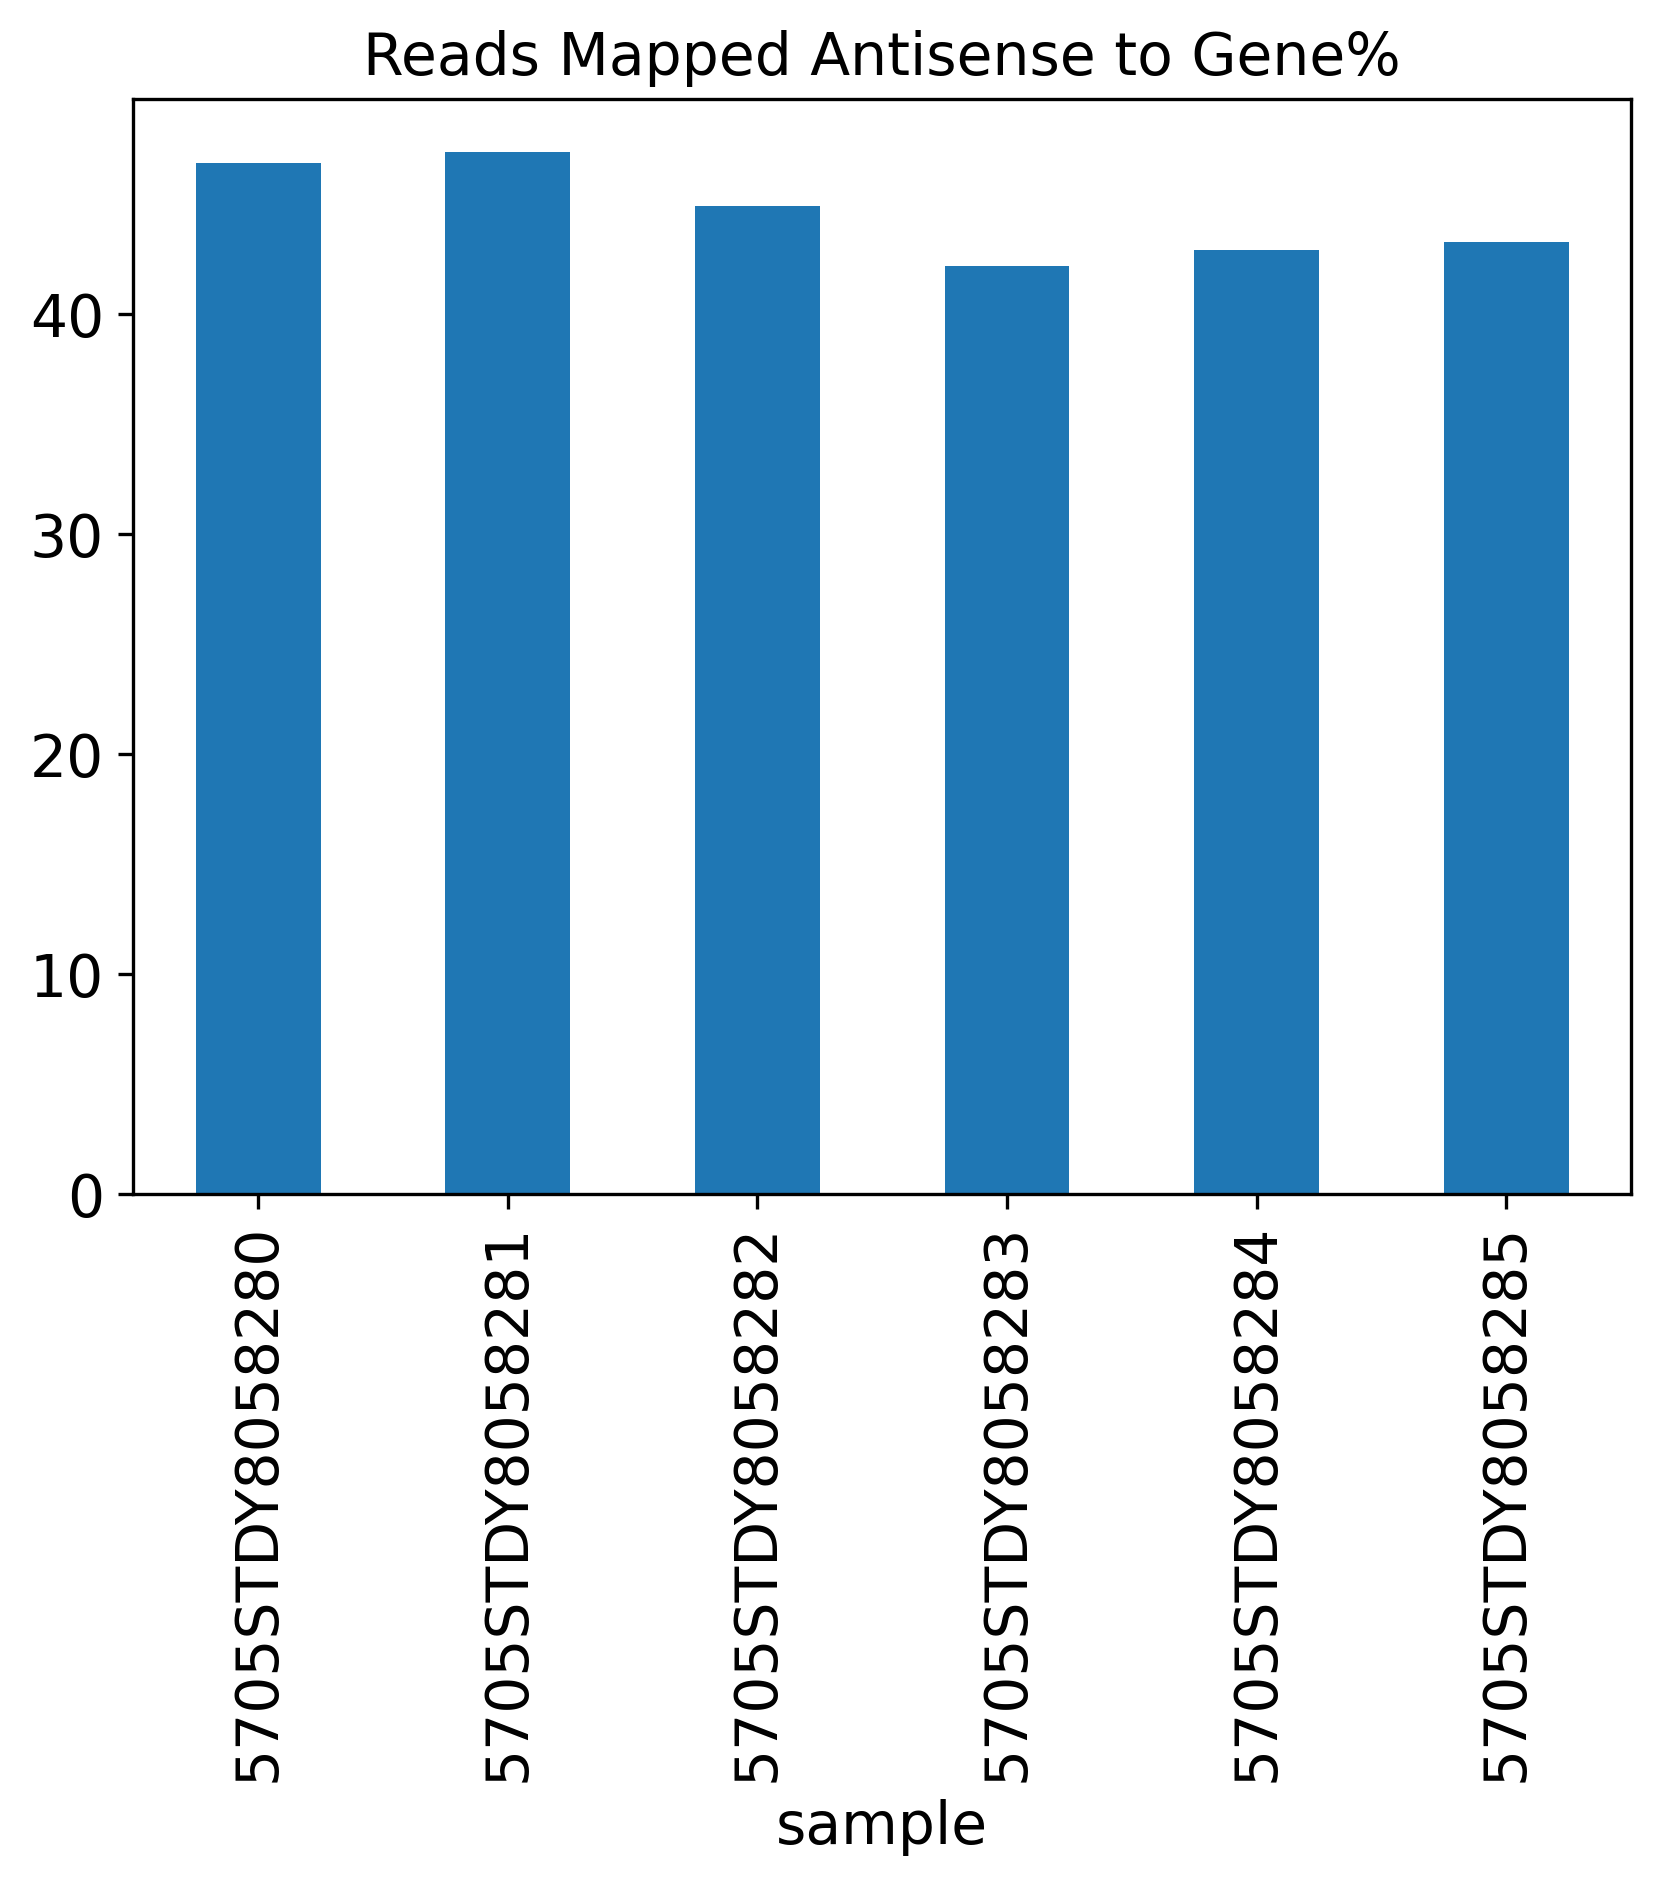
Reads Mapped Antisense to Gene%
1.1 QC summary table
The following table shows a summary of all QC metrics if provided to the pipeline.
No table generated because the sequencingQC.csv is not provided.
Estimated.Number.of.Cells: Total cells estimated. 10X strategy can target up to 10,000 cells per sample. For more information, see here.
Mean.Reads.per.Cell: 10X recommends 30,000-70,000 reads per cell. Usually, >50,000 would be a good number.
Median.Genes.per.Cell: This depends on the biology that how many genes expressed, and how many genes in the annotation. For mouse datasets, it is usually ~2,000 genes.
Sequencing.Saturation: This measures how saturate the sequencing is. For more information, see here.
Reads.Mapped.Confidently.to.Intronic.Regions: This measures the percentage of reads mapped to annotated introns. This rate is expected to be higher in single-nucleus RNAseq experiments, usually >50%. For more information, see here.
Reads.Mapped.Antisense.to.Gene: It it also common to see antisense mapping reads to genes. In mouse data, this rate can be >40%, but it may vary from sample to sample
Median.UMI.Counts.per.Cell: The median UMI per cell is a metric independent to the annotation, counting how many UMI in each cell. It would be ideal to see 3,000-4,000 UMI per cell.
1.2 General QC
The General QC plot section includes nine bar plots to visualize general metrics of the current single-cell project.
1.3 Q30 Bases Percentage
The Q30 Bases Percentage includes three Q30 plots showing Barcode%, RNA Read% and UMI%.

1.4 Reads Mapping Summary
The Reads Mapping Summary section includes seven plots showing the percentage of reads mapped to different genomic features. Ideally, most of the reads should map to the Genome, as well as the Transcriptome. For single-nucleus RNA-seq data, we expect to see more reads mapped to the intronic region, compared to a single-cell RNA-seq data.