Chapter 3 Post-filtering Plots
These post-filtering plots can be used to examine the filtering cutoff. If any of the cutoffs were not ideal, please adjust the cutoff parameters in the config.yml file, then rerun scAnalyzer to generate this report again. This step is designed as semi-automatic, which allows the users to fine-tune the cutoffs and understand the data.
A summary of filtering cutoffs, and number of cells and genes after each filtering step.
The last row shows the final number after all steps.
| Filter | cutoff | cell_number | gene_number |
|---|---|---|---|
| 10X report | 40532 | 26502 | |
| doublet | byClass | 37856 | 26502 |
| MT | 20.000000 | 37856 | 26489 |
| min cell | 3 | 37856 | 24957 |
| min gene | 50 | 37856 | 24957 |
| max gene | 3000 | 28964 | 24957 |
| max UMI | 10000 | 28959 | 24957 |
The MT row reflects the results after mitochondria percentage reads filtering in each cell
The min cell parameter indicates minimum number of cells with non-zero count for a gene.
The min gene parameter indicates minimum number of genes detected in each cell.
The max gene parameter indicates maximum number of genes detected in each cell.
The max UMI parameter indicates maximum UMI counts in each cell.
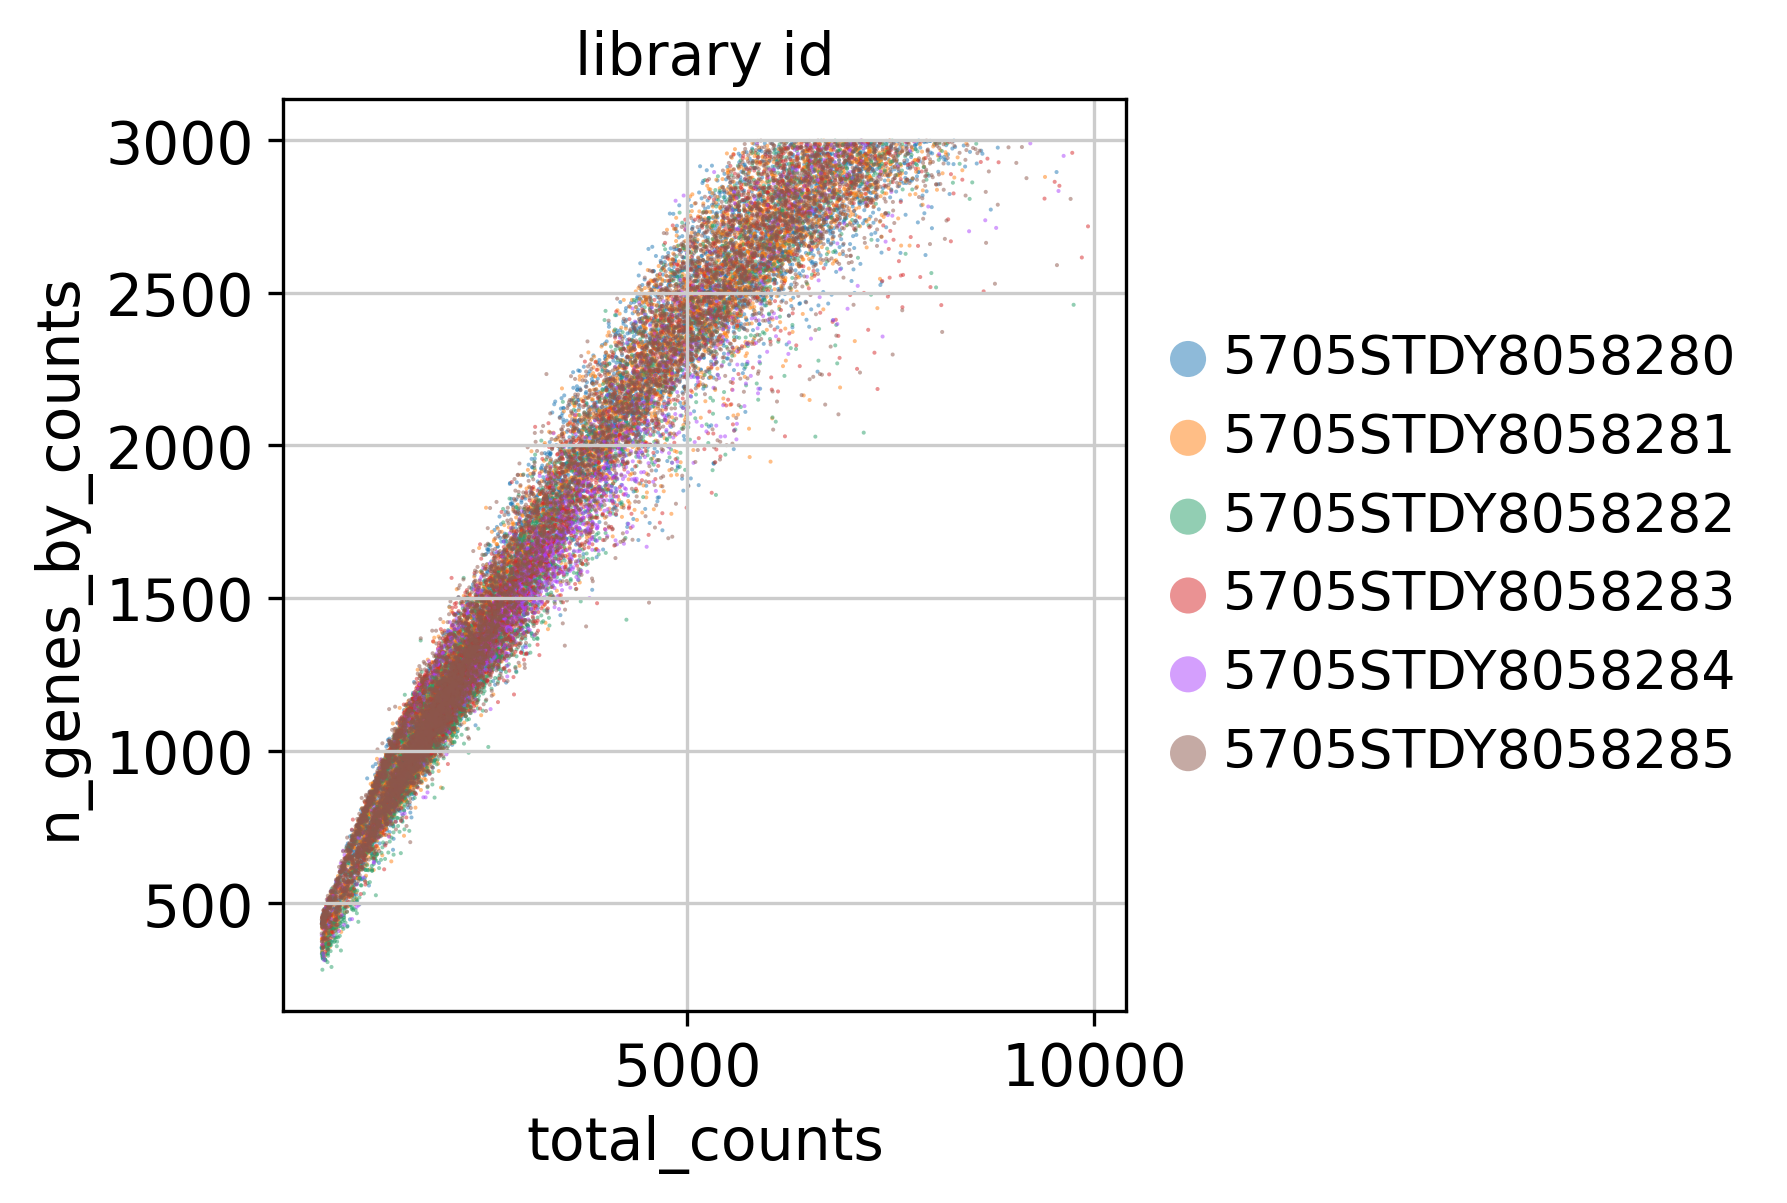
3.1 Counts and Genes
This plot shows Total Counts (X axis) v.s. Genes (Y axis) detected in each sample, after filtering.
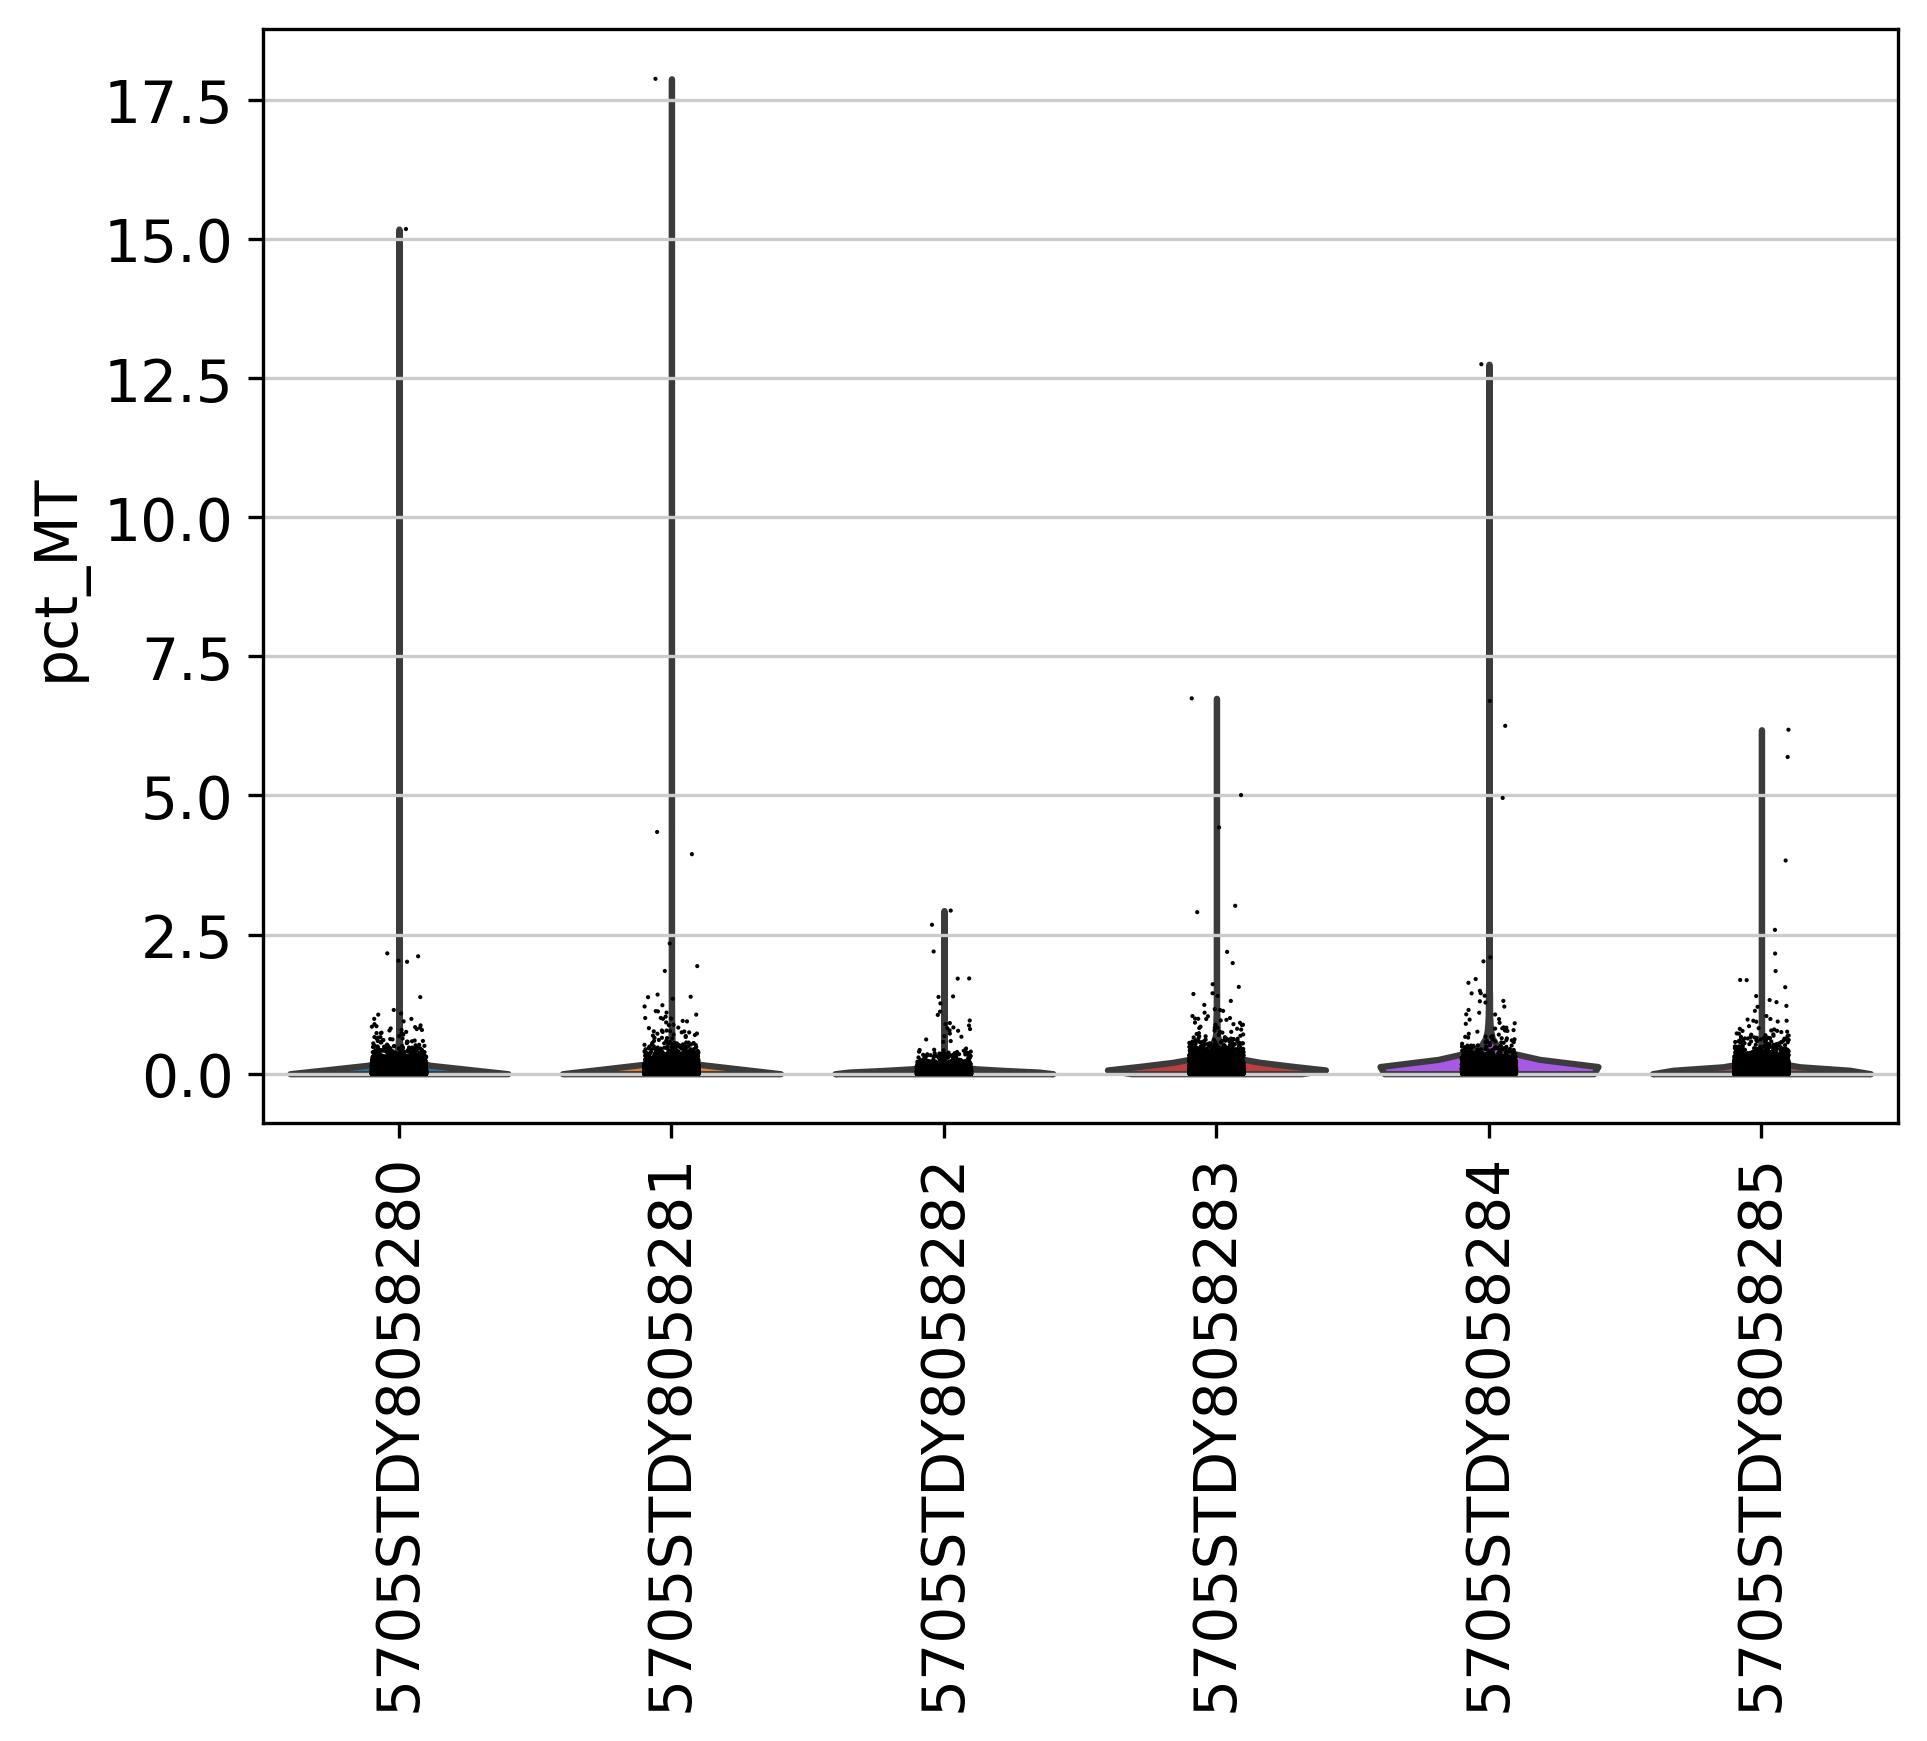
3.2 Number of Genes
This plot shows Number of Genes (Y axis) detected in each sample, after filtering.

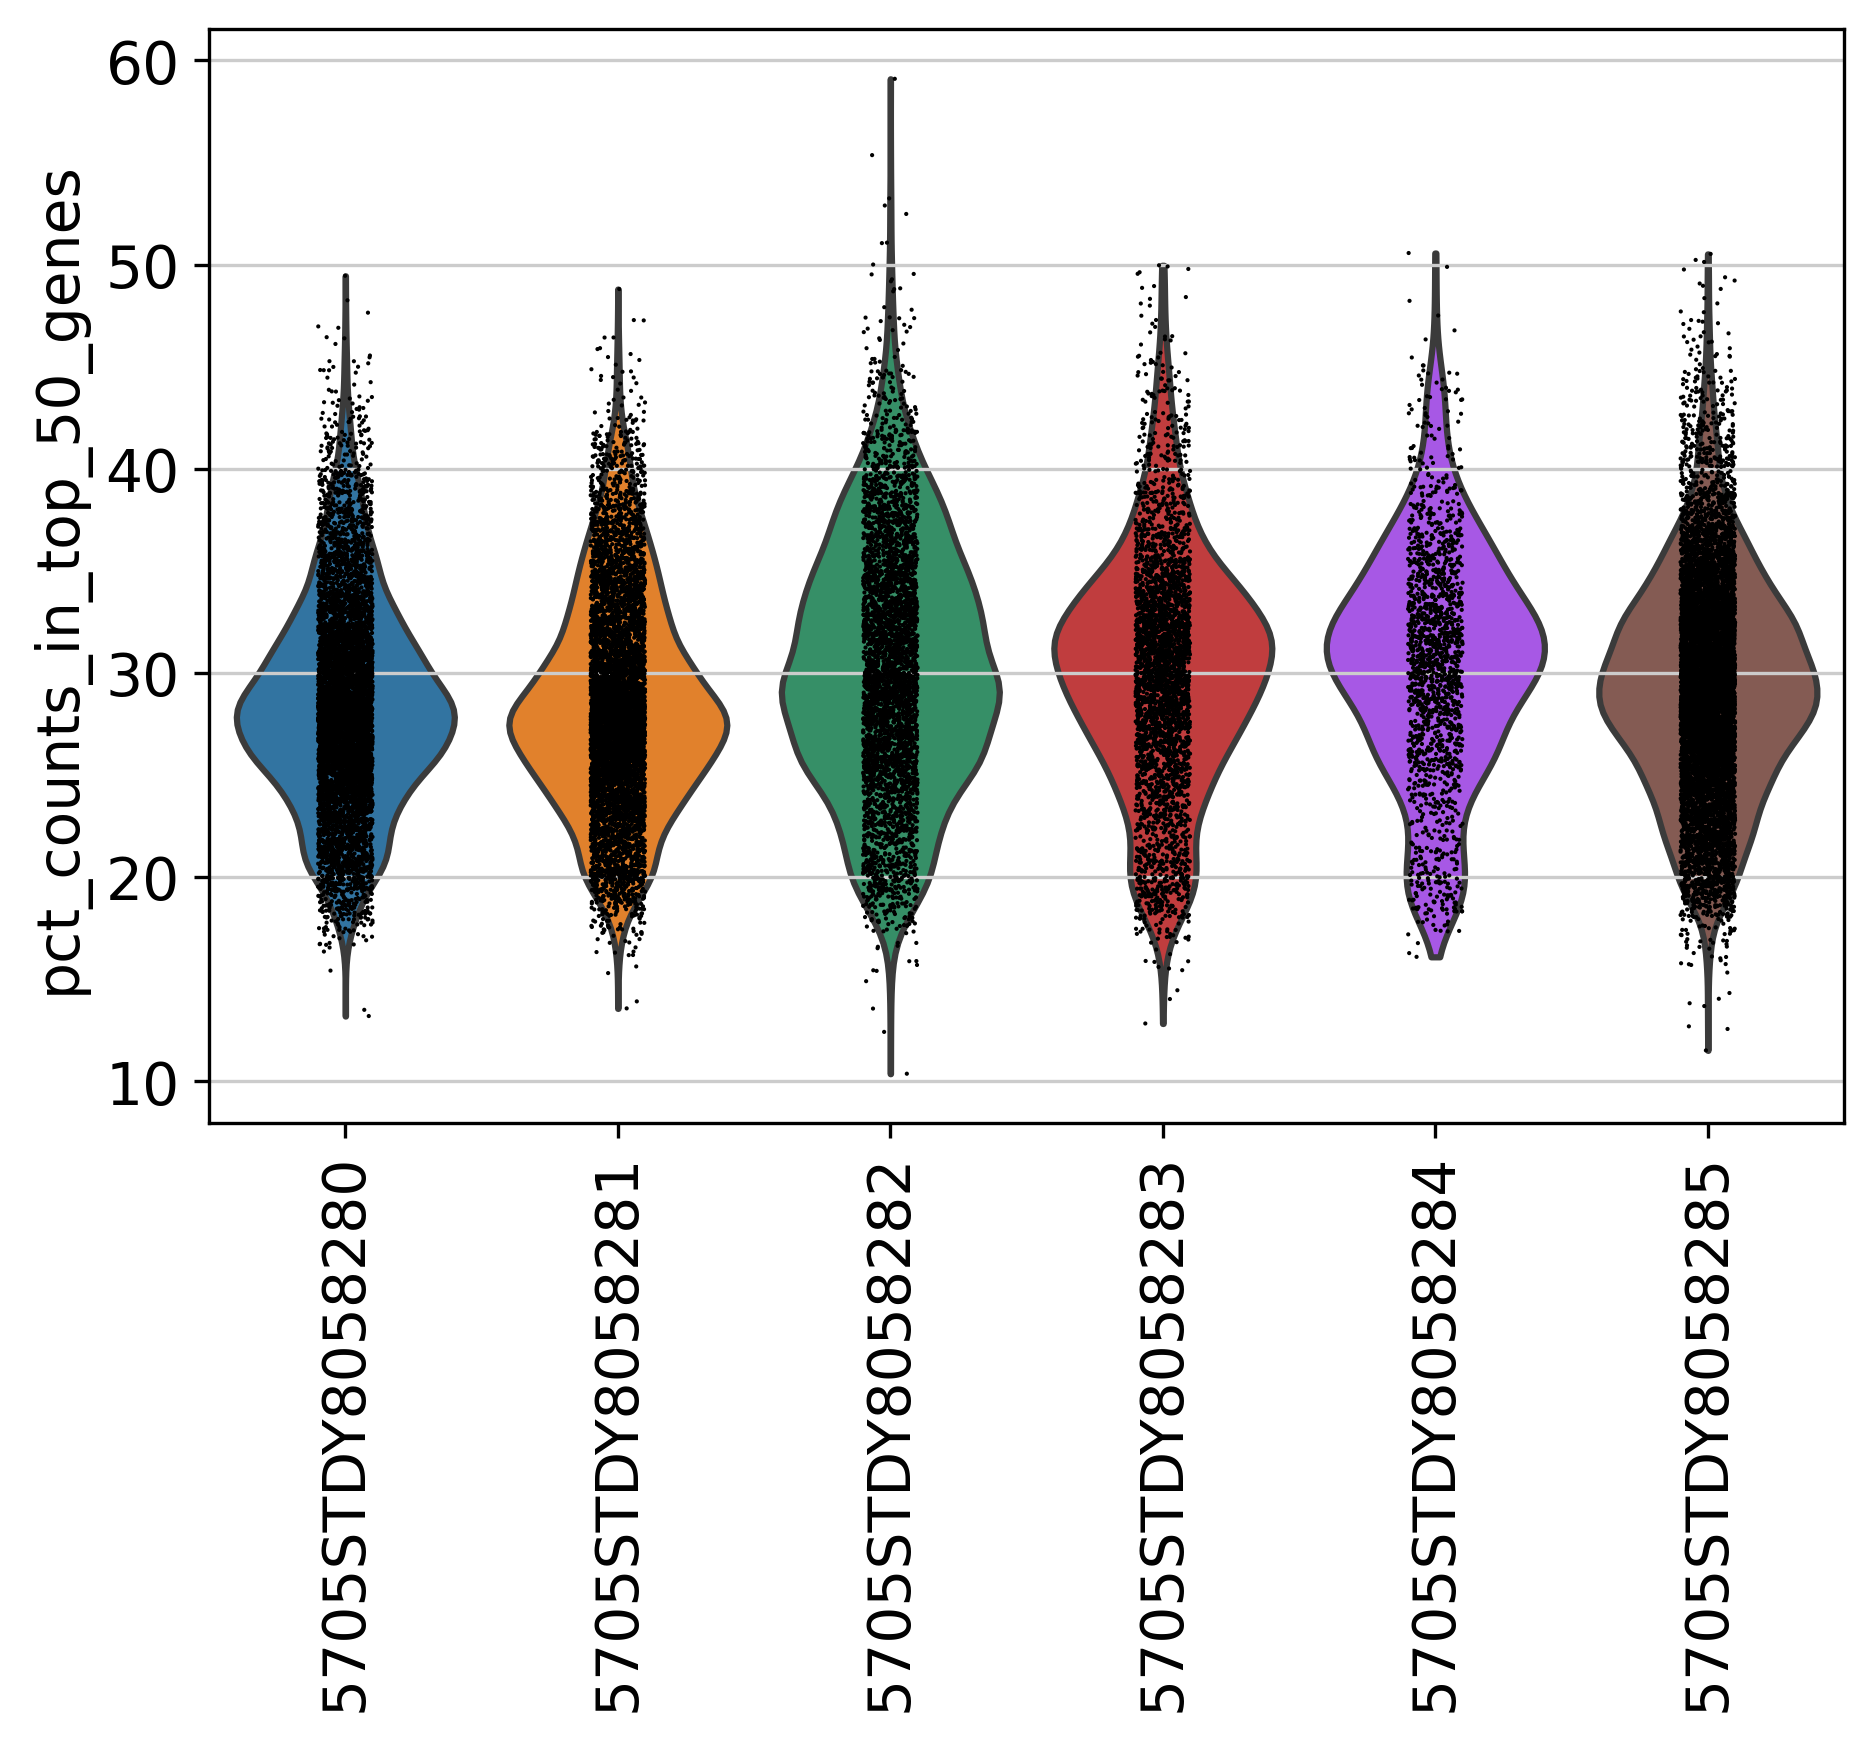
3.3 Top Genes
This plot shows Top Genes and % of Total Counts in each sample, after filtering.
Please refer to the following link for more information about top genes: https://scanpy.readthedocs.io/en/latest/generated/scanpy.pp.calculate_qc_metrics.html.
percent_top parameter: which proportions of top genes to cover. If empty or None don’t calculate. Values are considered 1-indexed, percent_top=[50] finds cumulative proportion to the 50th most expressed gene.

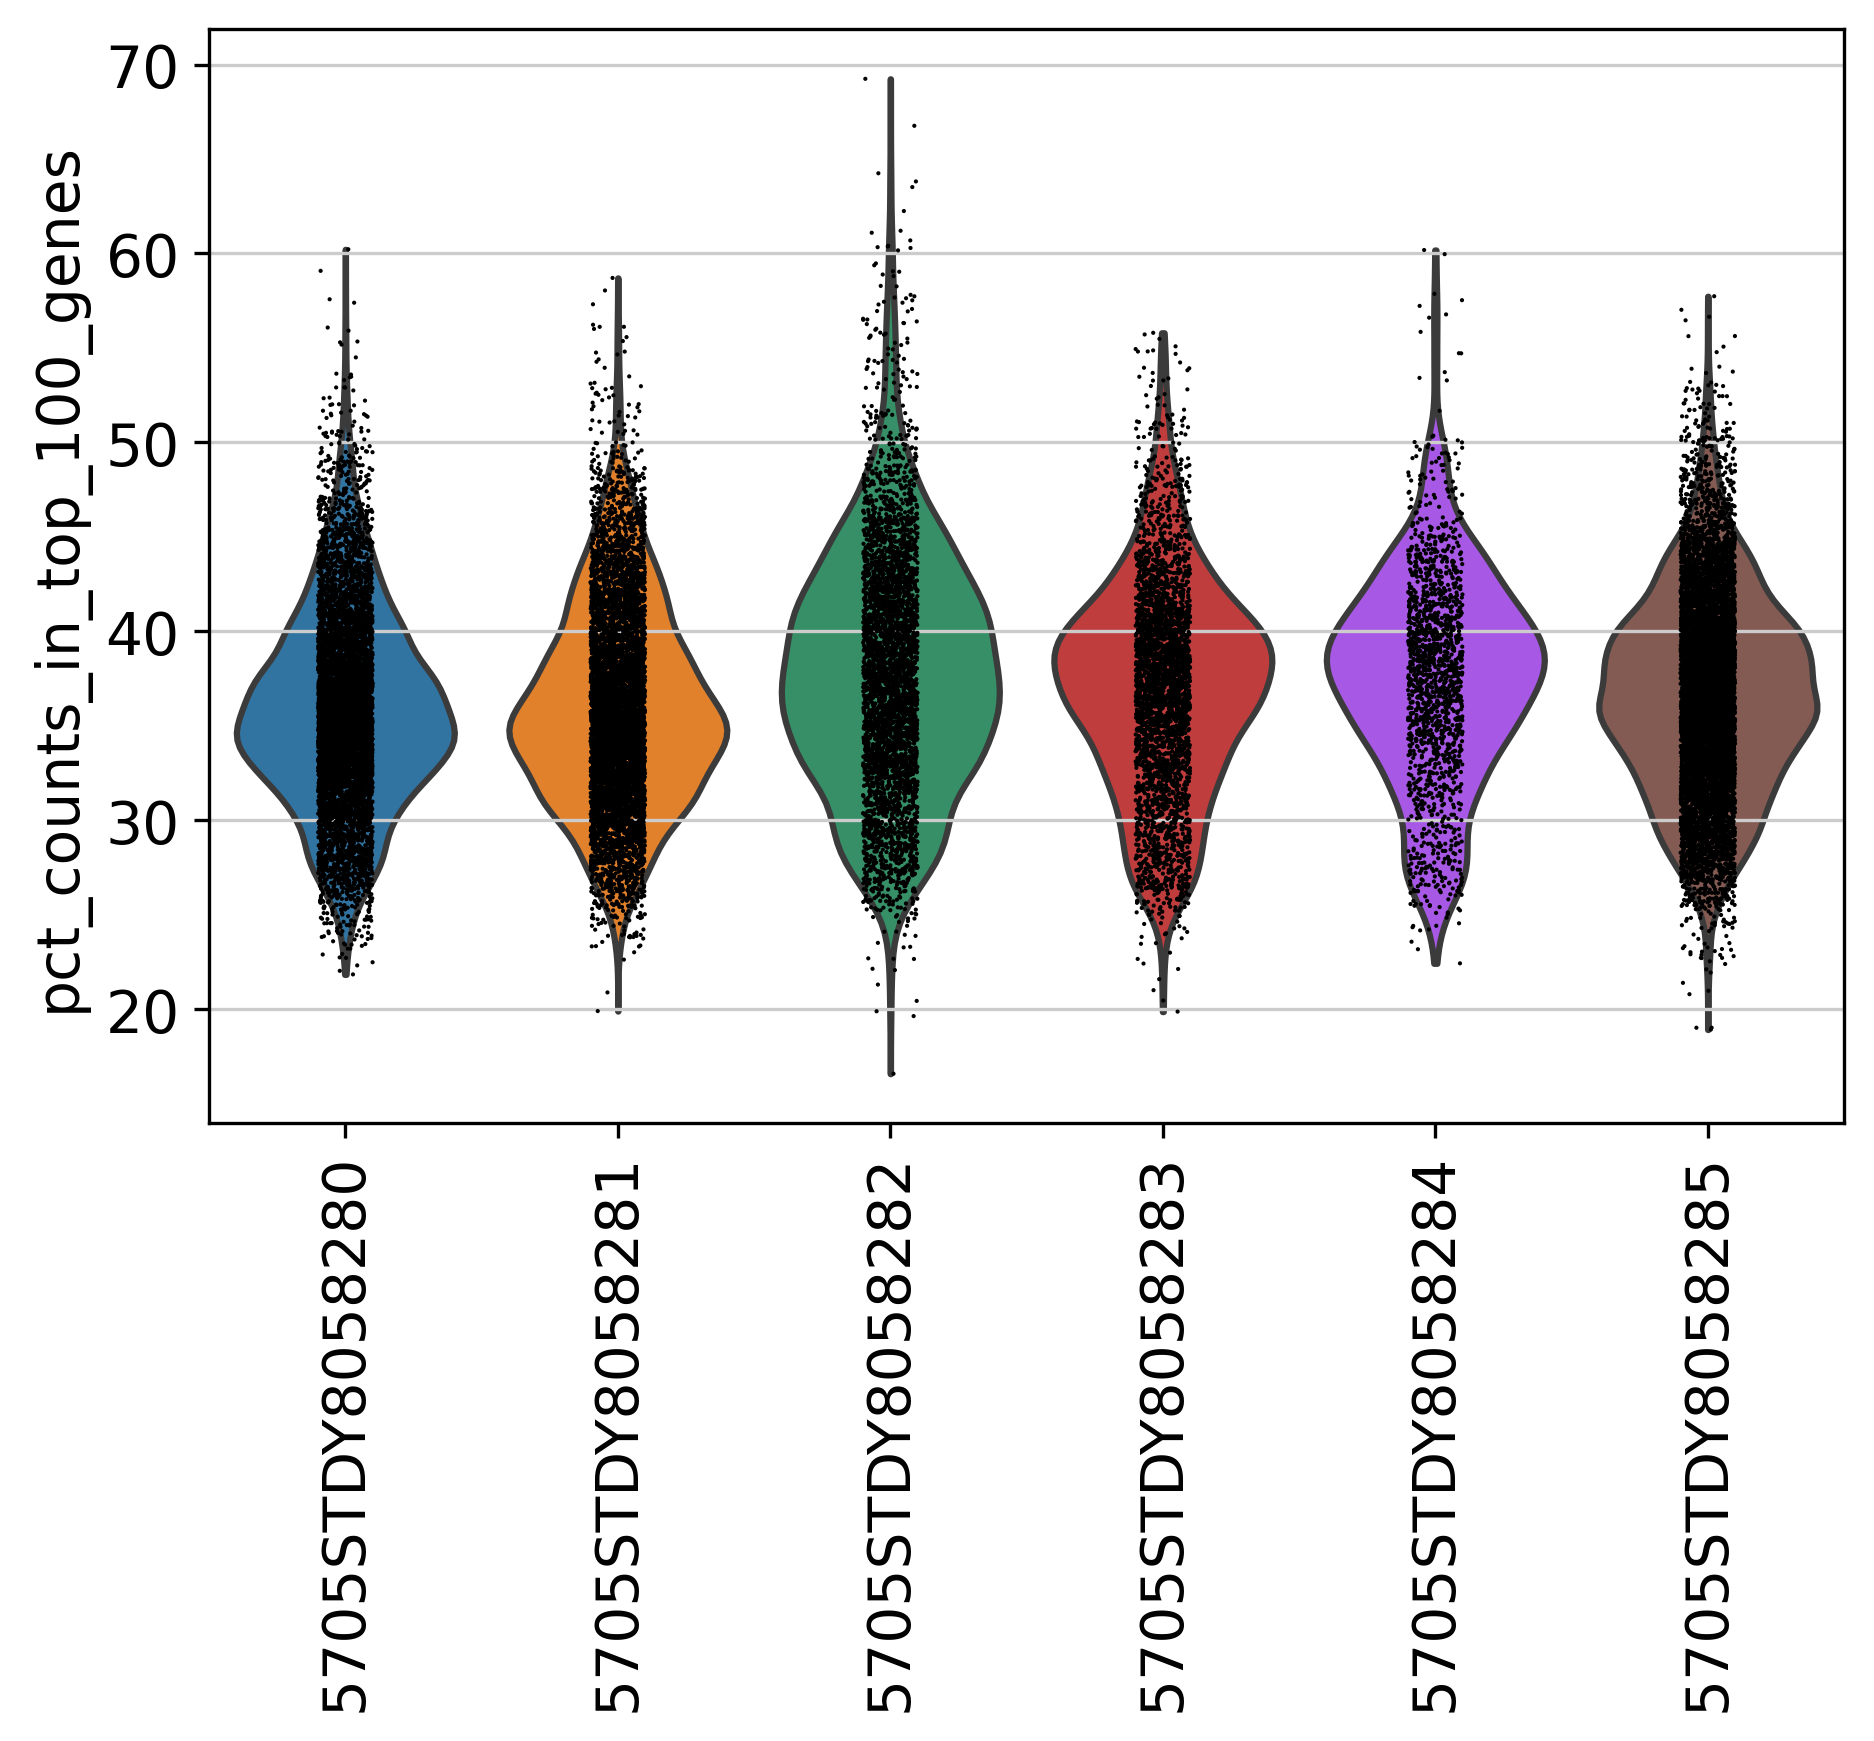
3.5 Percentage of Top 100 Genes
This plot shows % of Total Counts of top 100 genes, after filtering.
3.6 Percentage of Top 200 Genes
This plot shows % of Total Counts of top 200 genes, after filtering.