Chapter 7 Advanced plotting functions
For advanced users, EA offers versatile plotting functions to adjust your figures. Each plotting function within Plot_Functions.R has many options, mirroring the user interface from QuickOmics. Here are several examples:
7.1 PCA plot
# Load RData created from EArun
# Here is an example
# https://github.com/interactivereport/Quickomics/blob/master/data/Mouse_microglia_RNA-Seq.RData

load("data/Mouse_microglia_RNA-Seq.RData")

# Load Plot_Functions.R
# https://github.com/interactivereport/RNASequest/tree/main/src
setwd("~/RNASequest/src/")
source("Plot_Functions.R")

# Create a basic PCA Plot.
p<-PCA_Plot(data_wide, MetaData)
print(p) 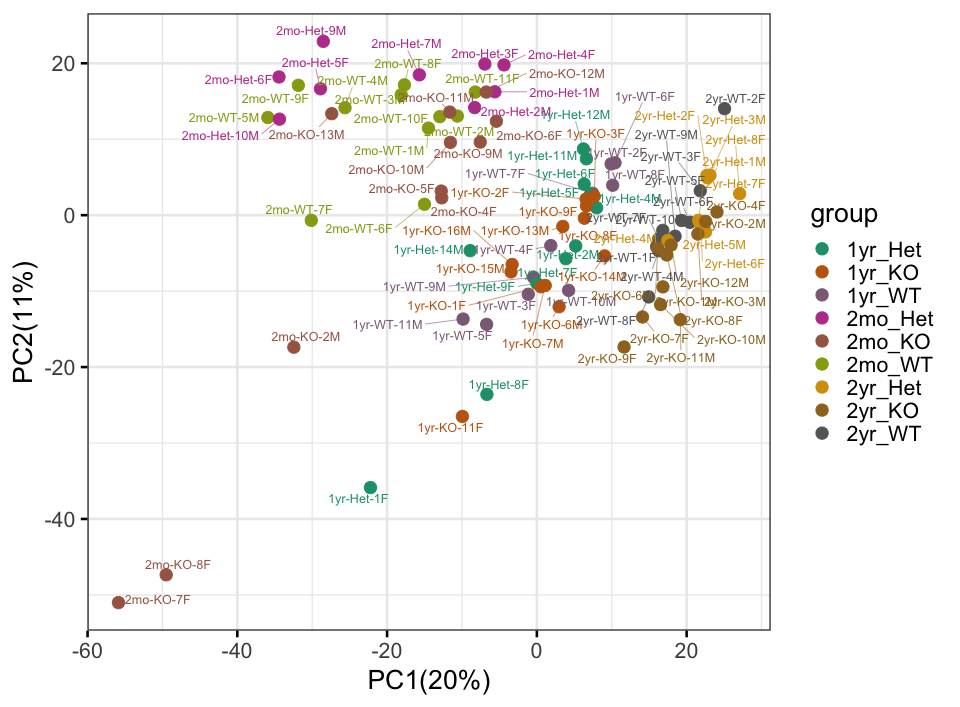
# PCA plot with additional options:
p<-PCA_Plot(data_wide, MetaData, pcnum=c(2, 3),label_samples=F,
            PCAcolorby="Age",  PCAshapeby="Genotype", ellipsoid=T, rug = T)

# Plot only selected samples:
input_samples=MetaData$sampleid[20:60]
p<-PCA_Plot(data_wide, MetaData, input_samples)
print(p)
7.2 Covariate checking
# Check covariates:
# This can be displayed as a table in R Markdown

res<-PC_covariates_out(data_wide, MetaData)
sig_covariates=res$selVar_All                 #data frame to print as table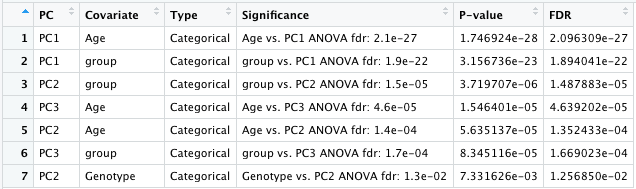
# Check covariates with more options if needed:

res<-PC_covariates_out(data_wide, MetaData, input_samples, select_covariates=c("Age", "Genotype", "Gender"),  PC_cutoff=3, FDR_cutoff=0.2)

(sig_covariates=res$selVar_All)
7.3 Volcano plot
# Loop through the comparisons.

p<-Volcano_Plot(results_long, ProteinGeneName, comparison="2yr_KOvs2yr_WT")
print(p) 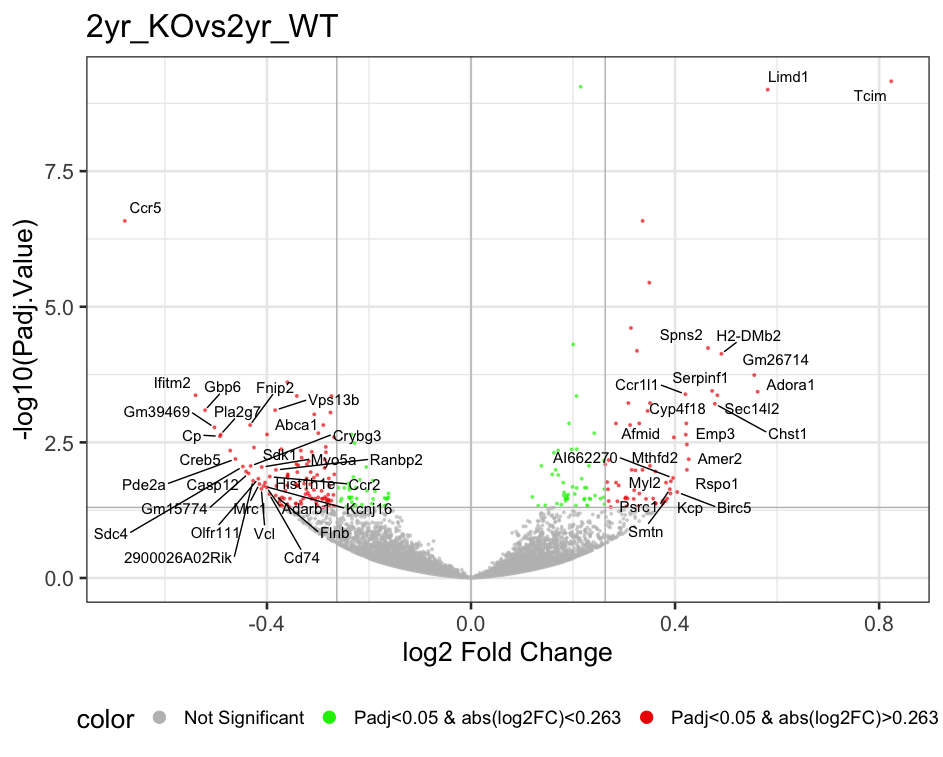
# More controls on volcano plot:

p<-Volcano_Plot(results_long, ProteinGeneName, comparison="1yr_KOvs1yr_WT", Ngenes=40, rasterize="No", vlegendpos="right",  Max_Pvalue=30, Max_logFC=1.5)
7.4 Heatmap
# Heatmap

# Overview from 1000 most variable genes

p<-Heatmap_Plot(data_wide, MetaData, results_long, ProteinGeneName,heatmap_subset="variable", maxgenes=1000)

draw(p, merge_legend=T, auto_adjust = FALSE) 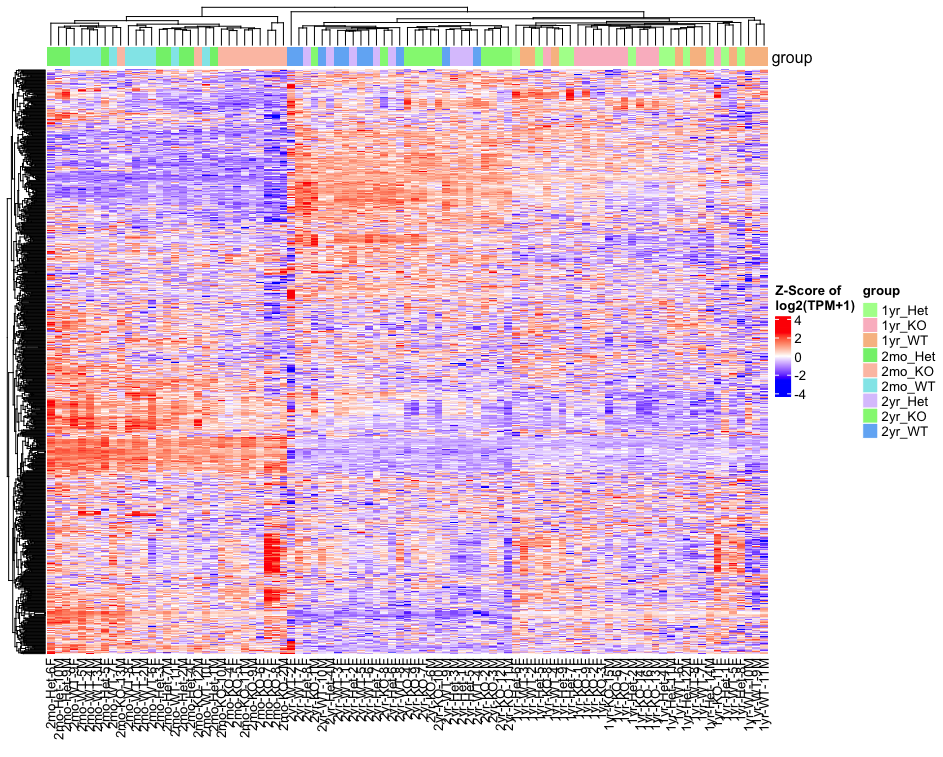
# Heatmap from DEGs of a comparison:
# This can be done for all comparisons.

p<-Heatmap_Plot(data_wide, MetaData, results_long, ProteinGeneName,heatmap_subset="subset", comparison="2yr_WTvs2mo_WT")

draw(p, merge_legend=T, auto_adjust = FALSE) 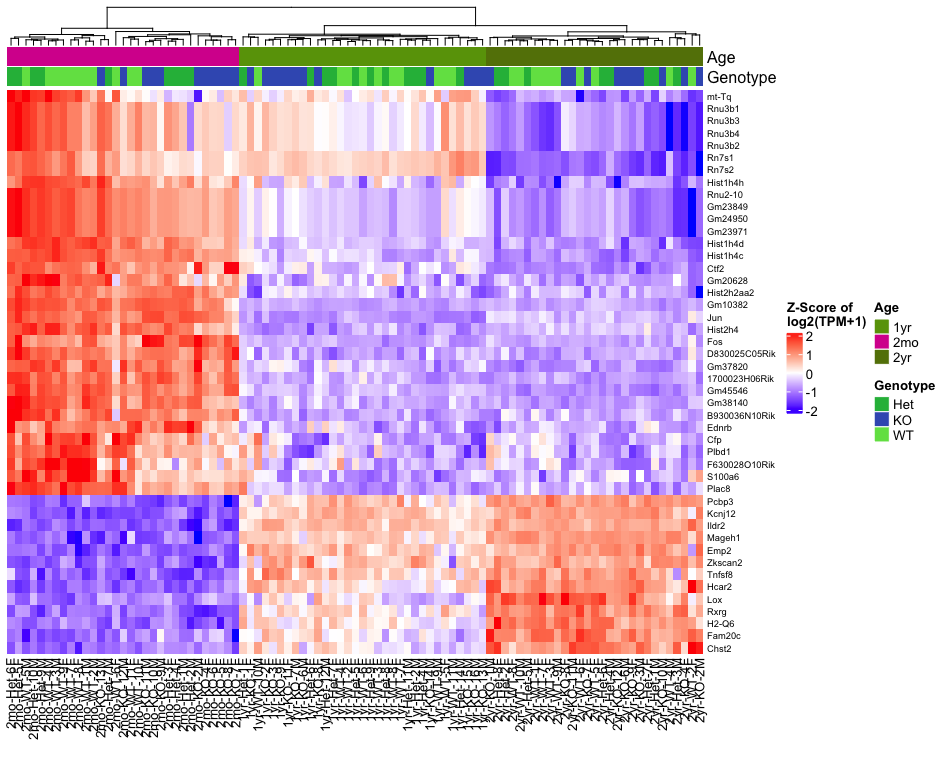
# With more options to customize the heatmap

p<-Heatmap_Plot(data_wide, MetaData, results_long, ProteinGeneName,heatmap_subset="subset", comparison="2yr_WTvs2mo_WT",  heatmap_fccut=4, heatmap_pvalcut=0.01, heatmap_psel = "Padj", heatmap_row_dend=FALSE, heatmap_annot=c("Age", "Genotype") )

draw(p, merge_legend=T,  auto_adjust = FALSE)