Chapter 4 Demo
4.1 Visium
Demo run directory: ~/SpaceSequest_demo/1_Visium
Demo data: 10x Visium data are from mouse brain (paper, and GEO record). A single-cell RNA-seq reference was created using the Azimuth mouse brain cortex reference
#First step, generate config and sampleMeta file

visium ~/SpaceSequest_demo/1_Visium
After this step, fill in the config.yml file and the sample.csv file (Click the superlink to view the example). Please pay attention to the required items in the config.yml file as they are essential for the pipeline to run.
#Highlighting several key items:

prj_name: Visium_demo        #Prefix of the final output

output: ~/SpaceSequest_demo/1_Visium/Run_pipeline

methods: [SpaGCN,BayesSpace,cell2location,tangram,SpaTalk]  #Software to run

#cell2location setting. This is for cell type deconvolution using a reference single-cell RNA-seq data

scH5ad: ~/SpaceSequest_demo/1_Visium/Input_data/Demo_PSAPP.3Rep.Azimuth.Reference.h5ad

annotation_obs: Cell_type

# tangram setting

tg_scH5ad: ~/SpaceSequest_demo/1_Visium/Input_data/Demo_PSAPP.3Rep.Azimuth.Reference.h5ad

tg_annotation_obs: Cell_type

# SpaTalk seting

st_scH5ad: ~/SpaceSequest_demo/1_Visium/Input_data/Demo_PSAPP.3Rep.Azimuth.Reference.h5ad

st_annotation_obs: Cell_type

#Parallel setting

parallel: "slurm"    #Use "slurm" for Edge HPC

core: 10

memory: 50G   #if provided (e.g. 100G), it will be used to request cluster scheduler

jobID: j47   # please make sure this job id is different with your other projects which would be run at the same time
For the sample.csv file, the first two columns (Sample_Name,SpaceRanger_path) are required, and here we added two more columns:
Sample_Name,SpaceRanger_path,Treatment,Image_hires

PSAPP-CO1,/path/to/PSAPP-CO1/outs,Control,/path/to/PSAPP-CO1-image.png

PSAPP-TAM1,/path/to/PSAPP-TAM1/outs,Control,/path/to/PSAPP-TAM1-image.png
Then, move the config.yml and sample.csv into a new folder called Run_pipeline, and run the visium script by passing the config.yml to it:
#Run the data

visium ~/SpaceSequest_demo/1_Visium/Run_pipeline/config.yml
Finally, you can check the results in the output directory. For each method, it generated a folder to store the results, for example: BayesSpace, SpaGCN, SpaTalk. If there were any errors occurred, you can check the j47 folder to see the original scripts and error messages.
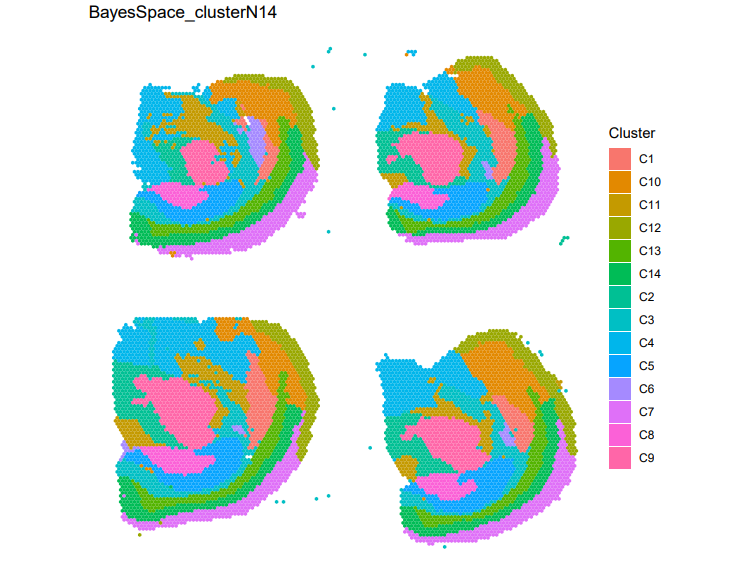 Figure 1. Clustering results generated by BayesSpace for the Visium spatial transcriptomics dataset.
4.2 Xenium
Demo run directory: ~/SpaceSequest_demo/2_Xenium
Demo data: FFPE Human Brain data from 10x: https://www.10xgenomics.com/datasets/xenium-human-brain-preview-data-1-standard
The Xenium raw data is stored at ~/SpaceSequest_demo/2_Xenium/data with h5, cell_boundaries, transcripts, etc. This directory needs to be specified in the sampleMeta.csv file, which will be mentioned later.
#First step, generate config and sampleMeta file

xenium ~/SpaceSequest_demo/2_Xenium
After this step, fill in the config.yml file and the sampleMeta.csv file as below. Please pay attention to the required items in the config.yml file as they are essential for the pipeline to run:
#Highlighting several key items:

project_ID: Xenium_demo  #required

sampleMeta: /edgehpc/dept/compbio/projects/SpaceSequest_demo/2_Xenium/sampleMeta.csv  #path to the sampleMeta file, required. It will create this dir for you if it doesn't exist

output_dir: /edgehpc/dept/compbio/projects/SpaceSequest_demo/2_Xenium/output   #output directory, required

cluster_resolution: 0.3   #resolution for the FindClusters step

reference: humancortexref   #Azimuth reference, for example, 'humancortexref', optional

reference_name: subclass   #column name of the cell type label you would like to transfer. Required if reference is used.

integrate_data: True   #True or False to merge/integrate all the data in the sampleMeta file

integrate_with_harmony: True   #True or False to use Harmony for integration. Default as True
For the sampleMeta.csv file, the first two columns are required: Sample and Directory. Users can add more metadata columns as shown below:
Sample,Directory,Tissue,Species

Human_brain,/edgehpc/dept/compbio/projects/SpaceSequest/Xemuim_public/data,Brain,Human
Then we can run the xenium script by passing the config.yml to it. We suggest submitting the command using sbatch:
#Run the data

xenium /edgehpc/dept/compbio/projects/SpaceSequest_demo/1_Visium/config.yml
The pipeline will process/QC the data, run clustering and cell type annotation (if reference provided), and finally return an integrated Rdata file. All plots and files are stored in the output_dir directory specified in the config.yml file.
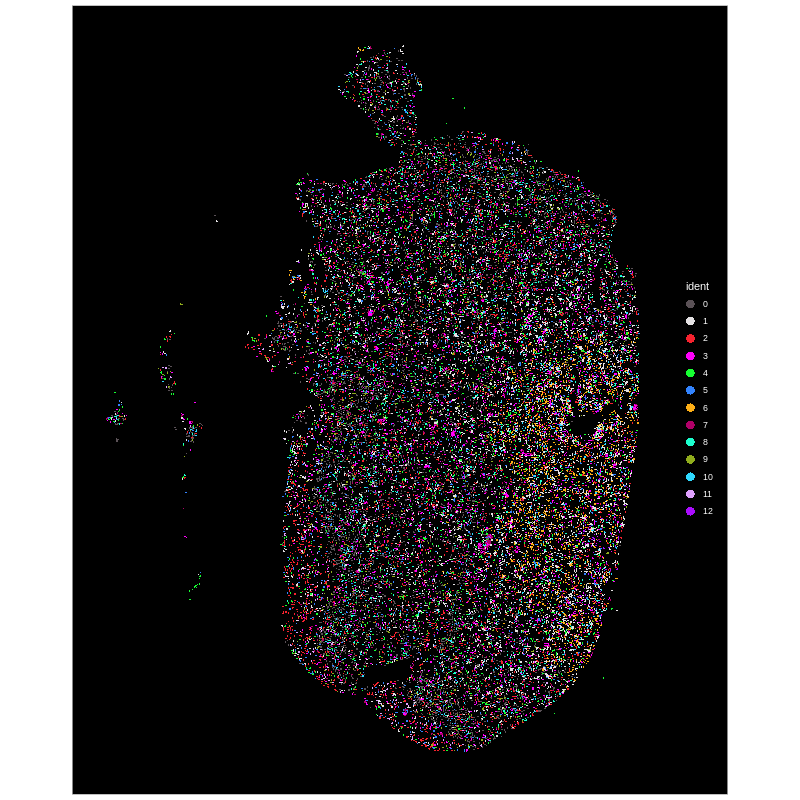
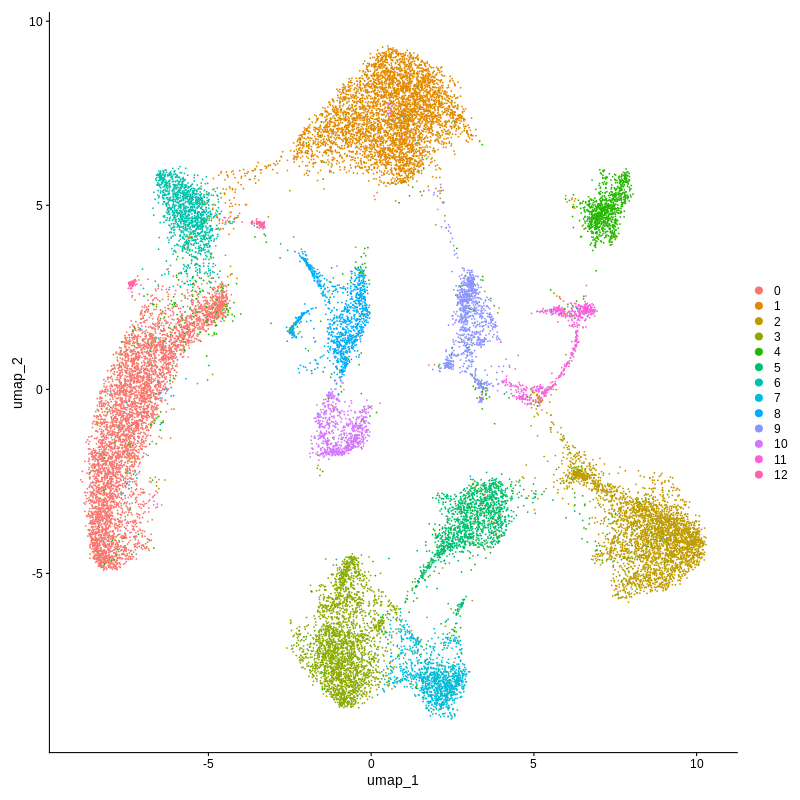
Figure 2. Xenium spatial-transcriptomics output. (Left) Tissue image with capture spots overlaid. (Right) UMAP embedding of spatial barcodes coloured by cluster.
4.3 VisiumHD
Demo run directory: /edgehpc/dept/compbio/projects/SpaceSequest_demo/3_VisiumHD
Demo data were downloaded from 10X genomics website, and stored in the above directory.
Sample1: Mouse brain FFPE: https://www.10xgenomics.com/datasets/visium-hd-cytassist-gene-expression-libraries-of-mouse-brain-he
Sample2: Mouse brain fixed frozen: https://www.10xgenomics.com/datasets/visium-hd-cytassist-gene-expression-mouse-brain-fixed-frozen
#First step, generate config and sampleMeta file

visiumhd /edgehpc/dept/compbio/projects/SpaceSequest_demo/3_VisiumHD
After this step, fill in the config.yml file and the sampleMeta.csv file as below.
project_ID: VisiumHD_demo     #required

sampleMeta: /edgehpc/dept/compbio/projects/SpaceSequest_demo/3_VisiumHD/sampleMeta.csv      #path to the sampleMeta file

output_dir: /edgehpc/dept/compbio/projects/SpaceSequest_demo/3_VisiumHD/output     #output directory

bin_resolution: 8um   #defaul 8um, also 16um or 2um are available

cluster_resolution: 0.3      #resolution for the FindClusters step

reference: /edgehpc/dept/compbio/projects/SpaceSequest_demo/3_VisiumHD/Reference/allen_mop_2020.rds  #path to an Azimuth reference data, optional

reference_name: subclass     #column name of the cell type label you would like to transfer

integrate_data: True        #True or False to merge/integrate all the data in the sampleMeta file

integrate_with_harmony: True  #True or False to use Harmony for integration. Default as True
The sampleMeta.csv file contains file name and path to the Space Ranger output. It needs to have the h5 files and binned_outputs inside:
Sample,Directory

Mouse_brain_FFPE,/edgehpc/dept/compbio/projects/SpaceSequest_demo/3_VisiumHD/Sample1_FFPE

Mouse_brain_FixedFrozen,/edgehpc/dept/compbio/projects/SpaceSequest_demo/3_VisiumHD/Sample2_Fixed
Finally submit the following command using sbatch:
#Run the data

visiumhd /edgehpc/dept/compbio/projects/SpaceSequest_demo/3_VisiumHD/config.yml
Finally check the results in the output_dir folder specified in the config.yml file. The output files contain some plots (QC plots, UMAP), and Rdata files storing the results.
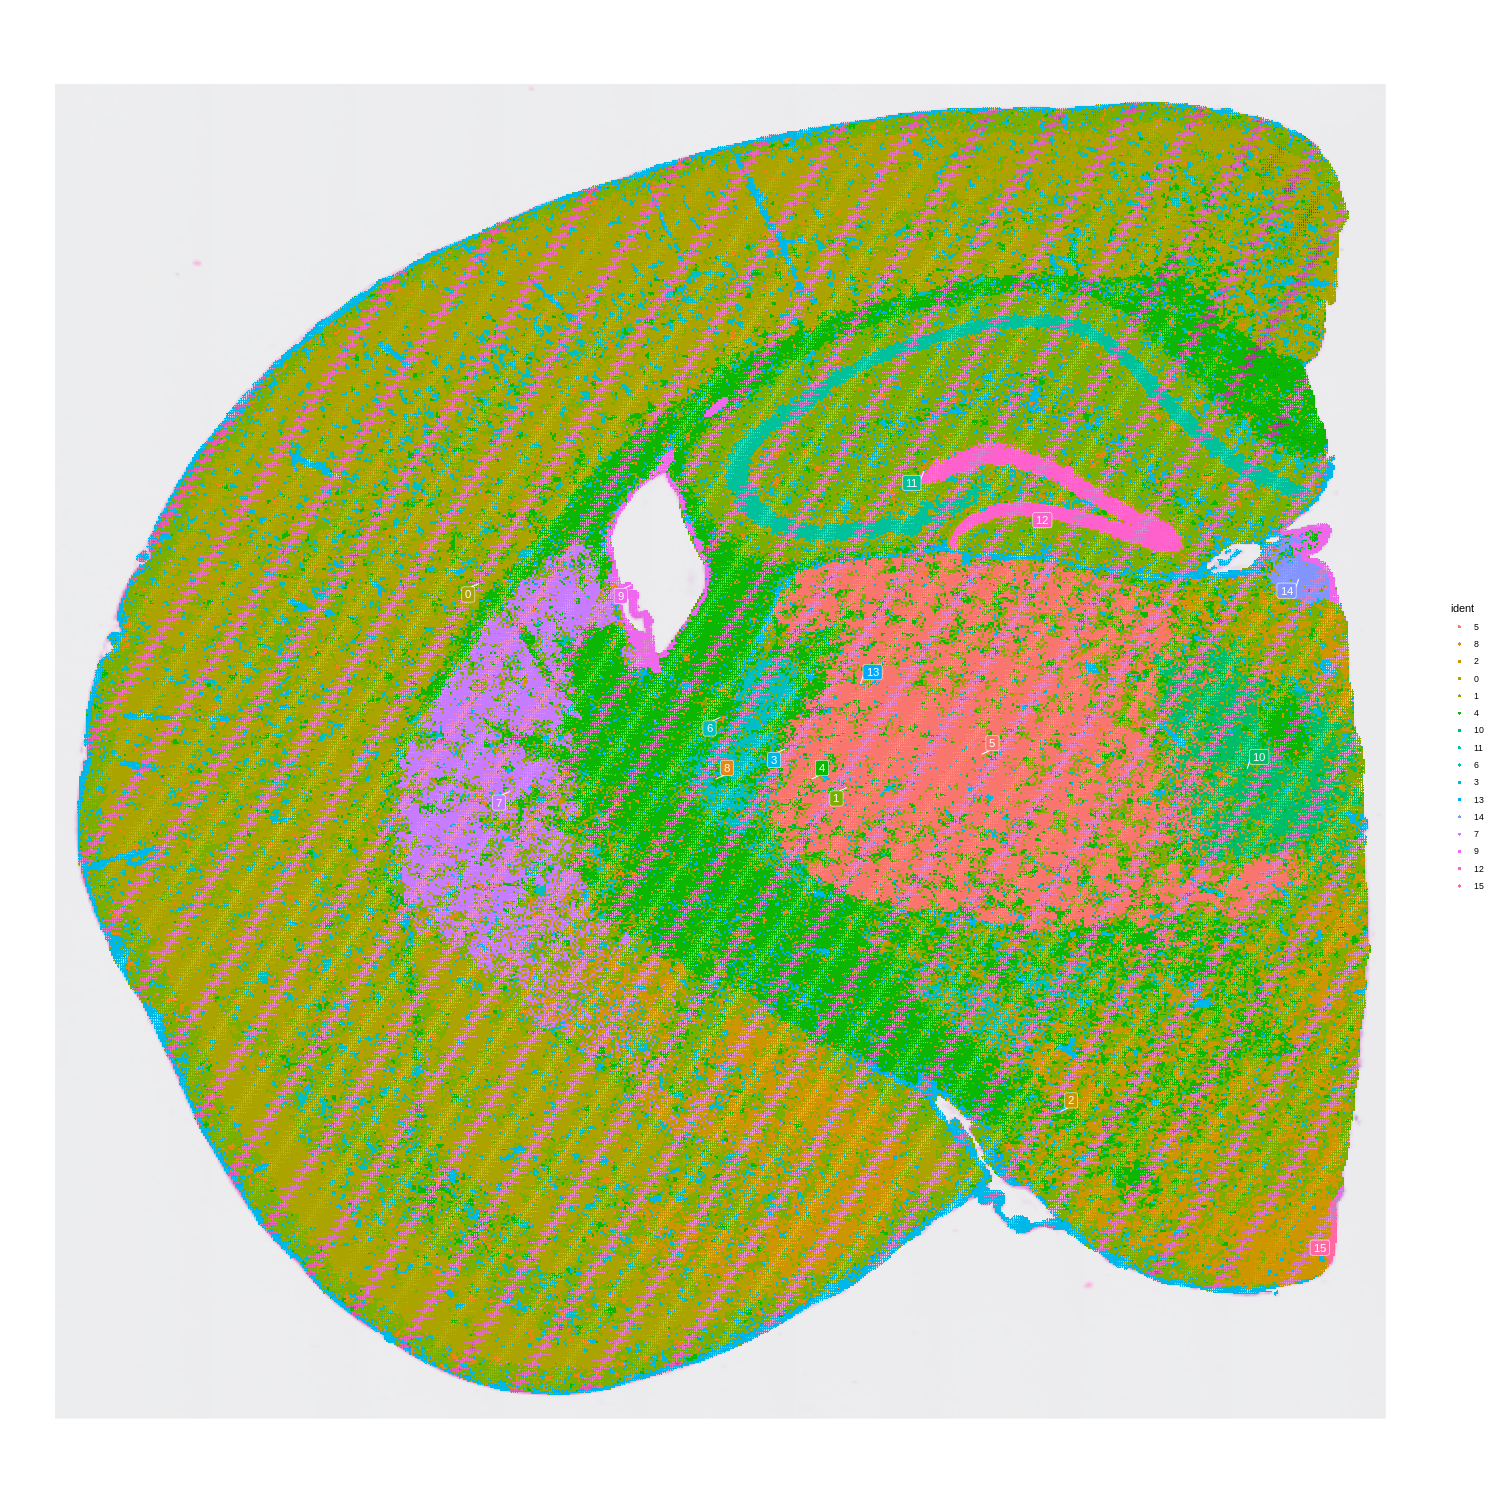
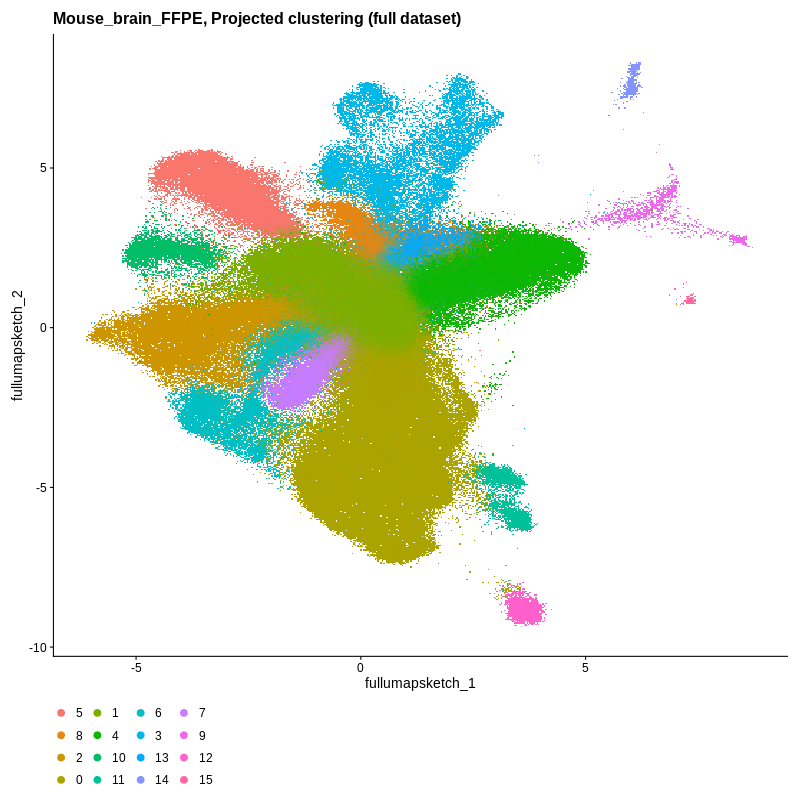
Figure 3. Visium HD spatial-transcriptomics output. (Left) Tissue image with capture spots overlaid. (Right) UMAP embedding of spatial barcodes colored by cluster.
4.4 GeoMX
Demo run directory: /edgehpc/dept/compbio/projects/SpaceSequest_demo/4_GeoMx
Demo dataset is a public data provided by NanoString: http://nanostring-public-share.s3-website-us-west-2.amazonaws.com/GeoScriptHub/Kidney_Dataset_for_GeomxTools.zip
This is a kidney dataset, and in our demo run, we will run data processing, quality control, and differential expression analysis by comparing two kidney cell types: Glomerulus v.s. Tubule
First, we initiate the pipeline using the following script. This will generate templates of config.yml and compareInfo.csv:
#First step, generate config and sampleMeta file

geomx /edgehpc/dept/compbio/projects/SpaceSequest_demo/4_GeoMx
After this step, fill in the config.yml file and the sampleMeta.csv file as below:
#config file for GeoMx. Please avoid using spaces in names or paths. All items are required.

project_ID: GeoMx_demo  #name of the project

data_path: /edgehpc/dept/compbio/projects/SpaceSequest_demo/4_GeoMx/Kidney_Dataset/dccs    #path to DCC files

data_annotation: /edgehpc/dept/compbio/projects/SpaceSequest_demo/4_GeoMx/Kidney_Dataset/annotation/kidney_demo_AOI_Annotations_selected_clean.xlsx        #sample meta information

annotation_sheet: Template      #Sheet name of annotation Excel file

pkcs_file: /edgehpc/dept/compbio/projects/SpaceSequest_demo/4_GeoMx/Kidney_Dataset/pkcs/TAP_H_WTA_v1.0.pkc       #path to the pkc file

output_dir: /edgehpc/dept/compbio/projects/SpaceSequest_demo/4_GeoMx/results      #path for output files

comparison: /edgehpc/dept/compbio/projects/SpaceSequest_demo/4_GeoMx/compareInfo.csv   #comparison file to define DE groups

quickomics: True
Then prepare the compareInfo.csv file to define differential expression analysis comparisons:
CompareName,Model,Group_name,Group_test,Group_ctrl,Analysis_method

Glome_vs_Tubule,~region,region,glomerulus,tubule,Linear
Currently, we only support running a Linear model to compare two conditions, without covariate adjustments. More DE methods will be added later.
Run the pipeline as below:
#Run the data

geomx /edgehpc/dept/compbio/projects/SpaceSequest_demo/4_GeoMx/config.yml
Finally check the results in the output_dir folder specified in the config.yml file. The output files contain DE analysis results, and if Quickomics parameter was set to True, it will create mutiple .csv files to create a Quickomics visualization link. An example can be found here (Q3 normalized values were used to create the link): http://compbio.biogen.com:3838/Quickomics/?unlisted=PRJ_GeoMx_demo_Ij4YyG
4.5 CosMX
Demo run directory: /edgehpc/dept/compbio/projects/SpaceSequest_demo/5_CosMx
Demo run dataset: a public data provided by NanoString, human frontal cortex FFPE: https://nanostring.com/products/cosmx-spatial-molecular-imager/ffpe-dataset/human-frontal-cortex-ffpe-dataset/
To test the data integration function, I duplicated this data to two same datasets: S3 and S4, stored under the data folder in the 5_CosMx directory.
First, we initiate the pipeline using the following script. This will generate templates of config.yml and sampleMeta.csv:
#First step, generate config and sampleMeta file

cosmx /edgehpc/dept/compbio/projects/SpaceSequest_demo/5_CosMx
Then, fill in the config.yml file and the sampleMeta.csv file as below:
#config file for CosMx. Please avoid using spaces in names or paths. All items are required.

project_ID: CoxMx_demo      #required project name

sampleMeta: /edgehpc/dept/compbio/projects/SpaceSequest_demo/5_CosMx/sampleMeta.csv         #path to the sampleMeta file

output_dir: /edgehpc/dept/compbio/projects/SpaceSequest_demo/5_CosMx/output        #output directory

cluster_resolution: 0.3   #resolution for the FindClusters step, default 0.3

reference: humancortexref      #Azimuth reference name, optional

reference_name: subclass      #column name of the cell type label you would like to transfer. Required when reference is used.

integrate_data: True       #True or False to merge/integrate all the data in the sampleMeta file

integrate_with_harmony: True       #True or False to use Harmony for integration. Default as True
The sampleMeta.csv file contains sample name and several key input files of CosMx:
Sample,Directory,exprMat_file,fov_file,metadata_file,tx_file,polygon_file

S3,/edgehpc/dept/compbio/projects/SpaceSequest_demo/5_CosMx/data/S3,S3_exprMat_file.csv,S3_fov_positions_file.csv,S3_metadata_file.csv,S3_tx_file.csv,S3-polygons.csv

S4,/edgehpc/dept/compbio/projects/SpaceSequest_demo/5_CosMx/data/S4,S4_exprMat_file.csv,S4_fov_positions_file.csv,S4_metadata_file.csv,S4_tx_file.csv,S4-polygons.csv
Then run the pipeline as below:
#Run the data

cosmx /edgehpc/dept/compbio/projects/SpaceSequest_demo/5_CosMx/config.yml
Finally check the results in the output_dir folder specified in the config.yml file. The output files contain some plots (UMAP for original cluster and annotated cell types), and Rdata files storing the results.
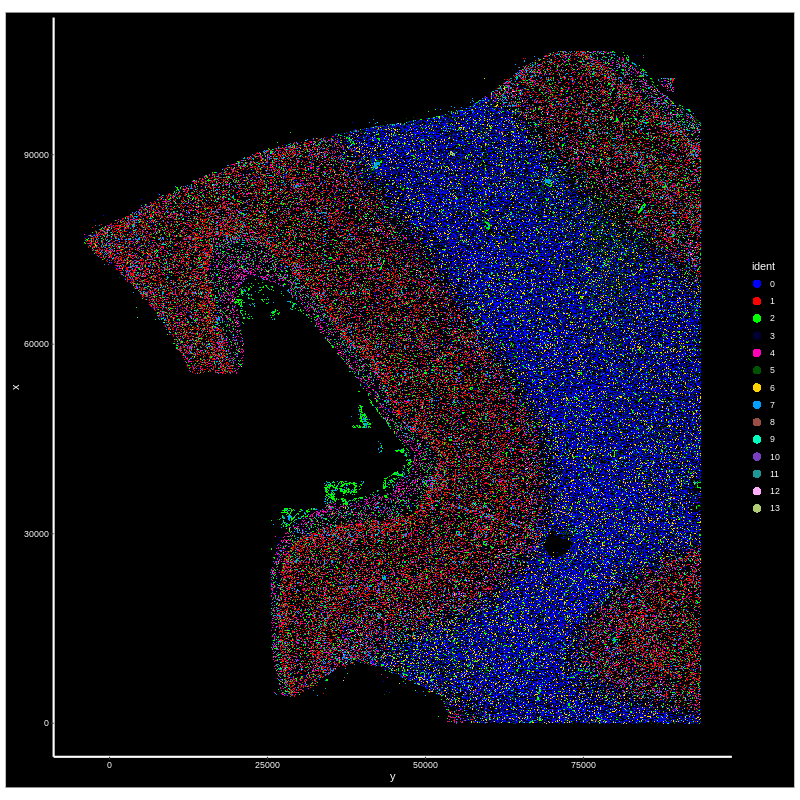
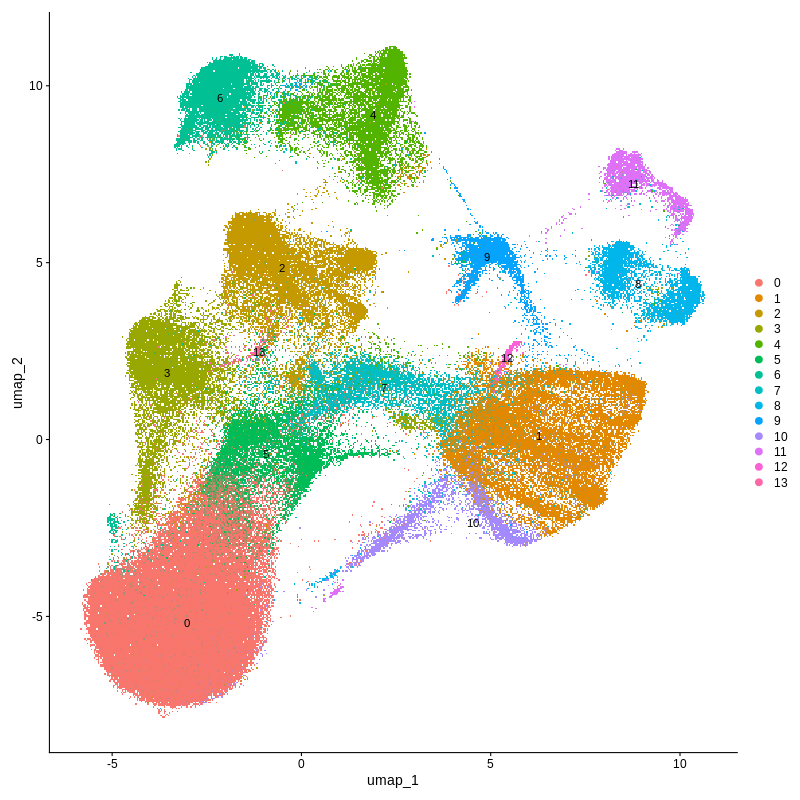
Figure 4. CosMX spatial-transcriptomics output. (Left) Tissue image with capture spots overlaid. (Right) UMAP embedding of spatial barcodes colored by cluster.