Chapter 2 Covariates
This Covariates chapter provides flexibility to visualize the covariates in the current dataset, such as Age, Group, Genotype, etc. This dynamic table contains several columns, including the PC, Covariate, Type, Significance, p-value, and FDR for each covariate listed.
The PC column shows the principal component that the covariate belongs to. We will see the same covariate name appears in different PC, such as PC1 and PC2, with different Significance.
The Covariate column displays the name of each covariate, and the terms are self-explainable. For example, some covariates are the sample annotation of the dataset, such as Age, Group, Genotype. On the other hand, some covariates are related to the data analysis steps, such as the metrics from the genome mapping step. If the data is downloaded from GEO and incorporated into the pipeline using recount3, metrics from the recount3 pipeline will also show up in the Covariate column.
The Type column indicates the type of each covariate. Covariates can be Numeric or Categorical types.
The Significance column lists the ANOVA FDR information between each covariate v.s. PC. For Numeric covariates, an r value is associated with each ANOVA test. However, for Categorical covariates, only FDR values are displayed.
The last two columns, P-value and FDR, indicate the results of statistical tests (P-value) and adjusted P-values.
2.1 List of covariates
| PC | Covariate | Type | Significance | P-value | FDR |
|---|---|---|---|---|---|
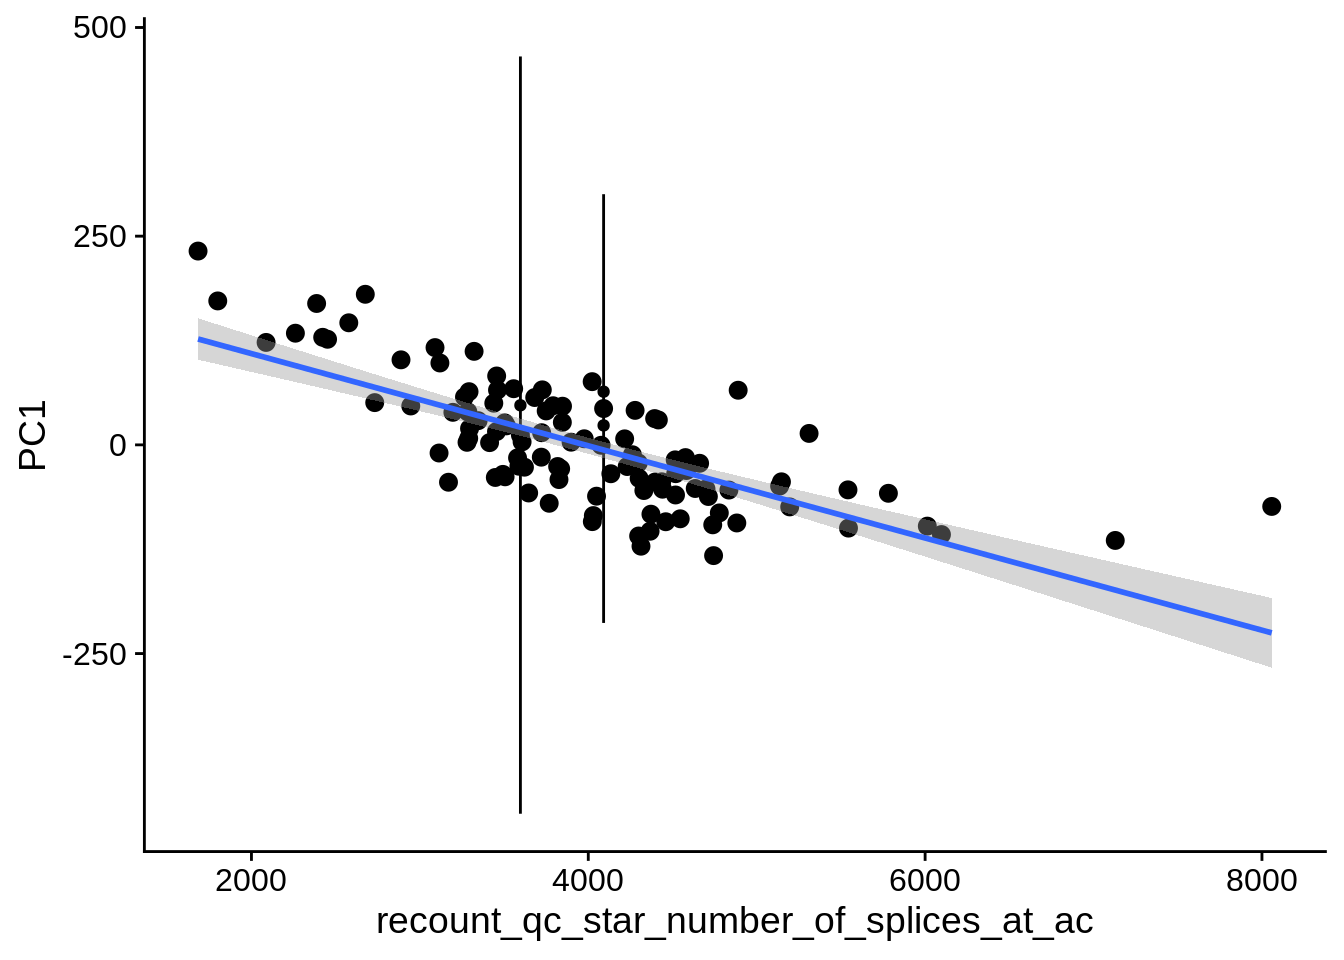
| PC1 | recount_qc_star_number_of_splices_at_ac | Numeric | recount_qc_star_number_of_splices_at_ac vs. PC1: r=-0.544; fdr=2.7e-07 | 0.0000000 | 0.0000003 |
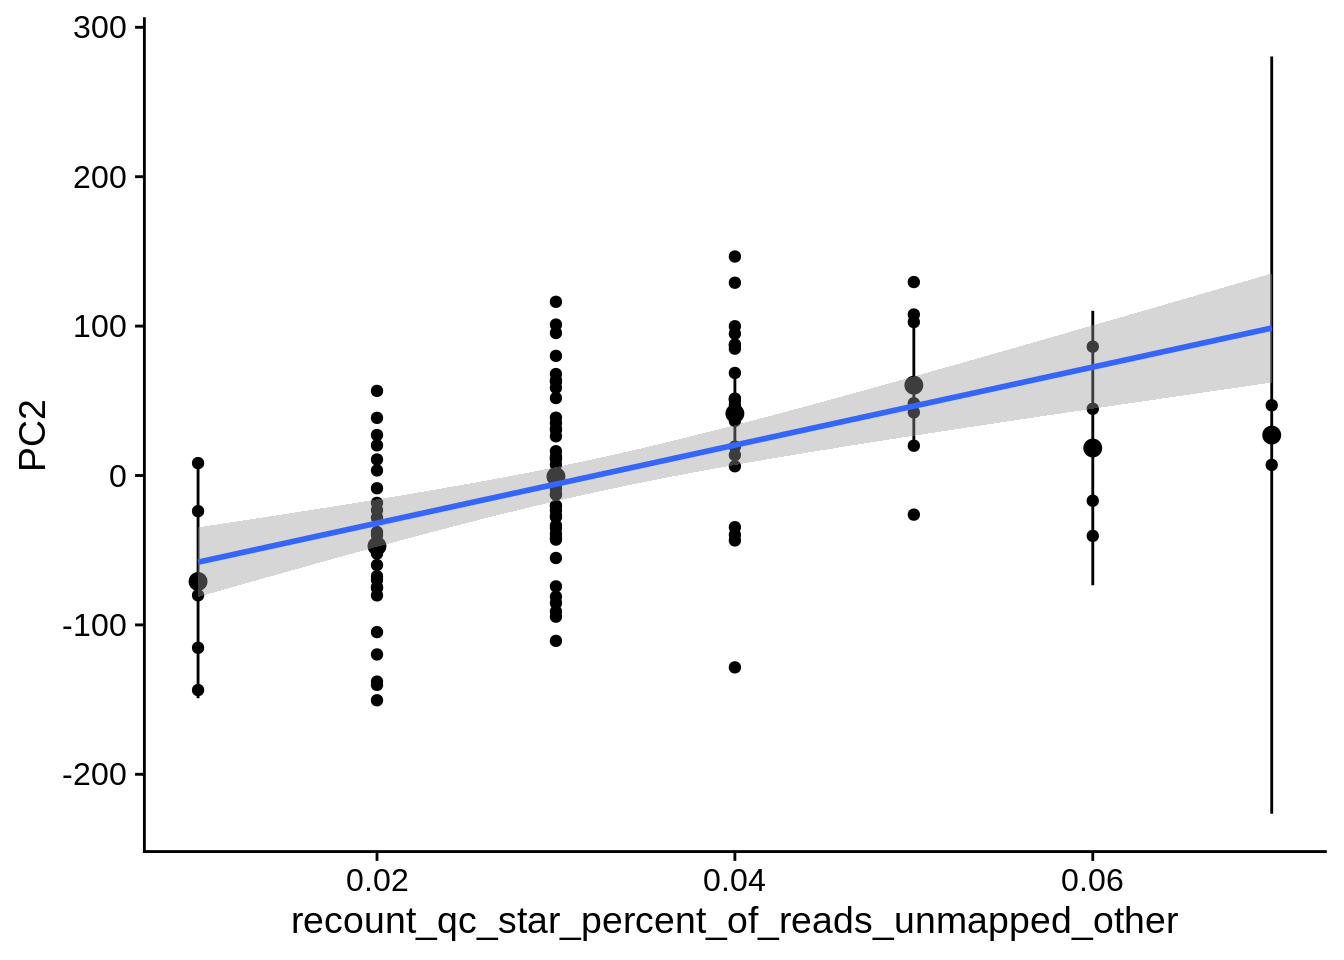
| PC2 | recount_qc_star_percent_of_reads_unmapped_other | Numeric | recount_qc_star_percent_of_reads_unmapped_other vs. PC2: r=0.408; fdr=1.4e-03 | 0.0000104 | 0.0014013 |
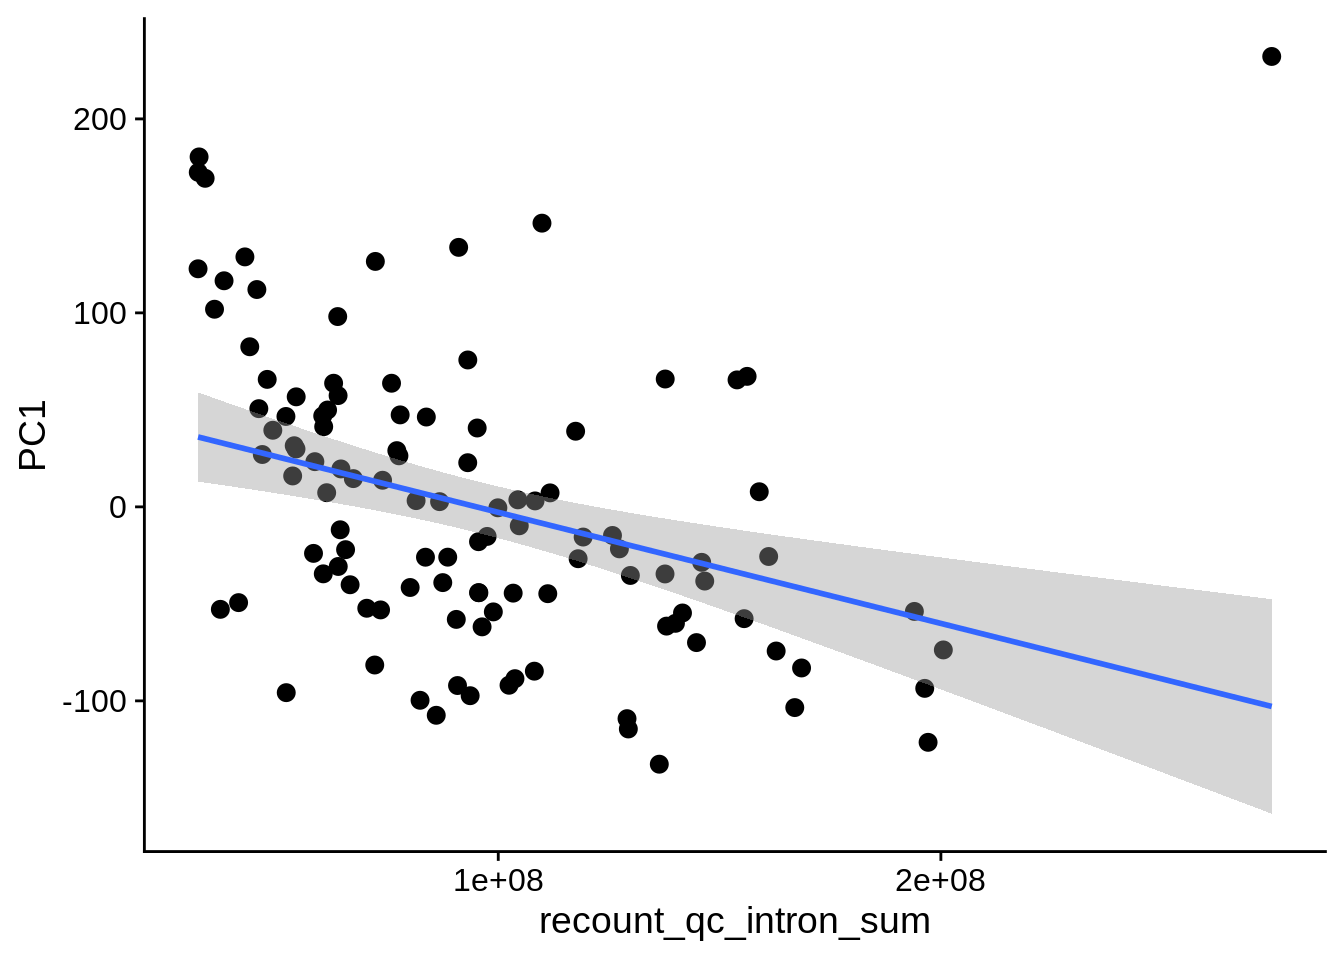
| PC1 | recount_qc_intron_sum | Numeric | recount_qc_intron_sum vs. PC1: r=-0.367; fdr=3.8e-03 | 0.0000882 | 0.0038327 |
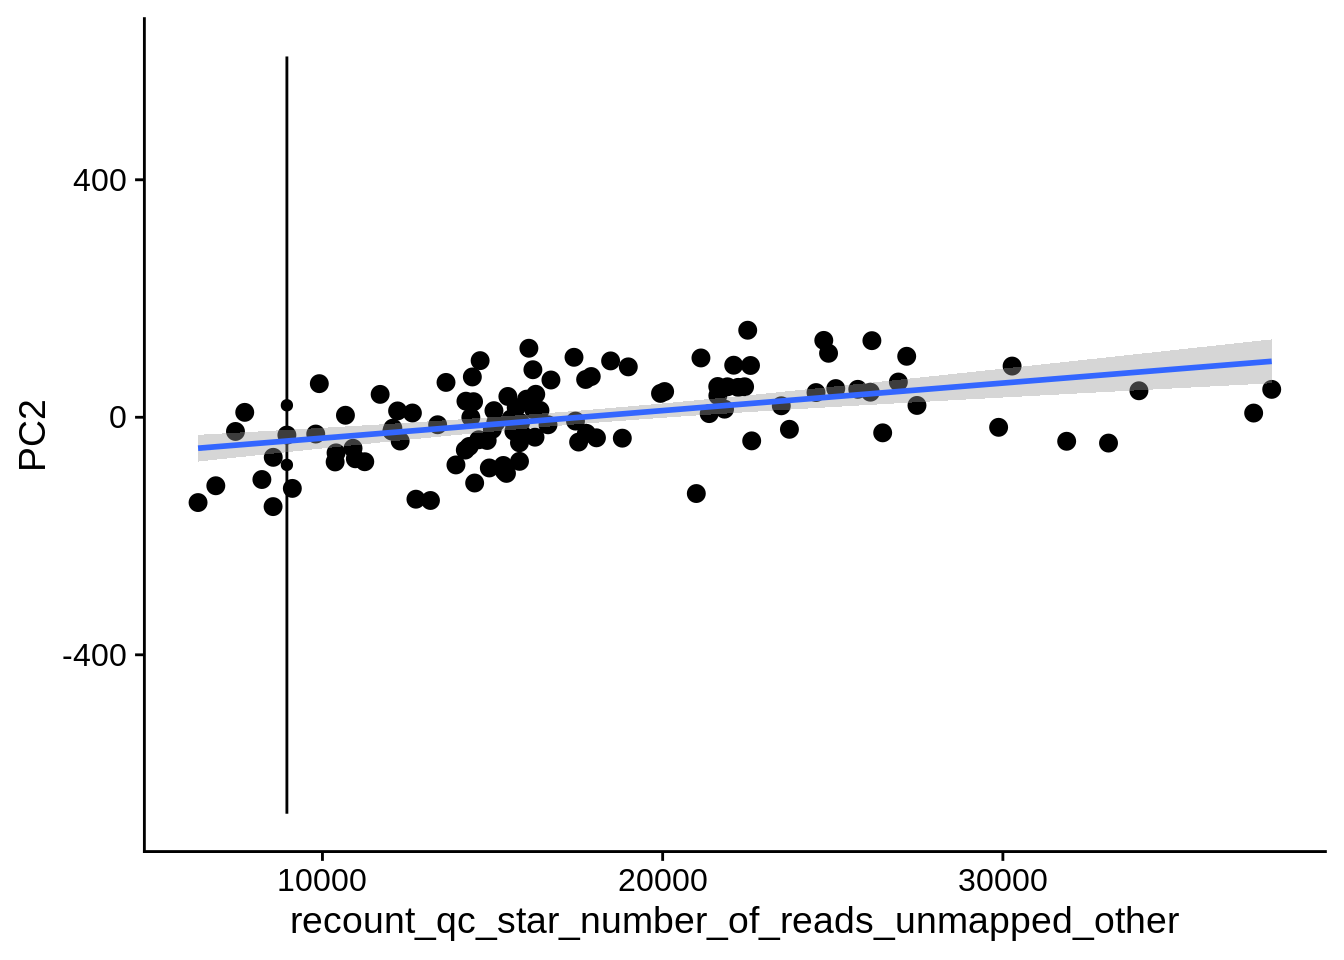
| PC2 | recount_qc_star_number_of_reads_unmapped_other | Numeric | recount_qc_star_number_of_reads_unmapped_other vs. PC2: r=0.364; fdr=3.8e-03 | 0.0000994 | 0.0038327 |
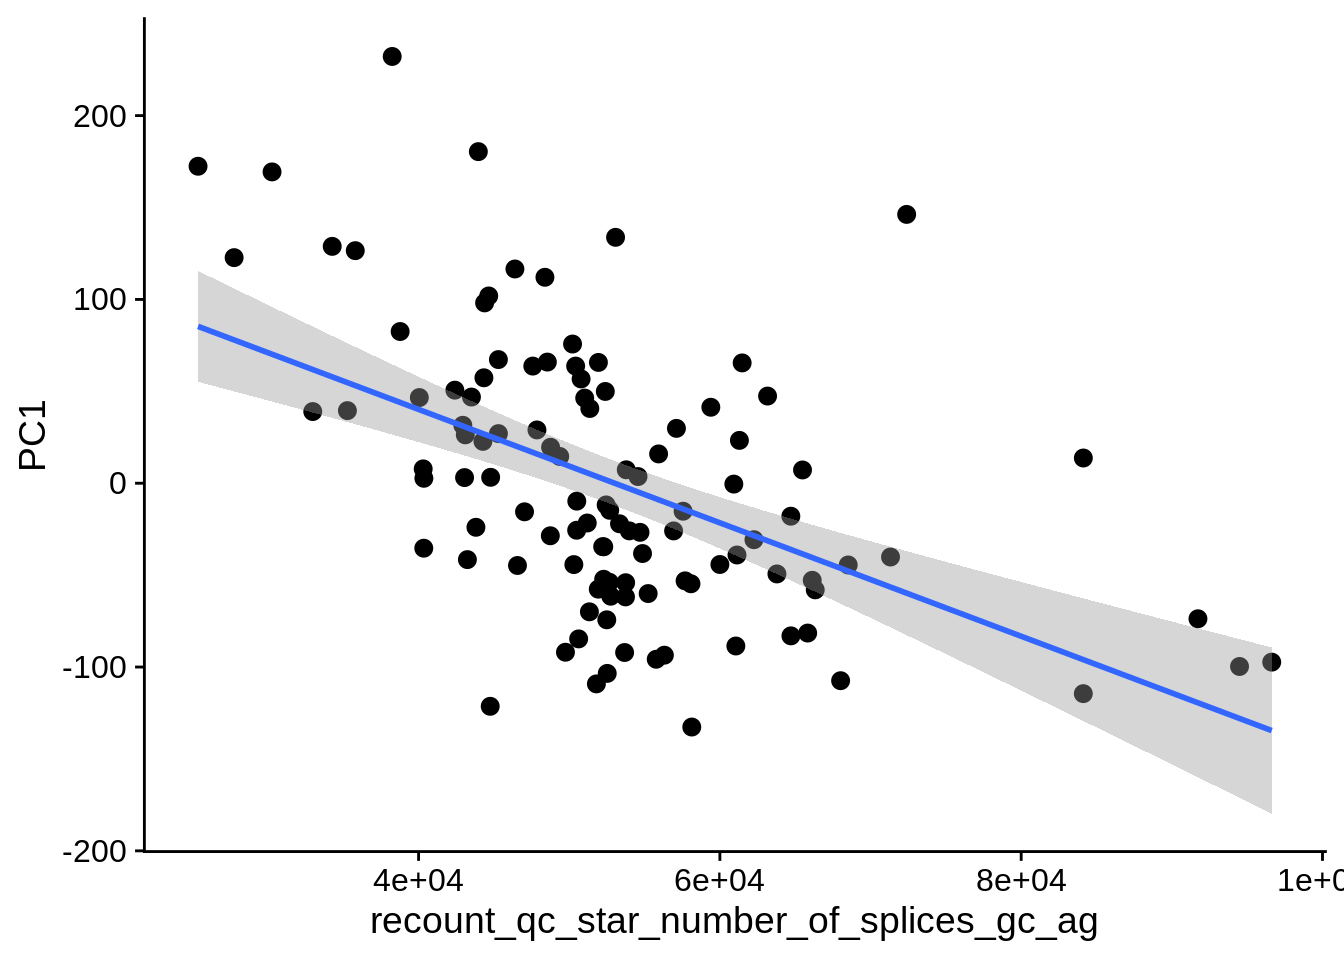
| PC1 | recount_qc_star_number_of_splices_gc_ag | Numeric | recount_qc_star_number_of_splices_gc_ag vs. PC1: r=-0.371; fdr=3.8e-03 | 0.0000725 | 0.0038327 |
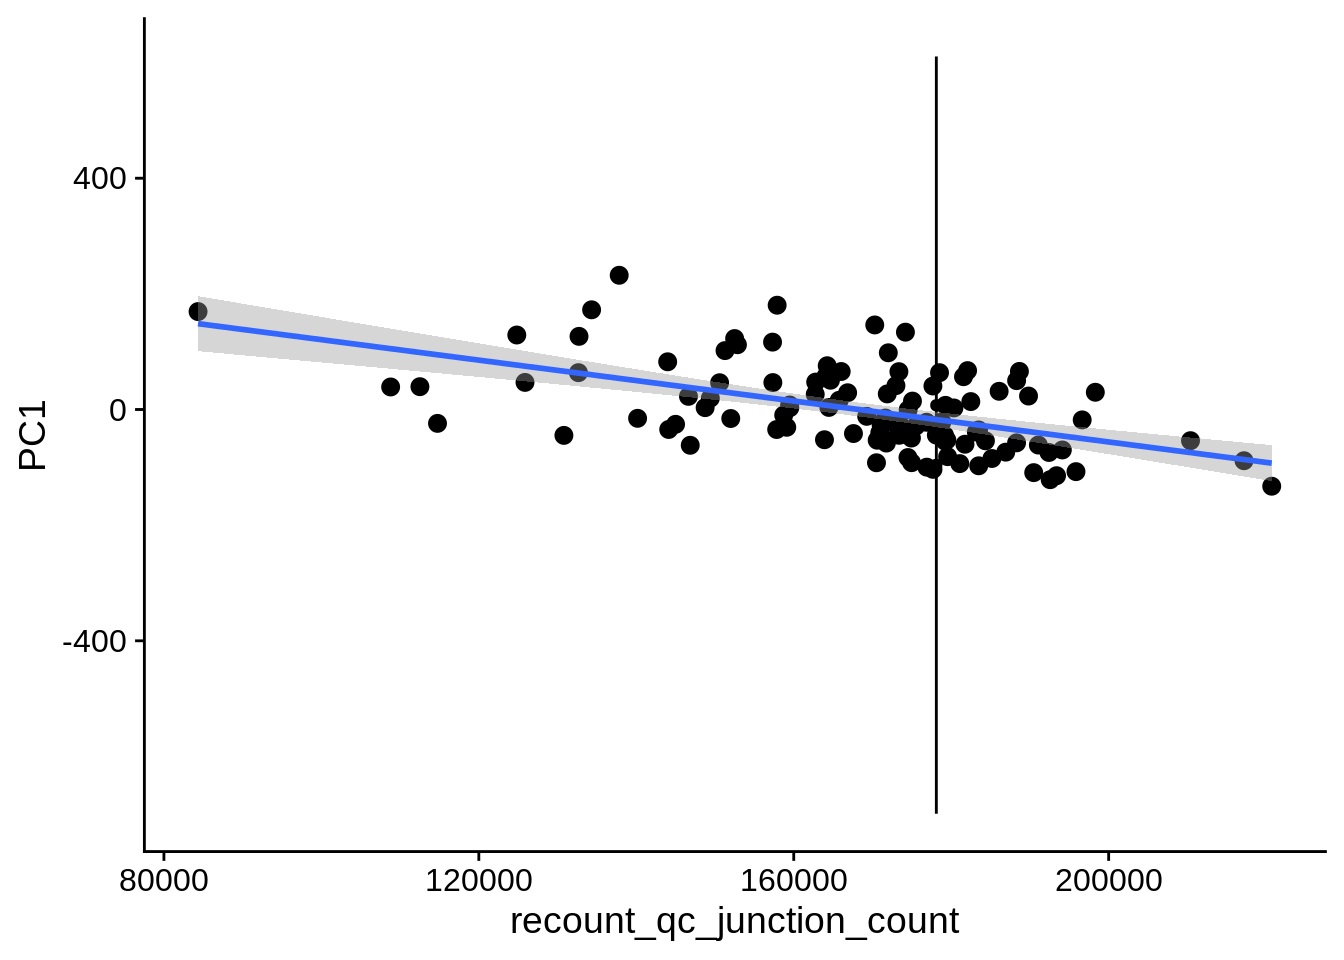
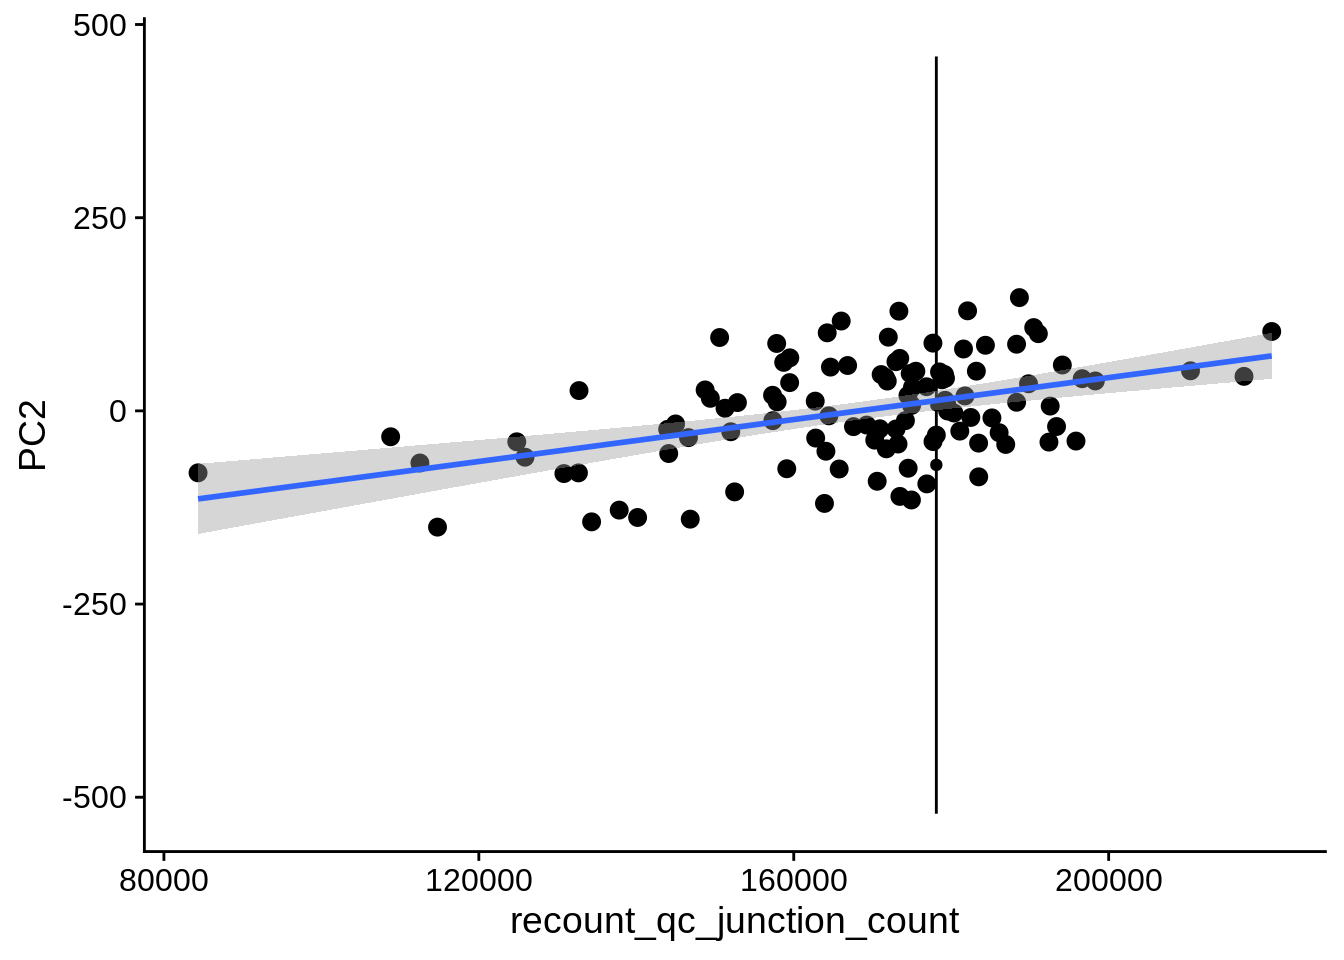
| PC1 | recount_qc_junction_count | Numeric | recount_qc_junction_count vs. PC1: r=-0.365; fdr=3.8e-03 | 0.0000947 | 0.0038327 |
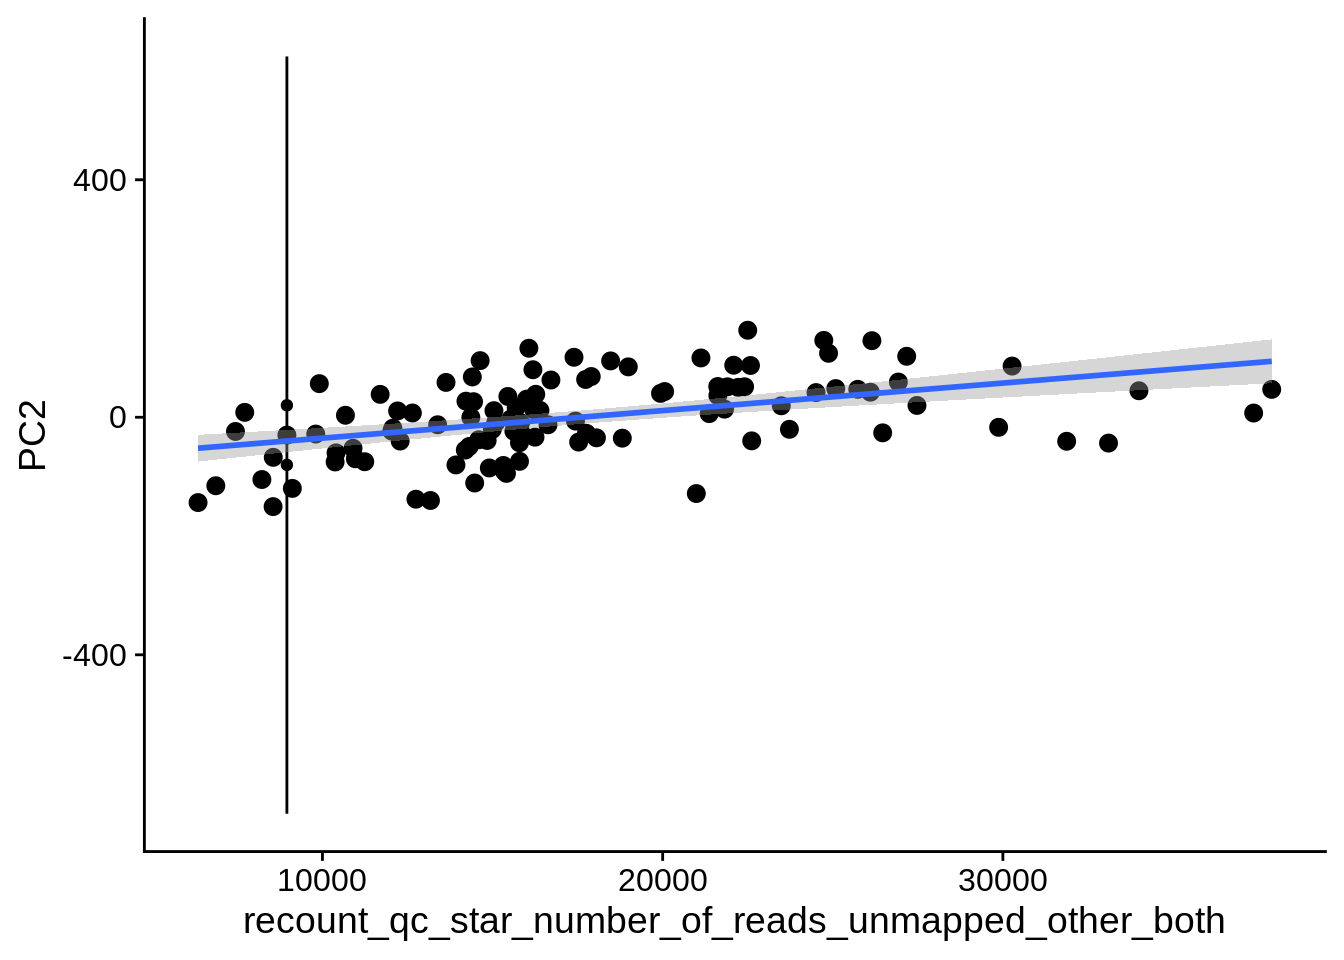
| PC2 | recount_qc_star_number_of_reads_unmapped_other_both | Numeric | recount_qc_star_number_of_reads_unmapped_other_both vs. PC2: r=0.364; fdr=3.8e-03 | 0.0000994 | 0.0038327 |
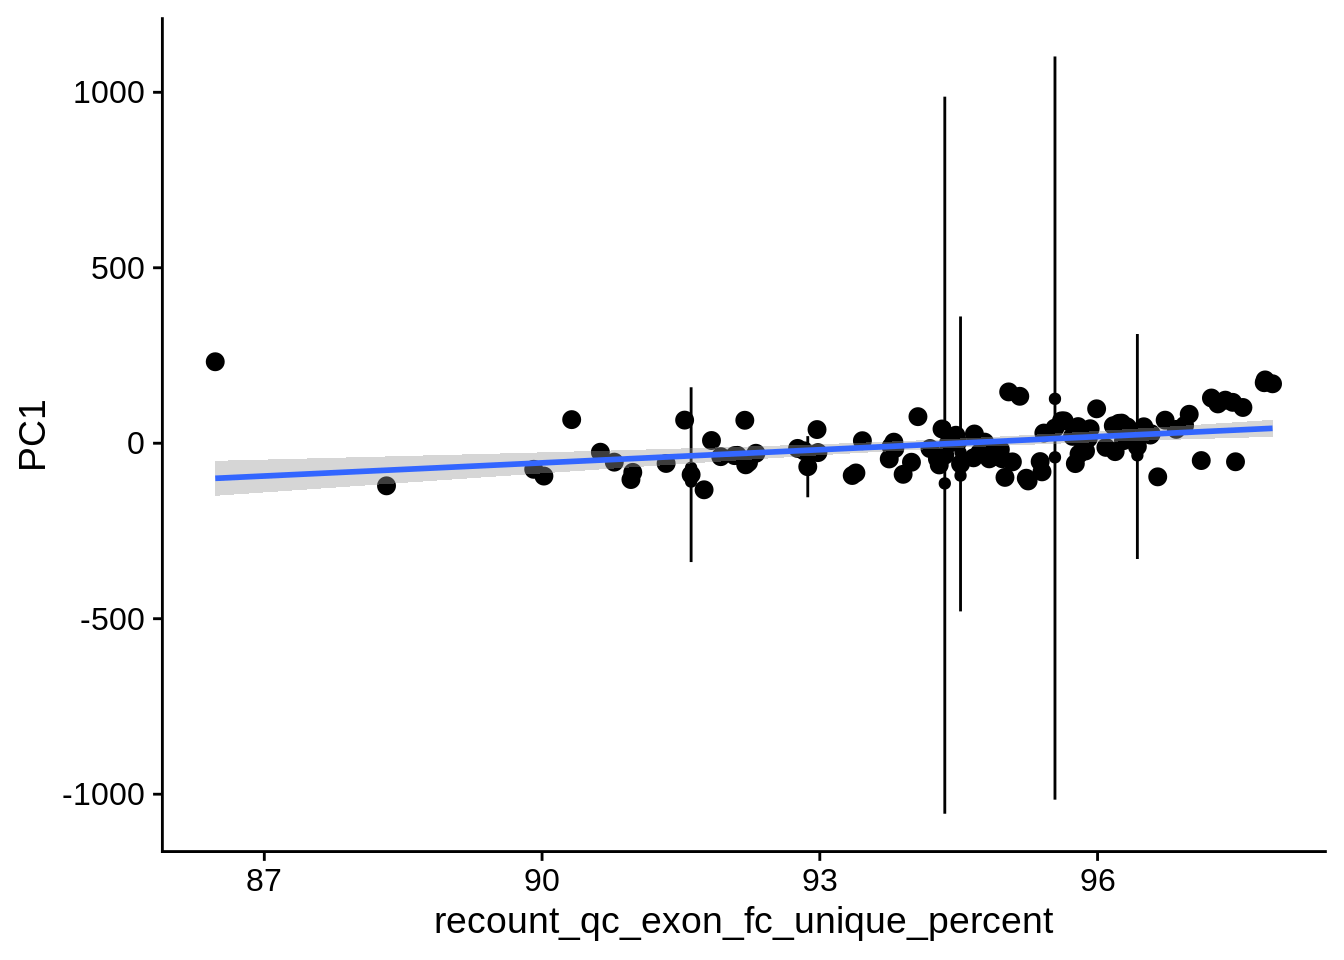
| PC1 | recount_qc_exon_fc_unique_percent | Numeric | recount_qc_exon_fc_unique_percent vs. PC1: r=0.355; fdr=4.5e-03 | 0.0001502 | 0.0045066 |
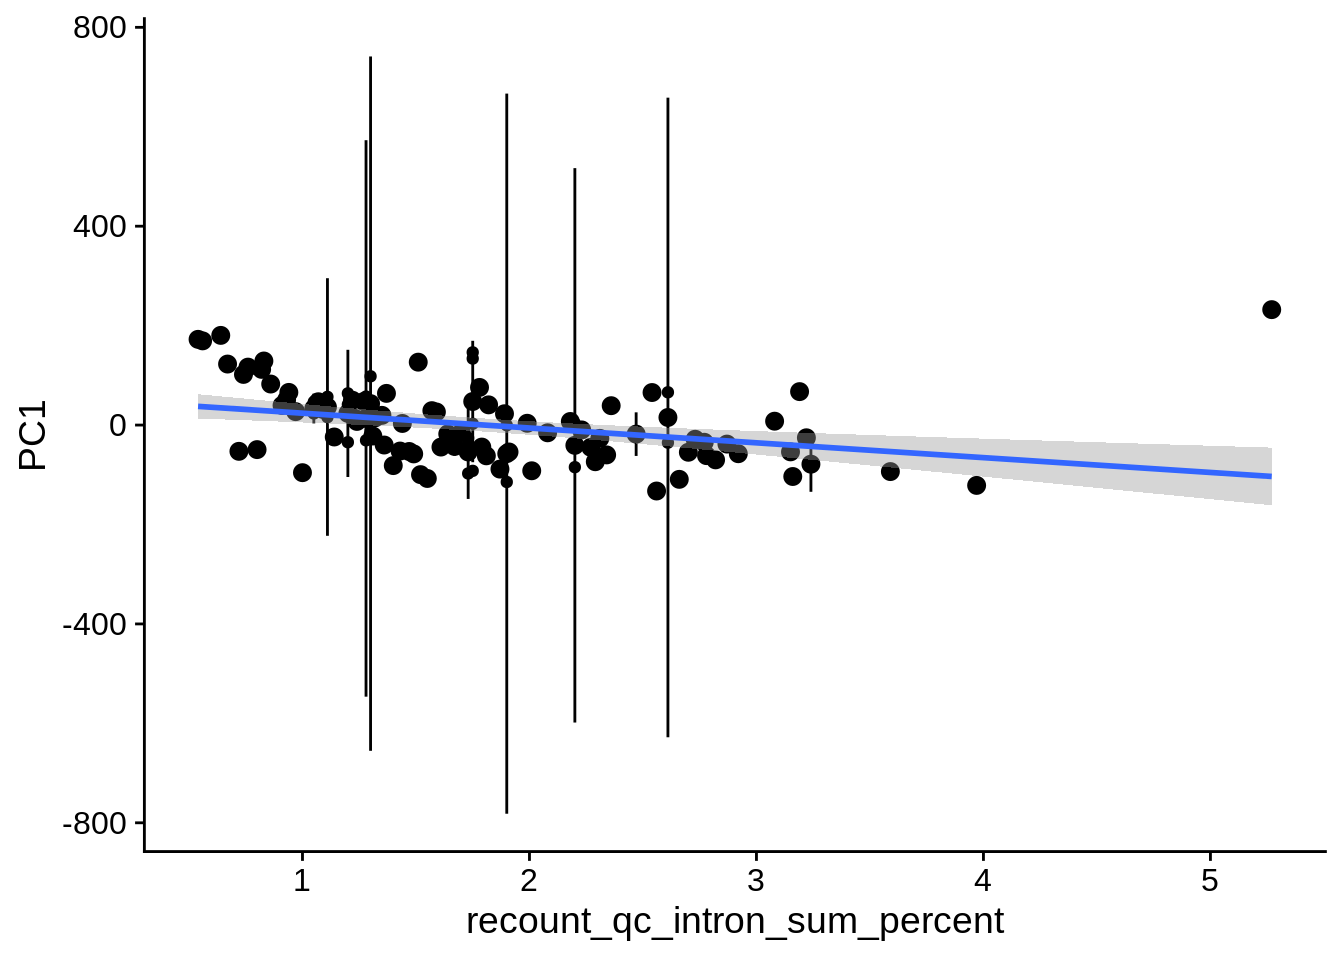
| PC1 | recount_qc_intron_sum_percent | Numeric | recount_qc_intron_sum_percent vs. PC1: r=-0.356; fdr=4.5e-03 | 0.0001457 | 0.0045066 |
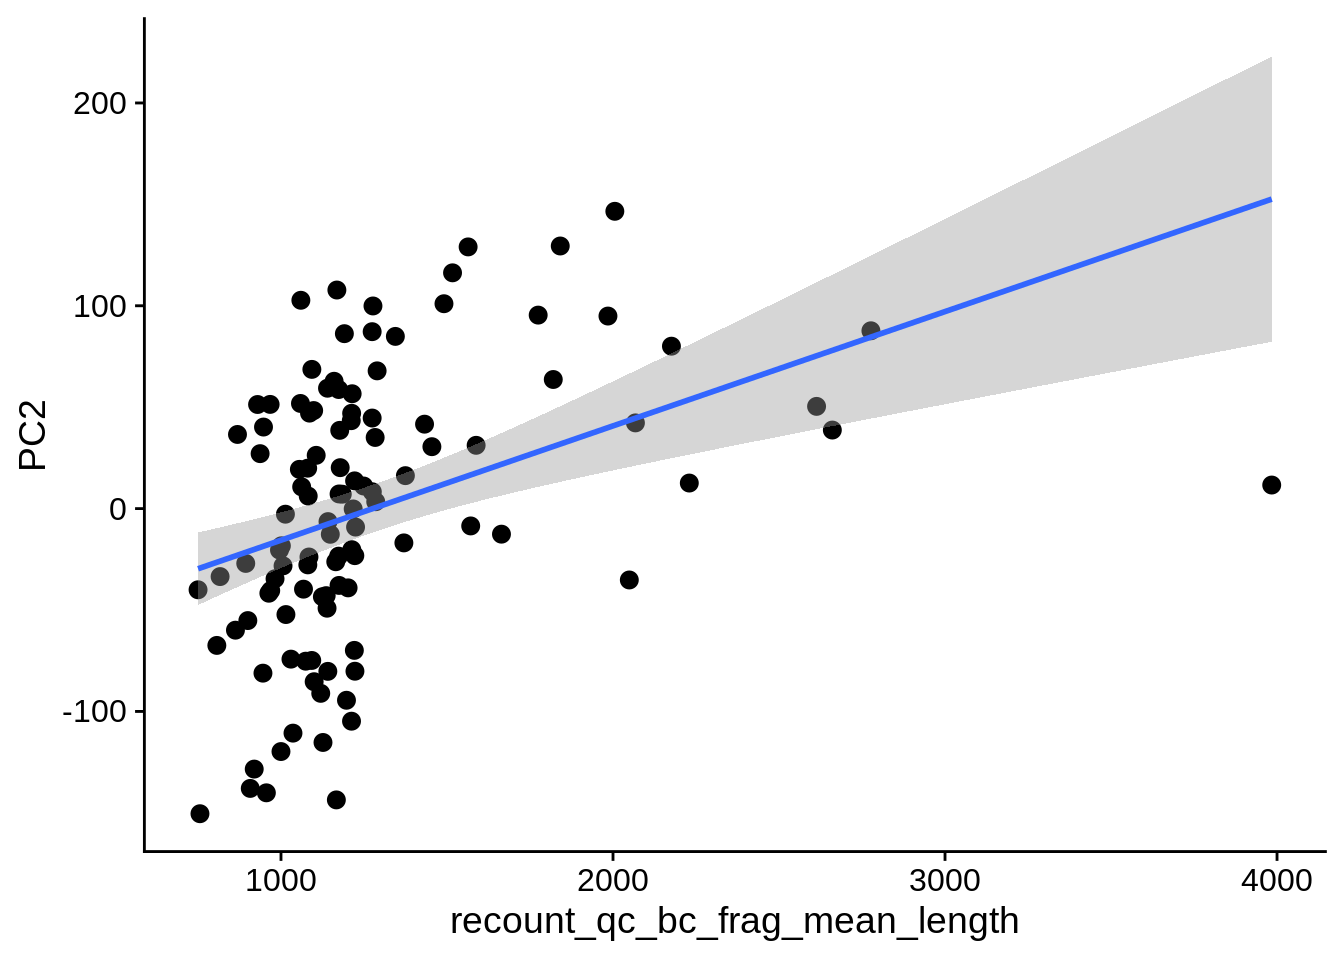
| PC2 | recount_qc_bc_frag_mean_length | Numeric | recount_qc_bc_frag_mean_length vs. PC2: r=0.35; fdr=5.2e-03 | 0.0001911 | 0.0051596 |
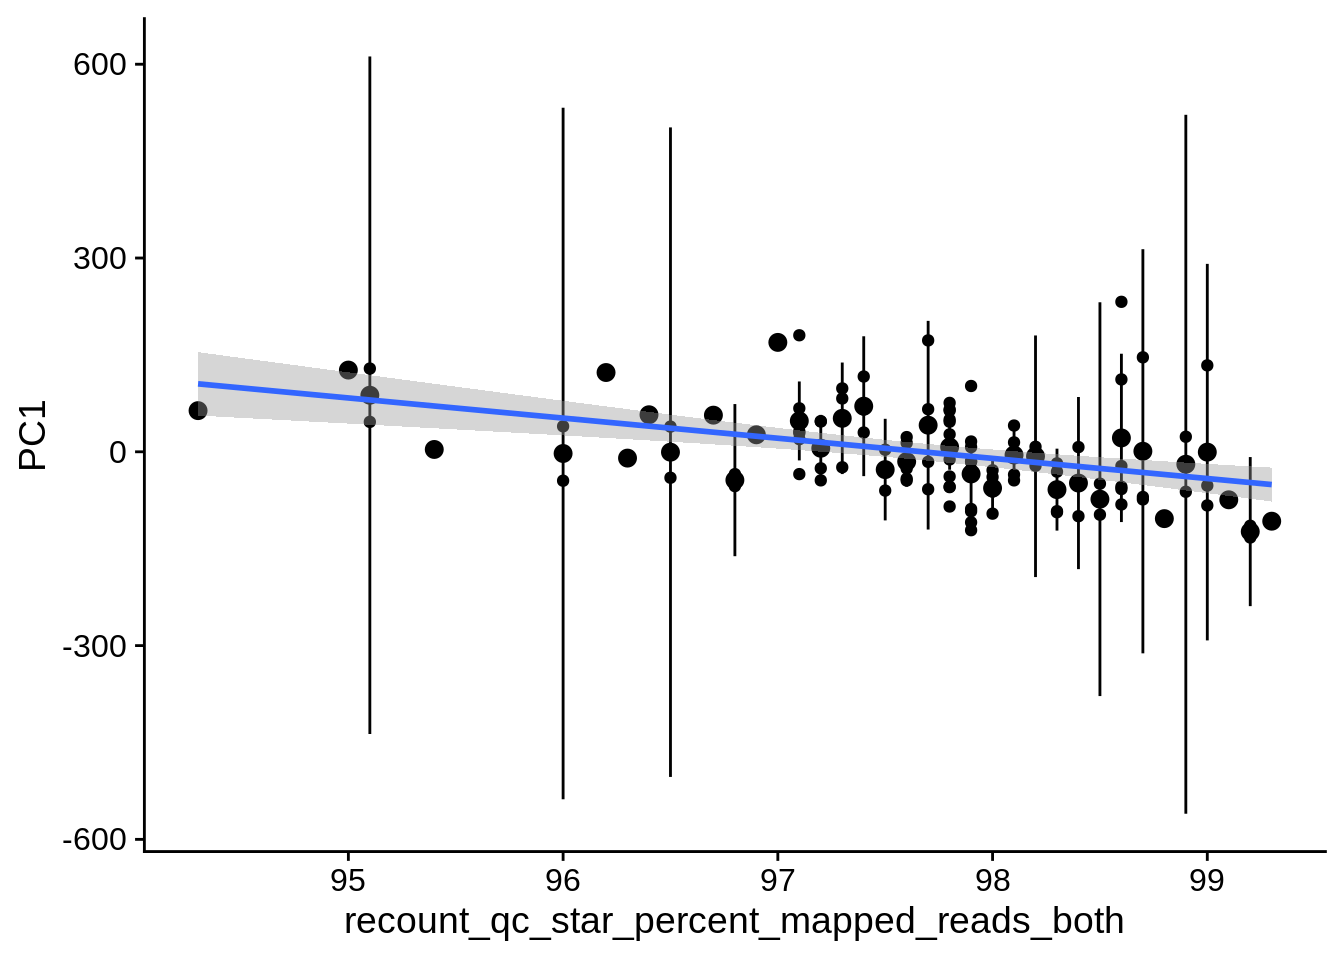
| PC1 | recount_qc_star_percent_mapped_reads_both | Numeric | recount_qc_star_percent_mapped_reads_both vs. PC1: r=-0.346; fdr=5.7e-03 | 0.0002311 | 0.0056714 |
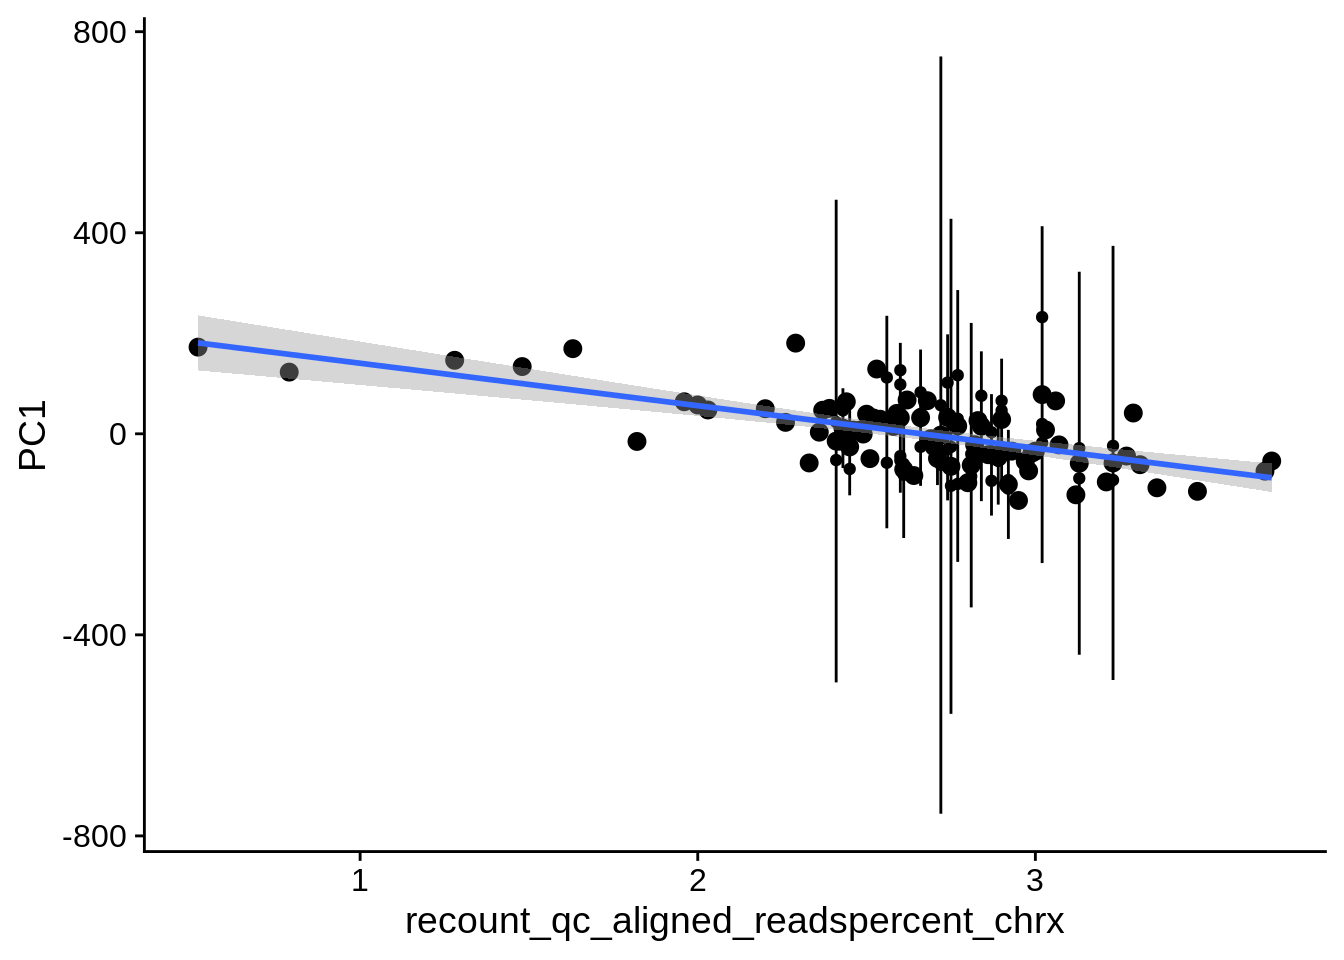
| PC1 | recount_qc_aligned_readspercent_chrx | Numeric | recount_qc_aligned_readspercent_chrx vs. PC1: r=-0.34; fdr=6.1e-03 | 0.0003010 | 0.0061227 |
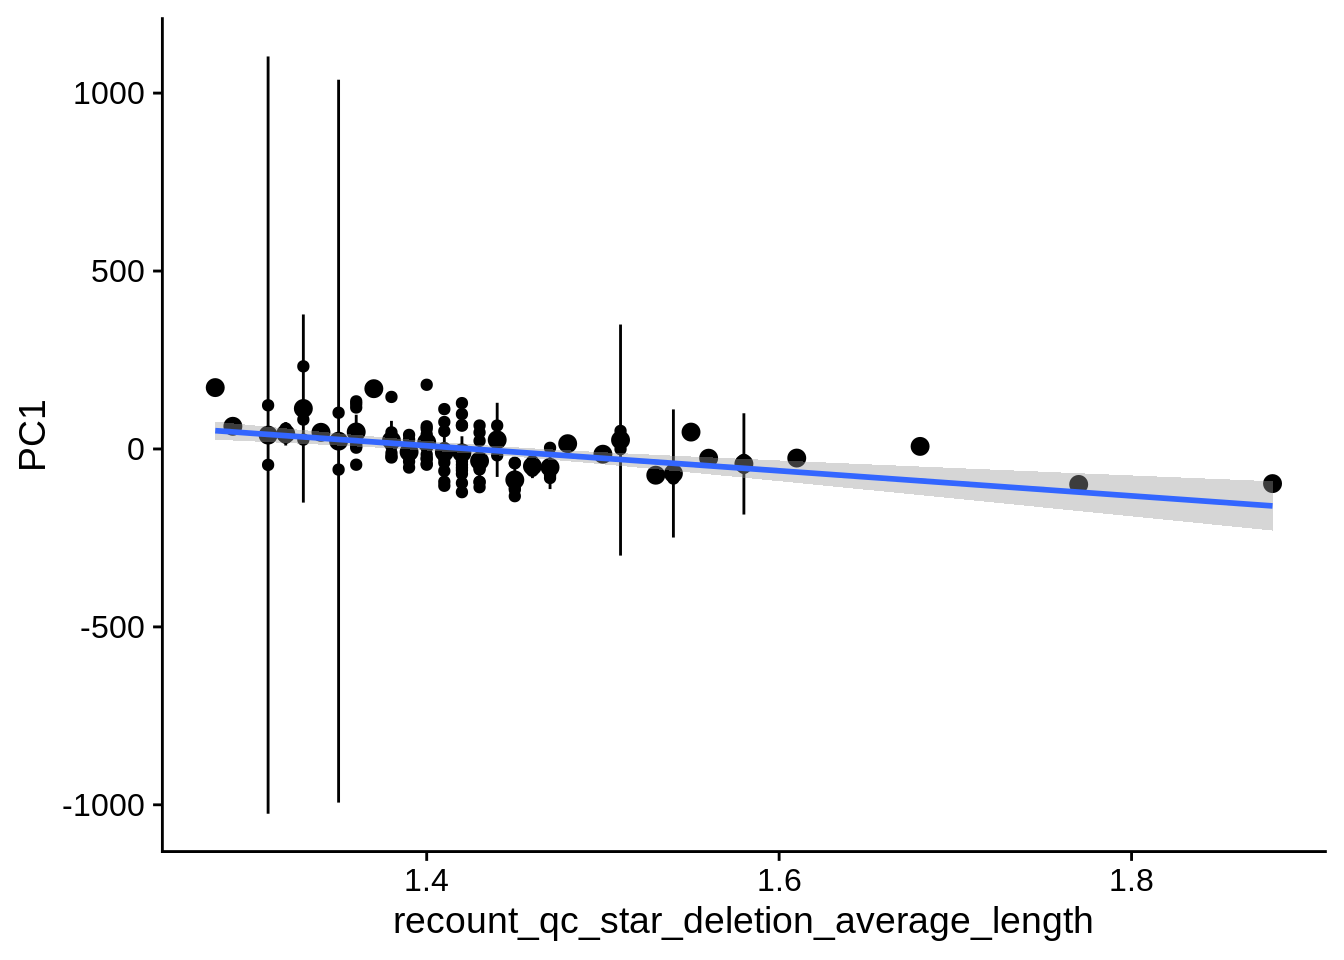
| PC1 | recount_qc_star_deletion_average_length | Numeric | recount_qc_star_deletion_average_length vs. PC1: r=-0.339; fdr=6.1e-03 | 0.0003047 | 0.0061227 |
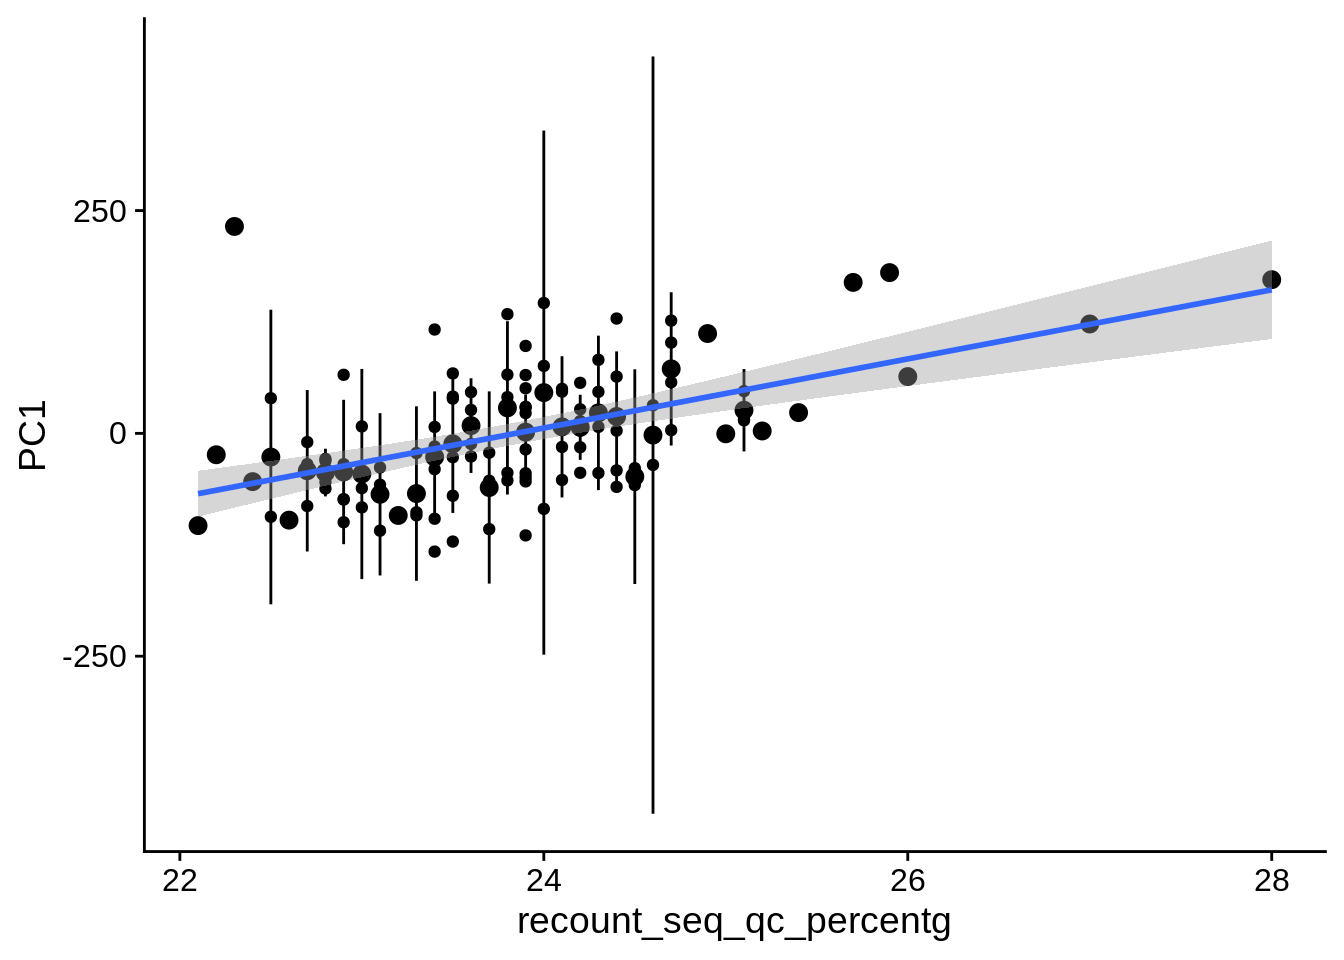
| PC1 | recount_seq_qc_percentg | Numeric | recount_seq_qc_percentg vs. PC1: r=0.339; fdr=6.1e-03 | 0.0003175 | 0.0061227 |
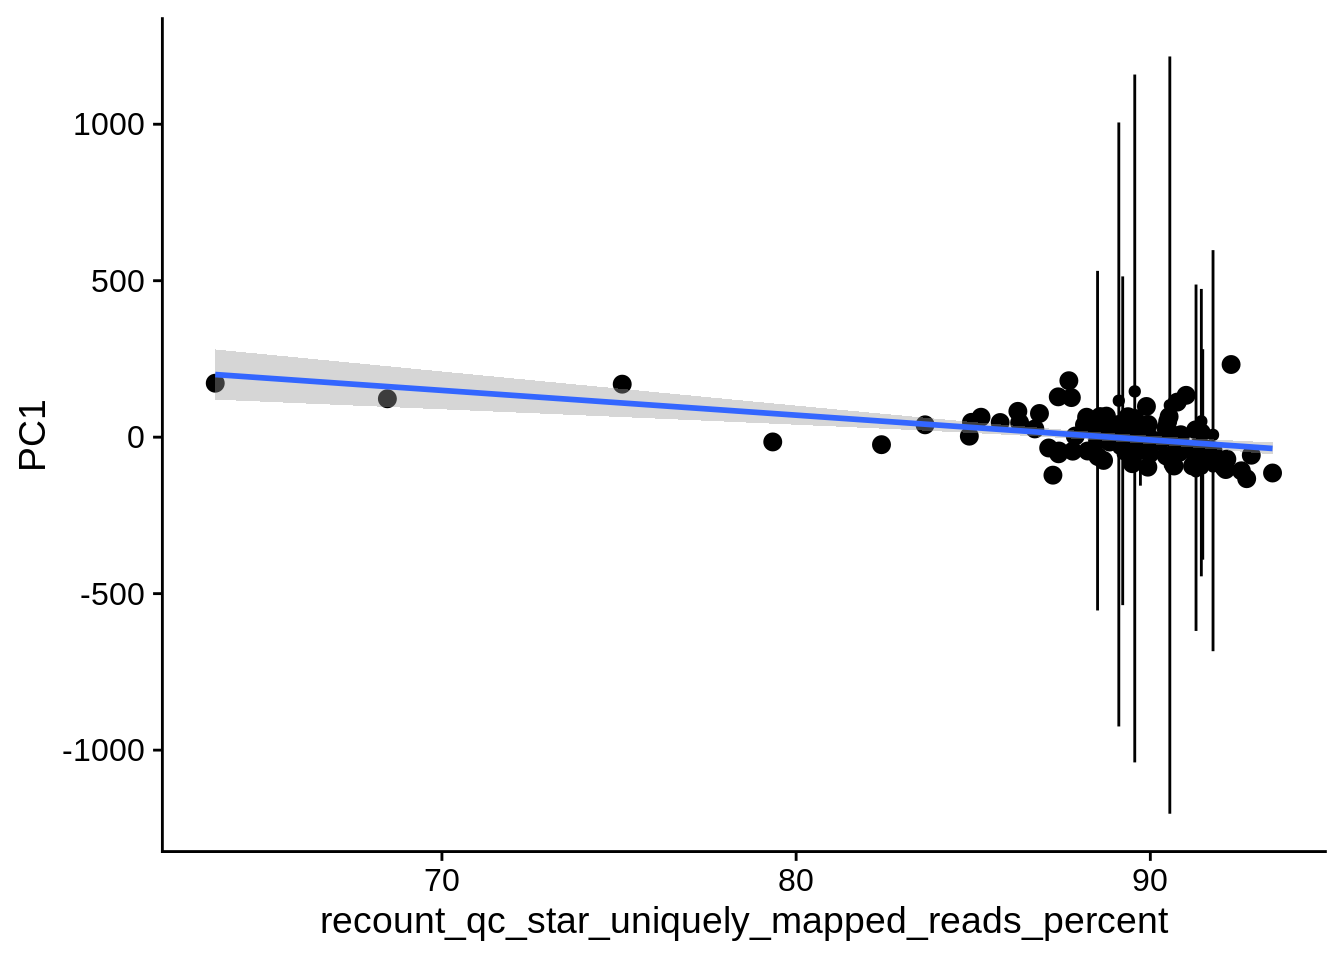
| PC1 | recount_qc_star_uniquely_mapped_reads_percent | Numeric | recount_qc_star_uniquely_mapped_reads_percent vs. PC1: r=-0.335; fdr=6.1e-03 | 0.0003631 | 0.0061281 |
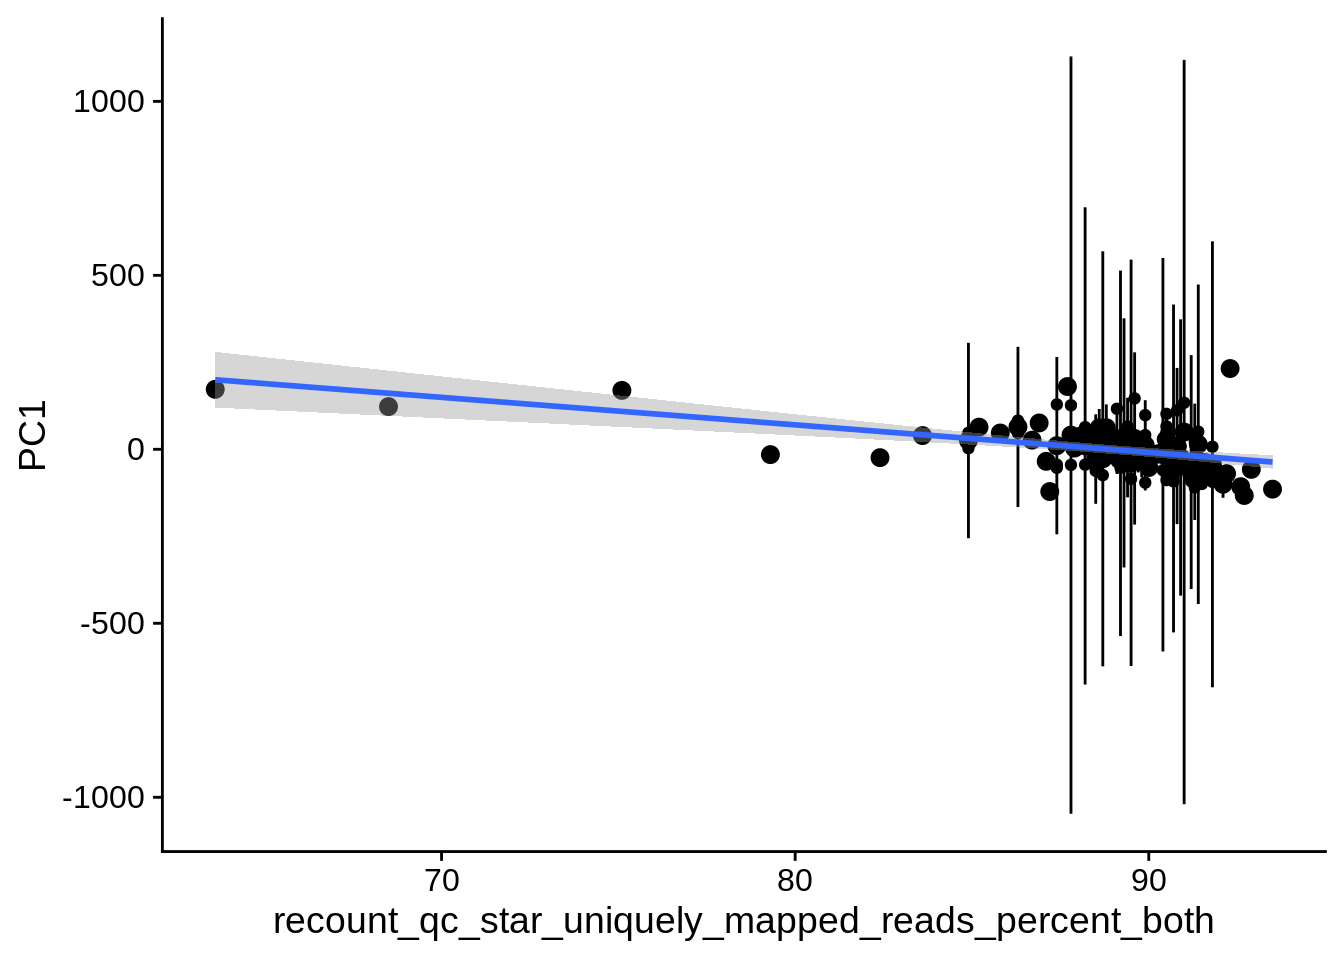
| PC1 | recount_qc_star_uniquely_mapped_reads_percent_both | Numeric | recount_qc_star_uniquely_mapped_reads_percent_both vs. PC1: r=-0.337; fdr=6.1e-03 | 0.0003450 | 0.0061281 |
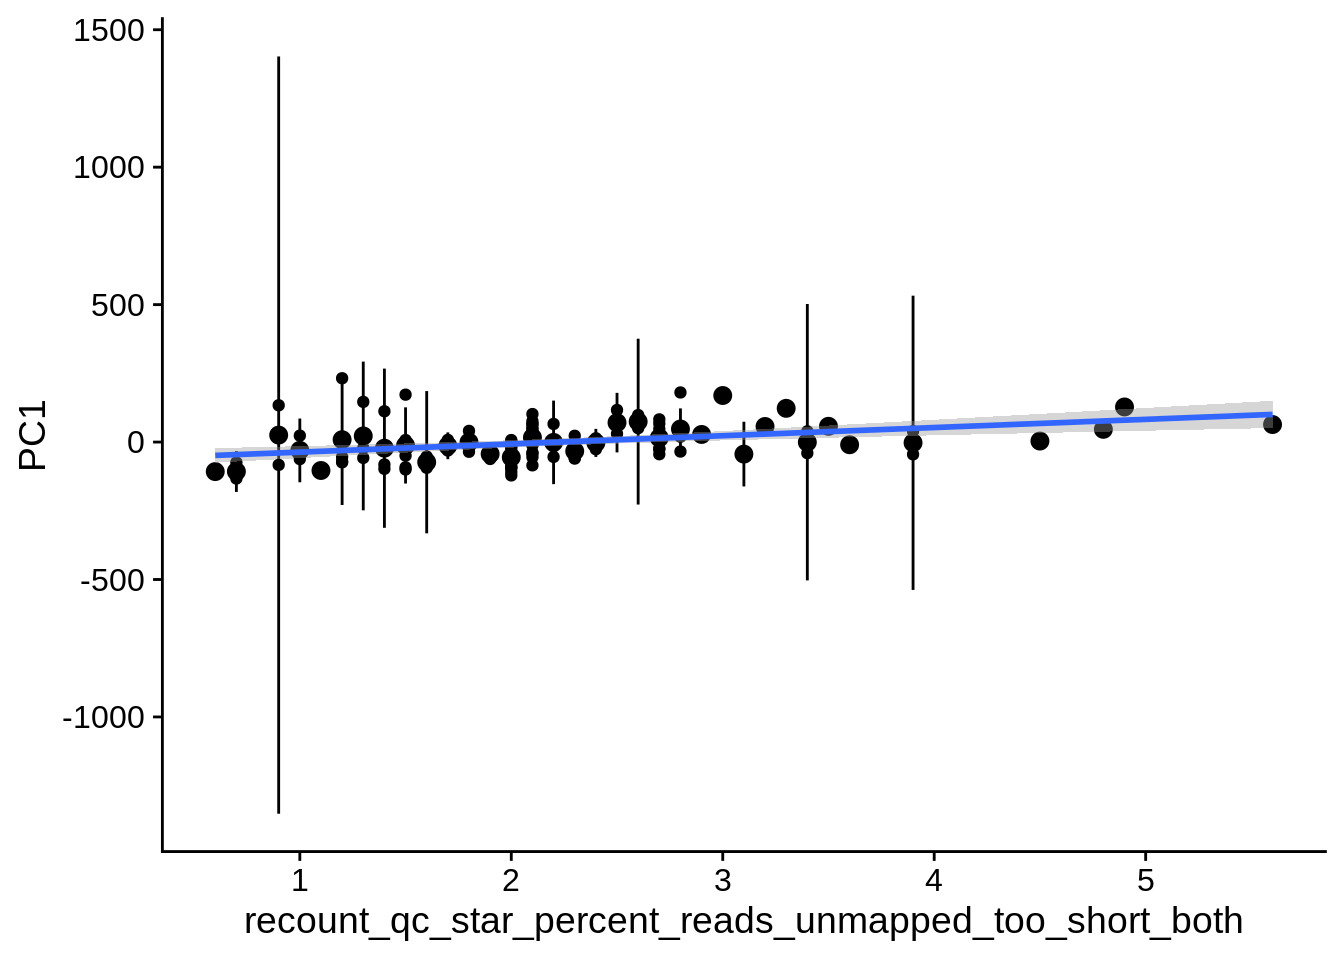
| PC1 | recount_qc_star_percent_reads_unmapped_too_short_both | Numeric | recount_qc_star_percent_reads_unmapped_too_short_both vs. PC1: r=0.334; fdr=6.2e-03 | 0.0003908 | 0.0062076 |
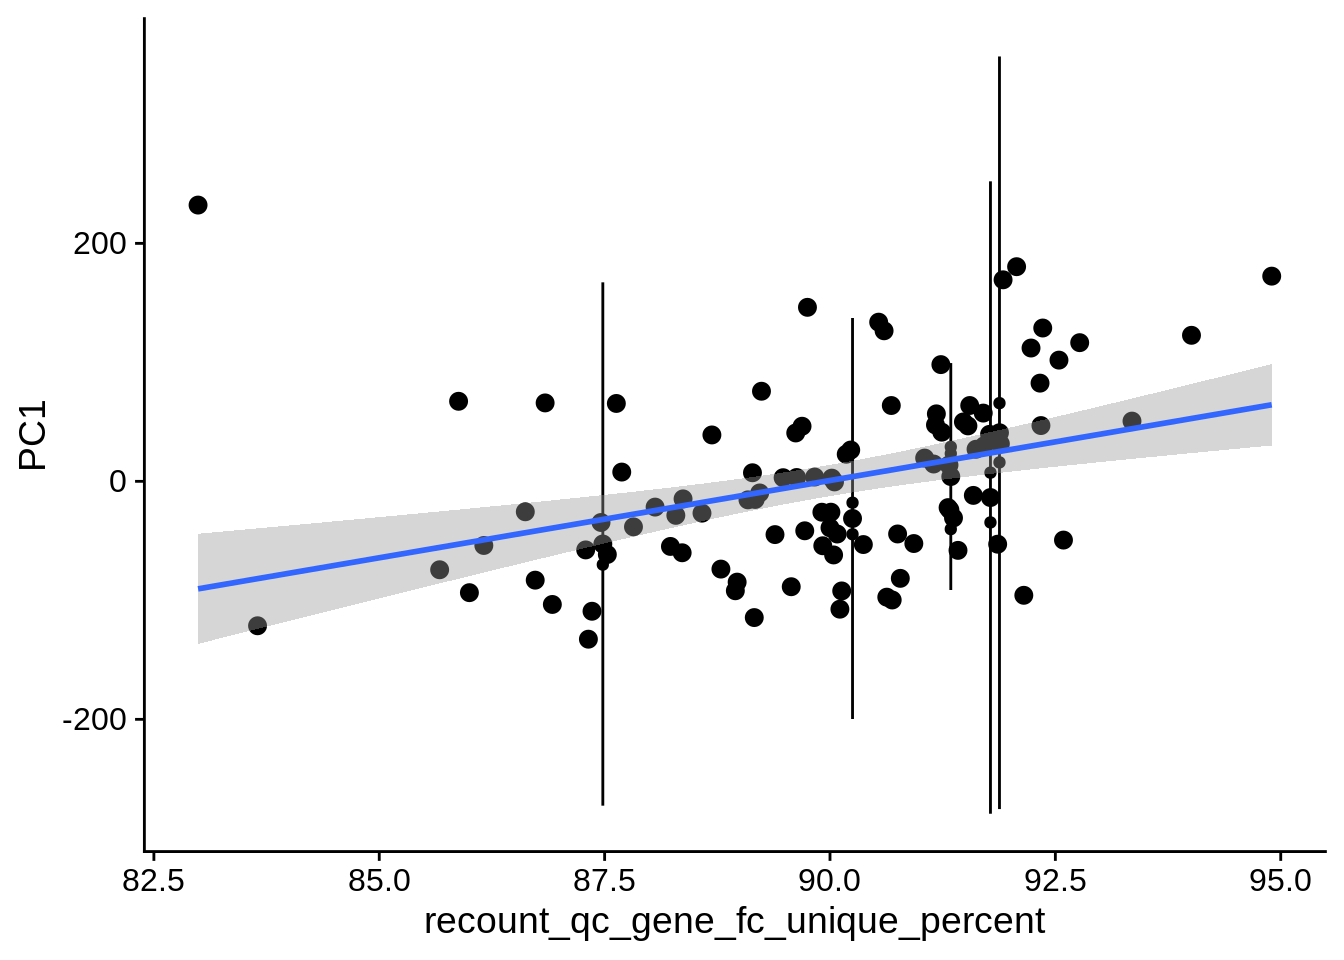
| PC1 | recount_qc_gene_fc_unique_percent | Numeric | recount_qc_gene_fc_unique_percent vs. PC1: r=0.332; fdr=6.3e-03 | 0.0004206 | 0.0063086 |
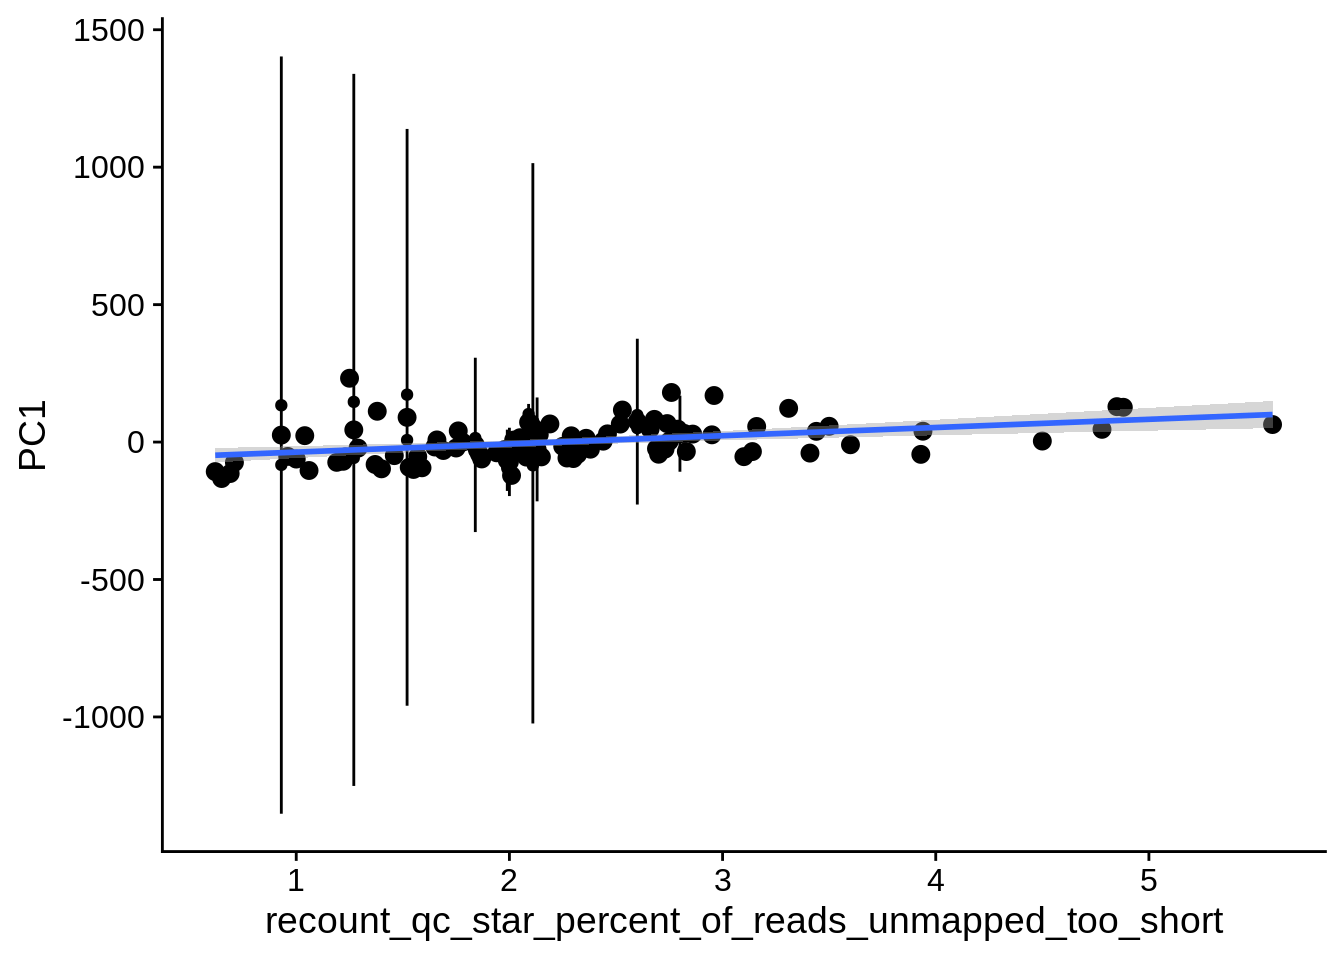
| PC1 | recount_qc_star_percent_of_reads_unmapped_too_short | Numeric | recount_qc_star_percent_of_reads_unmapped_too_short vs. PC1: r=0.325; fdr=7.9e-03 | 0.0005535 | 0.0078648 |
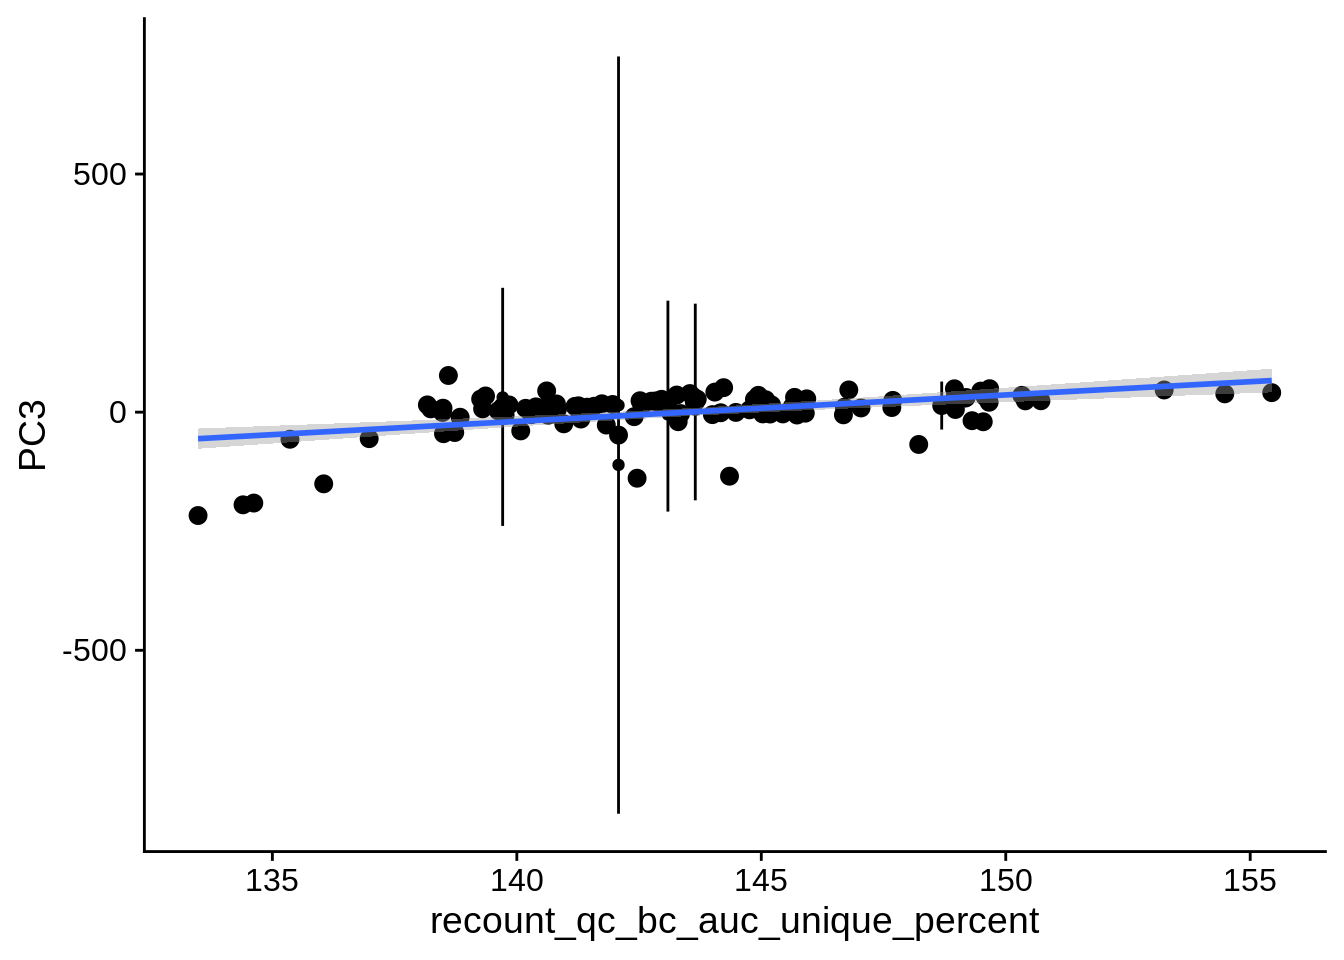
| PC3 | recount_qc_bc_auc_unique_percent | Numeric | recount_qc_bc_auc_unique_percent vs. PC3: r=0.306; fdr=1.7e-02 | 0.0012235 | 0.0165175 |
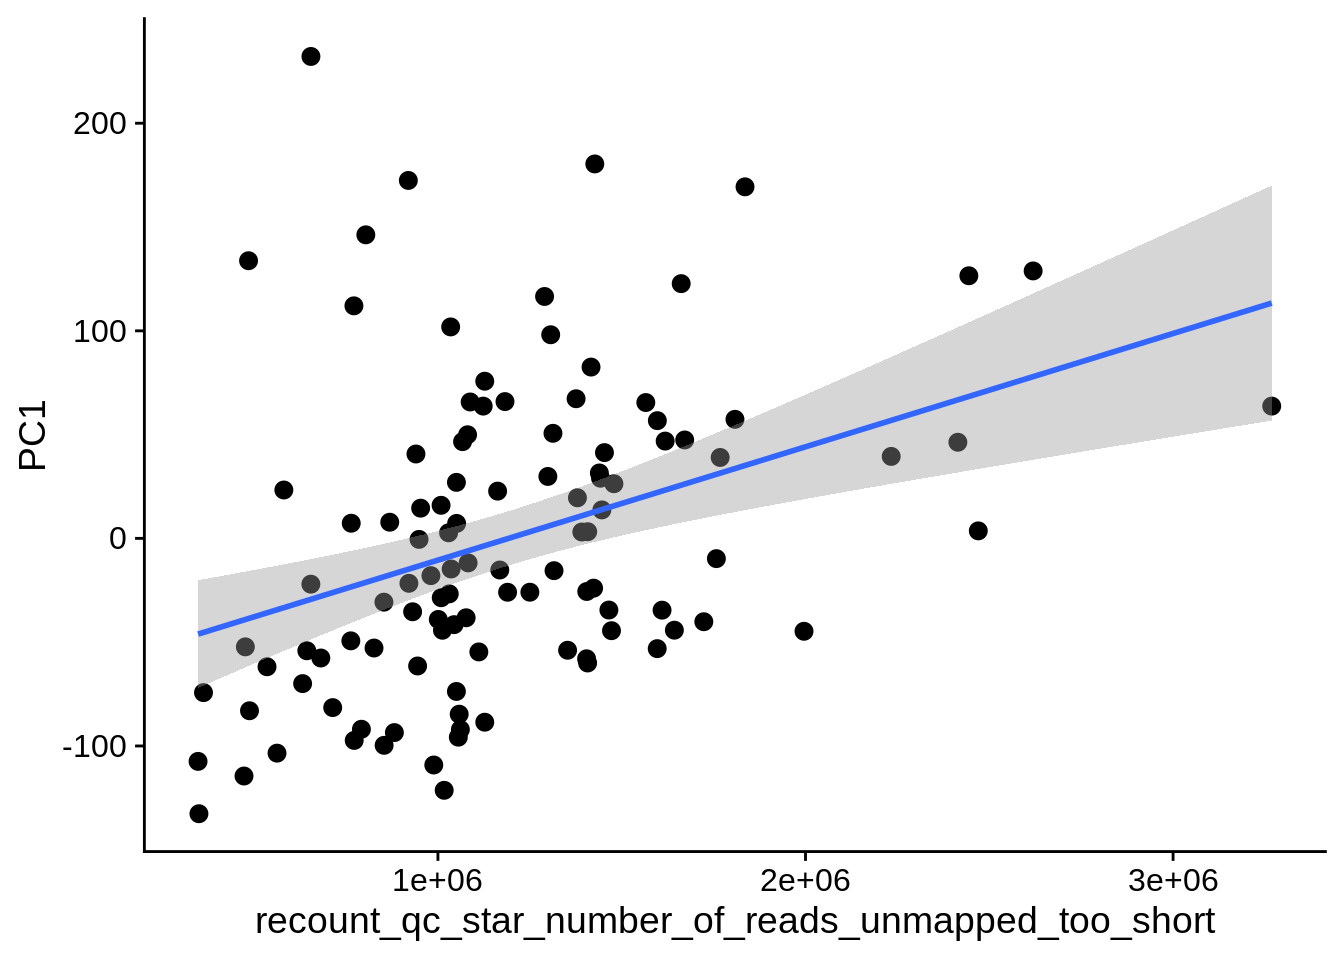
| PC1 | recount_qc_star_number_of_reads_unmapped_too_short | Numeric | recount_qc_star_number_of_reads_unmapped_too_short vs. PC1: r=0.301; fdr=1.8e-02 | 0.0014488 | 0.0177802 |
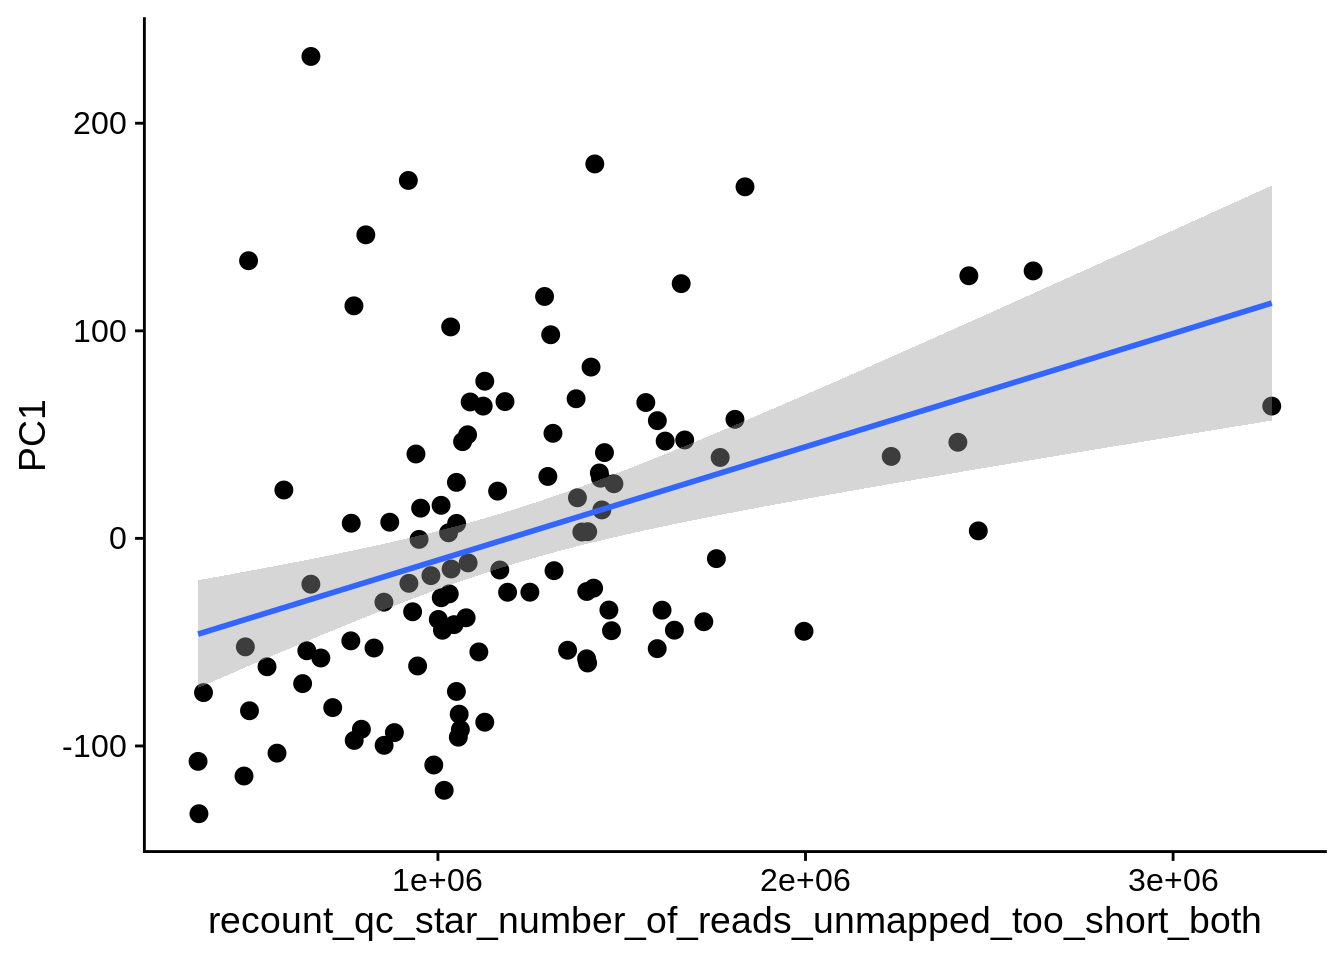
| PC1 | recount_qc_star_number_of_reads_unmapped_too_short_both | Numeric | recount_qc_star_number_of_reads_unmapped_too_short_both vs. PC1: r=0.301; fdr=1.8e-02 | 0.0014488 | 0.0177802 |
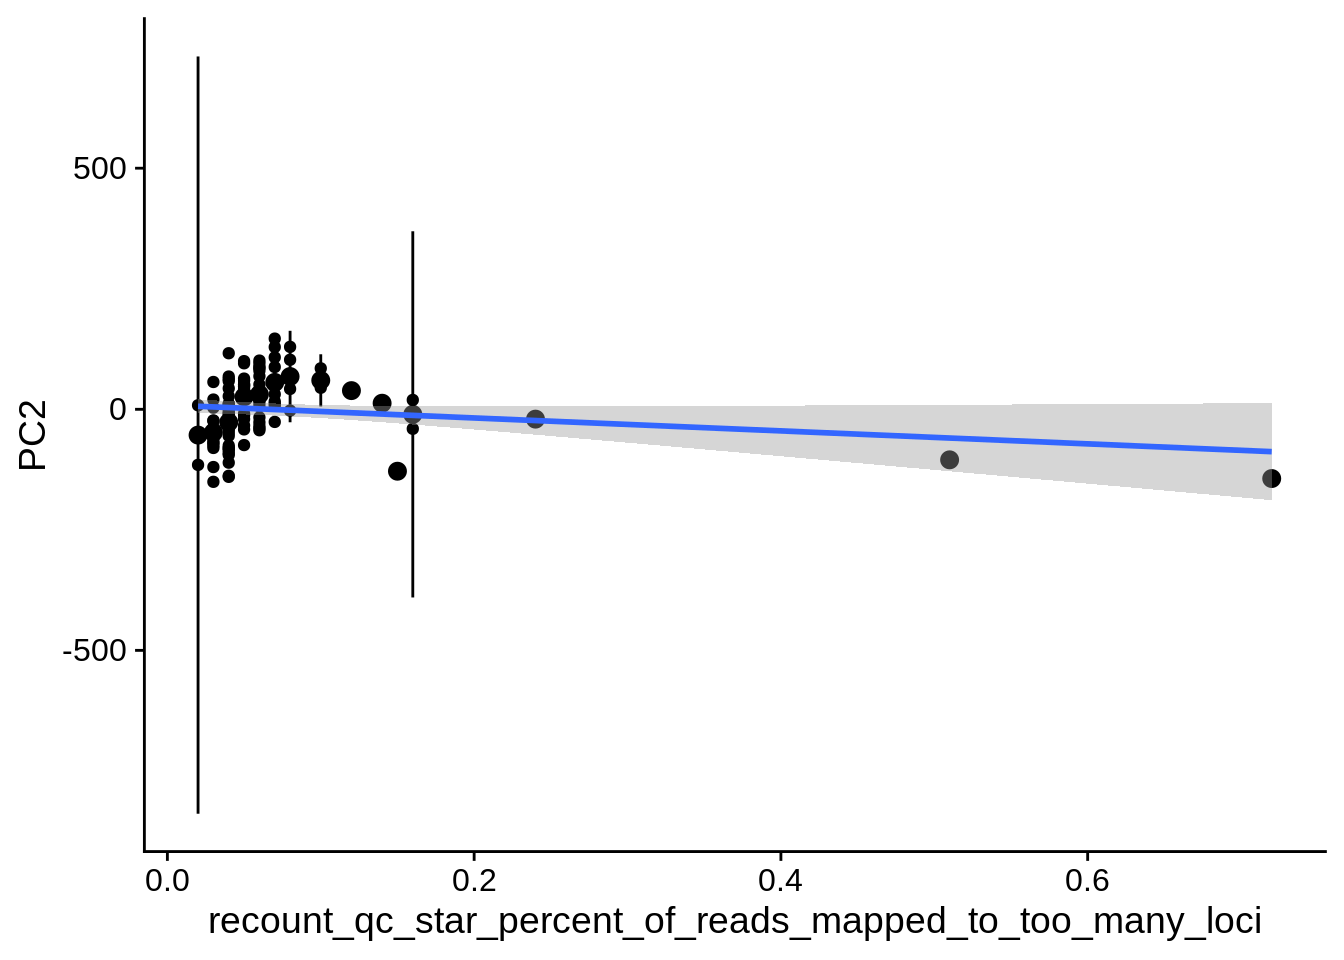
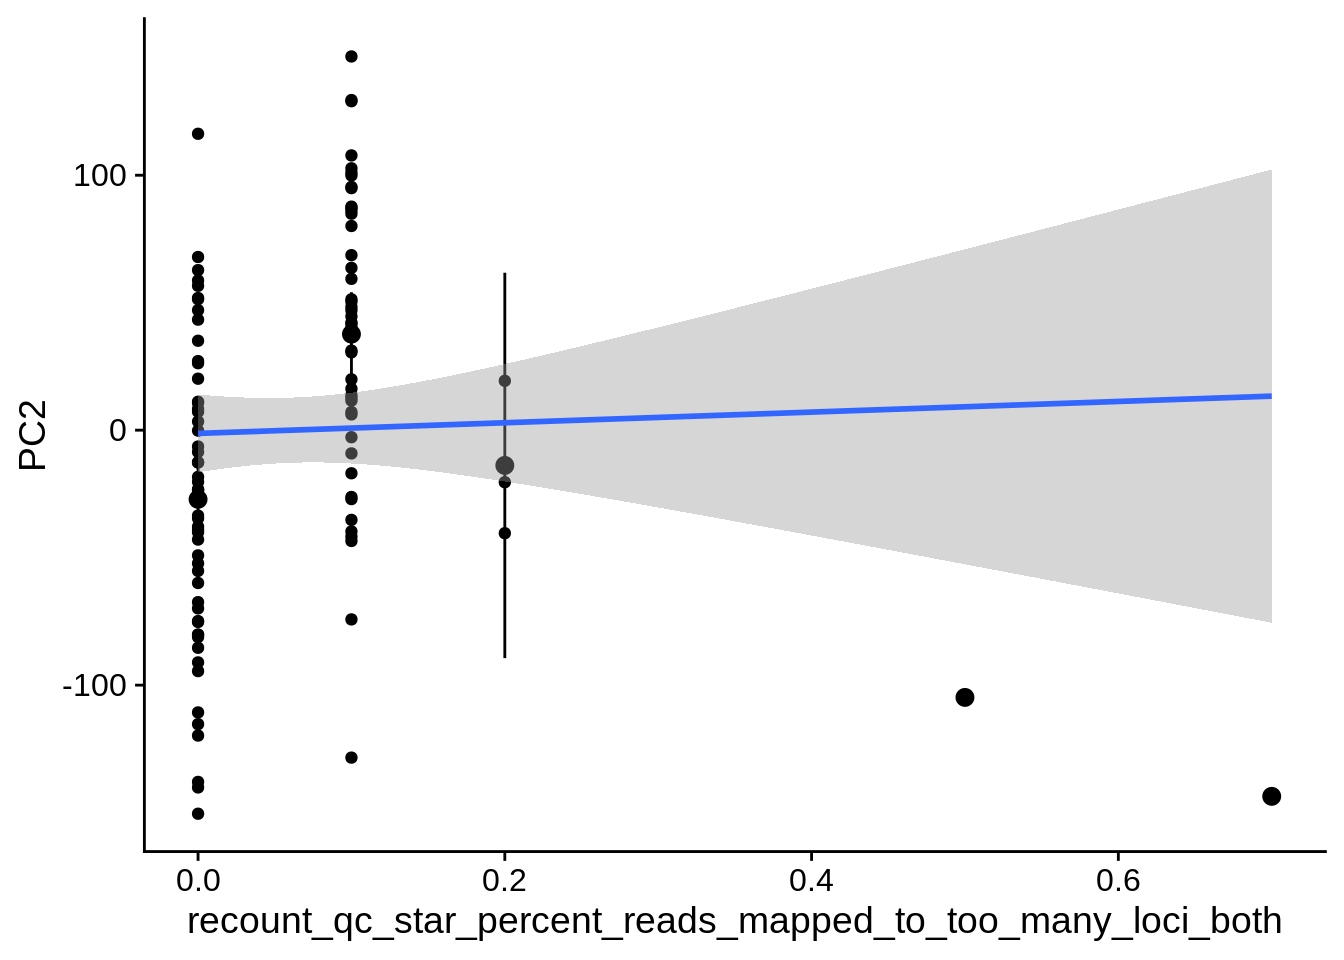
| PC2 | recount_qc_star_percent_of_reads_mapped_to_too_many_loci | Numeric | recount_qc_star_percent_of_reads_mapped_to_too_many_loci vs. PC2: r=0.3; fdr=1.8e-02 | 0.0015278 | 0.0179345 |
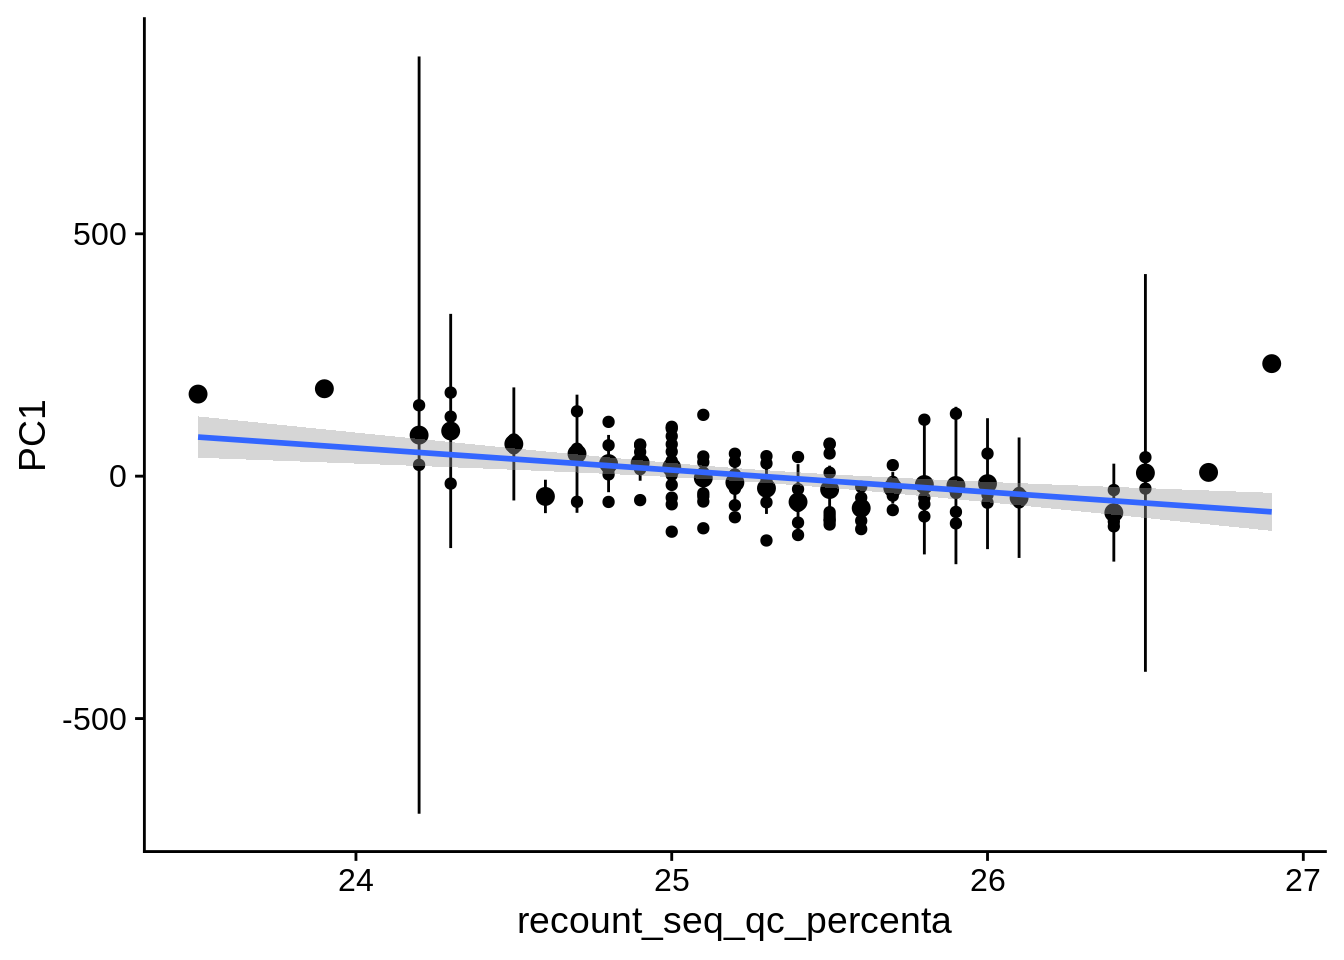
| PC1 | recount_seq_qc_percenta | Numeric | recount_seq_qc_percenta vs. PC1: r=-0.296; fdr=2.0e-02 | 0.0017673 | 0.0198821 |
| PC2 | recount_qc_star_percent_reads_mapped_to_too_many_loci_both | Numeric | recount_qc_star_percent_reads_mapped_to_too_many_loci_both vs. PC2: r=0.292; fdr=2.3e-02 | 0.0020858 | 0.0225270 |
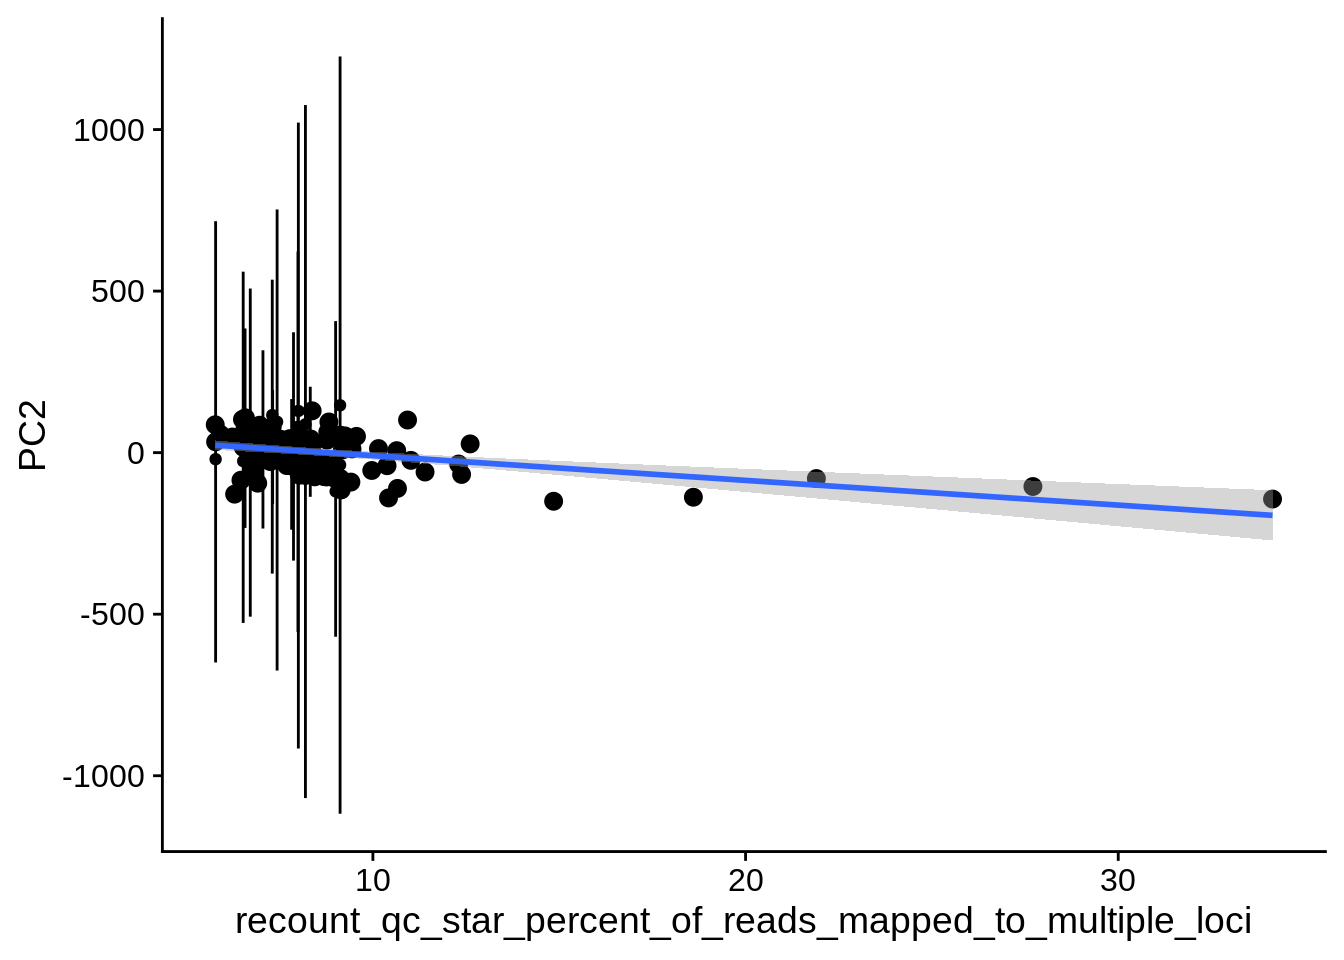
| PC2 | recount_qc_star_percent_of_reads_mapped_to_multiple_loci | Numeric | recount_qc_star_percent_of_reads_mapped_to_multiple_loci vs. PC2: r=-0.288; fdr=2.4e-02 | 0.0024343 | 0.0237980 |
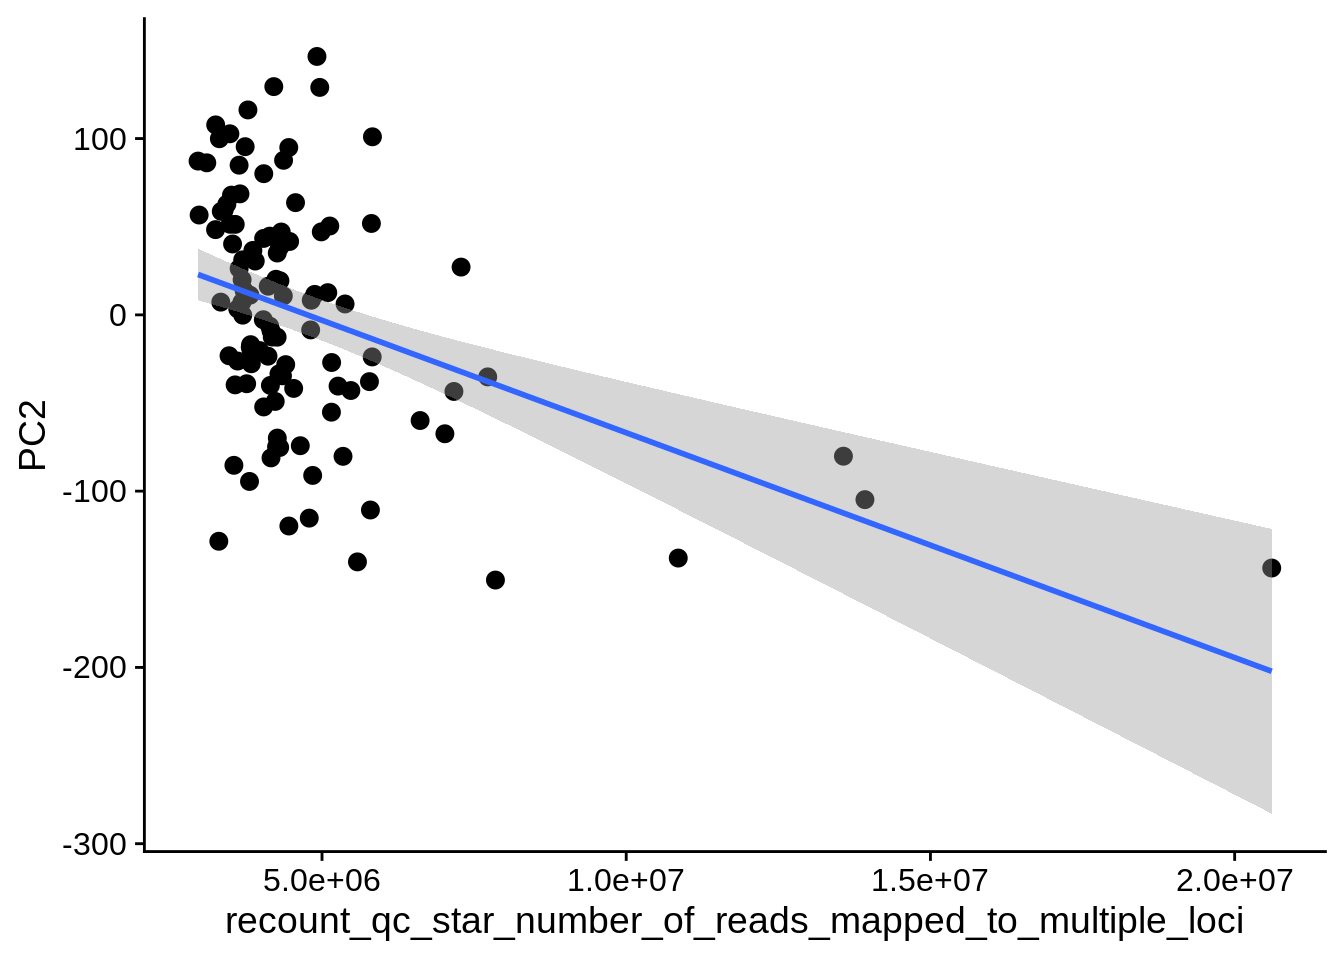
| PC2 | recount_qc_star_number_of_reads_mapped_to_multiple_loci | Numeric | recount_qc_star_number_of_reads_mapped_to_multiple_loci vs. PC2: r=-0.287; fdr=2.4e-02 | 0.0024692 | 0.0237980 |
| PC2 | recount_qc_star_number_of_reads_mapped_to_multiple_loci_both | Numeric | recount_qc_star_number_of_reads_mapped_to_multiple_loci_both vs. PC2: r=-0.287; fdr=2.4e-02 | 0.0024692 | 0.0237980 |
| PC2 | recount_qc_star_percent_reads_mapped_to_multiple_loci_both | Numeric | recount_qc_star_percent_reads_mapped_to_multiple_loci_both vs. PC2: r=-0.286; fdr=2.4e-02 | 0.0025561 | 0.0237980 |
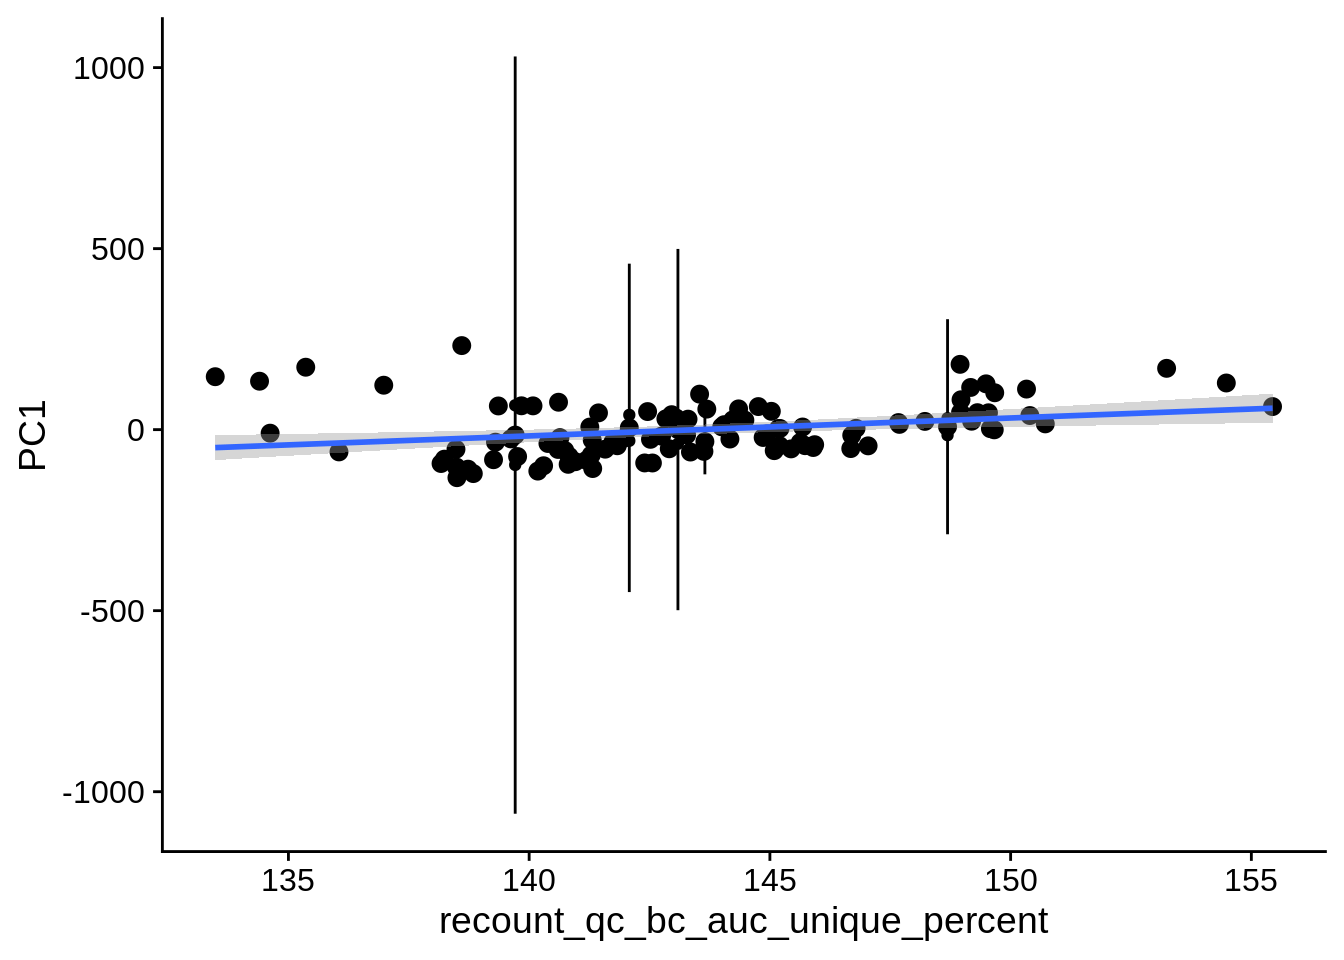
| PC1 | recount_qc_bc_auc_unique_percent | Numeric | recount_qc_bc_auc_unique_percent vs. PC1: r=0.277; fdr=3.2e-02 | 0.0036048 | 0.0324429 |
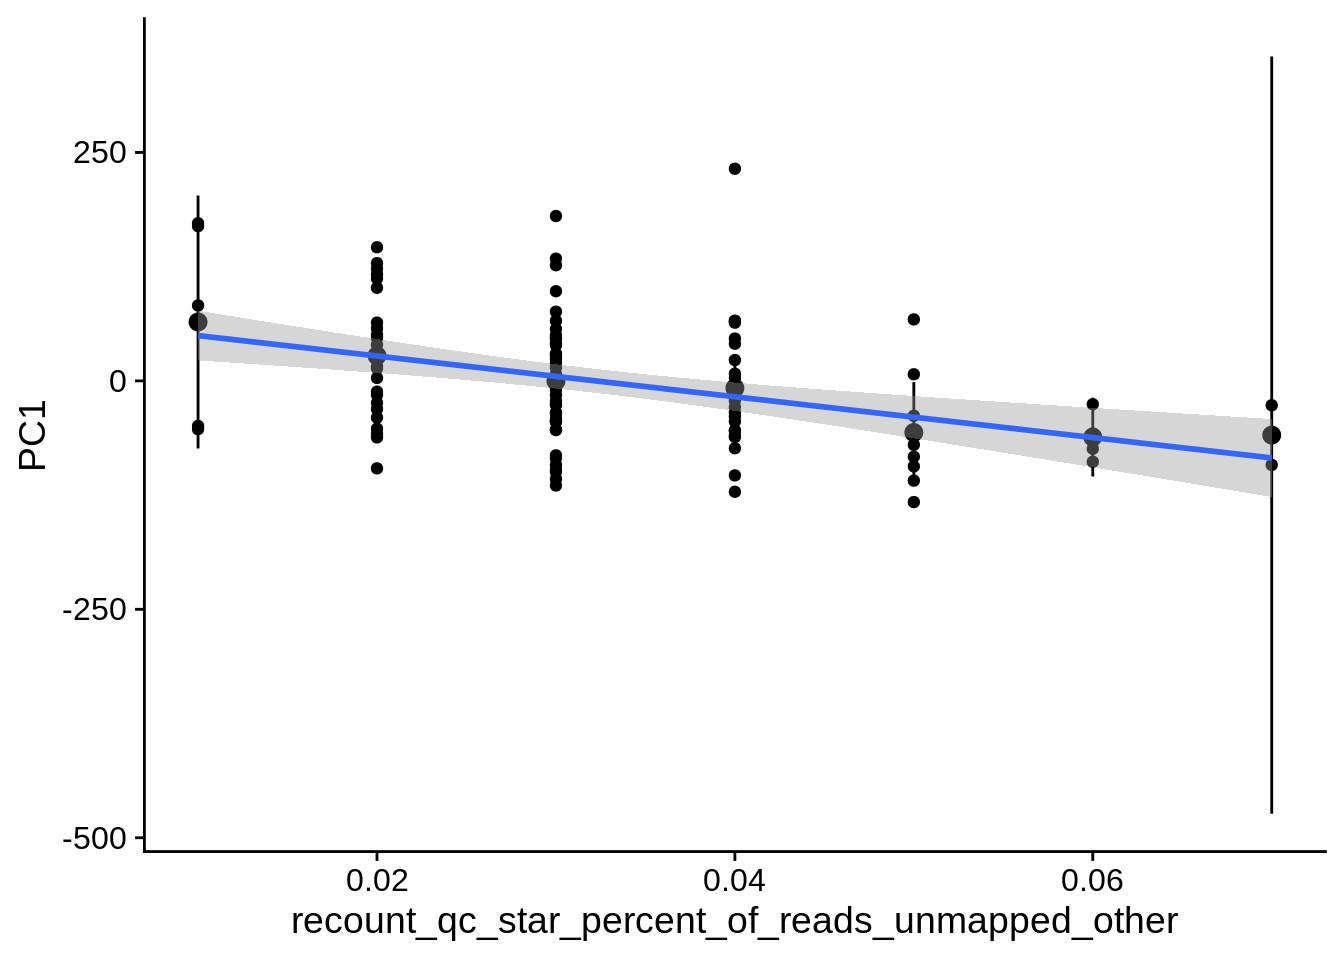
| PC1 | recount_qc_star_percent_of_reads_unmapped_other | Numeric | recount_qc_star_percent_of_reads_unmapped_other vs. PC1: r=-0.274; fdr=3.4e-02 | 0.0038764 | 0.0337622 |
| PC1 | recount_qc_star_percent_reads_unmapped_other_both | Numeric | recount_qc_star_percent_reads_unmapped_other_both vs. PC1: r=-0.273; fdr=3.4e-02 | 0.0040591 | 0.0342487 |
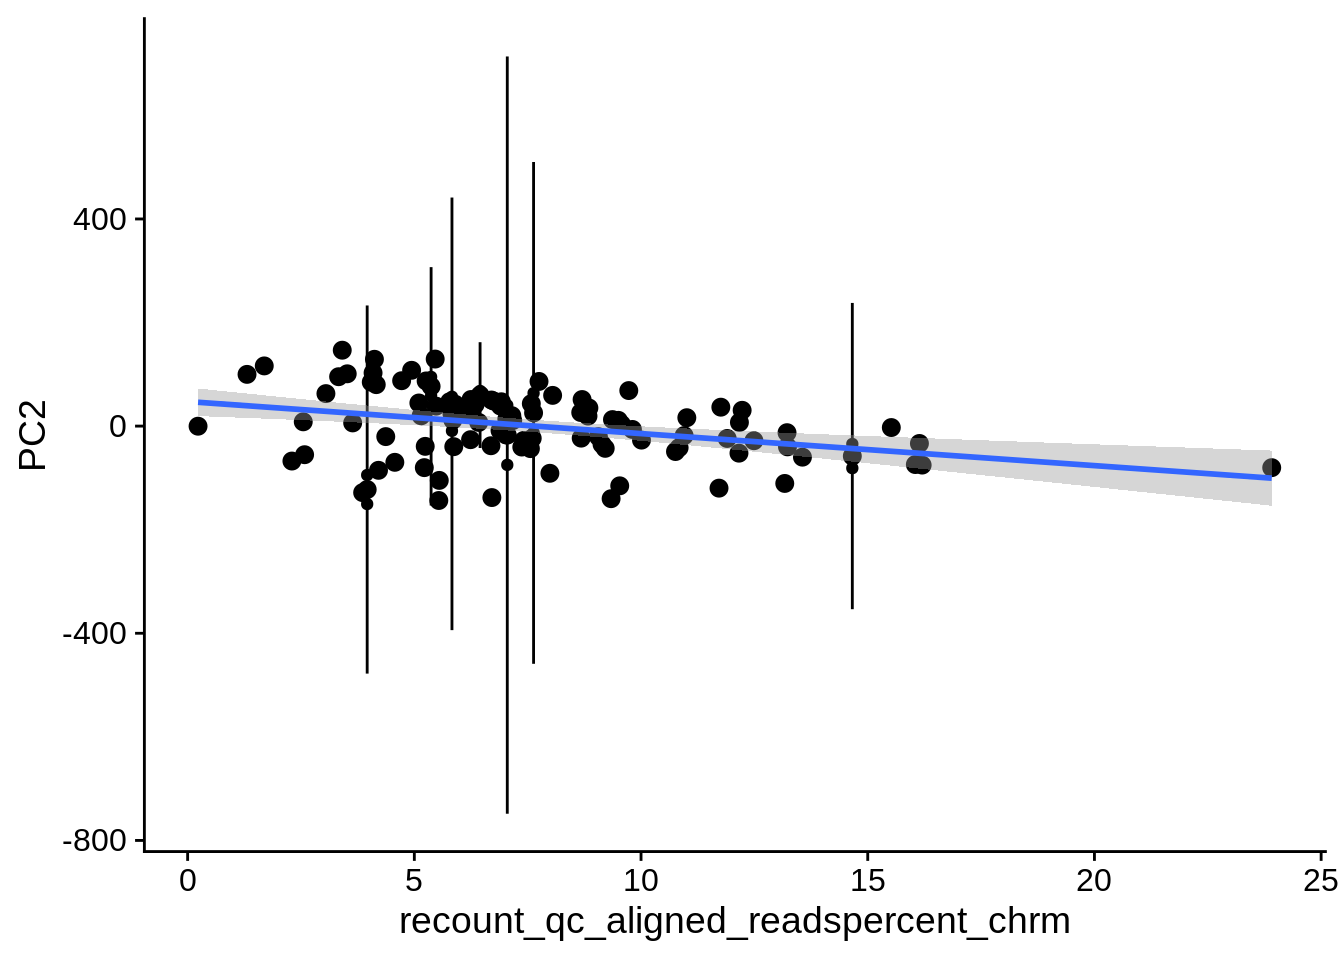
| PC2 | recount_qc_aligned_readspercent_chrm | Numeric | recount_qc_aligned_readspercent_chrm vs. PC2: r=-0.267; fdr=4.1e-02 | 0.0050544 | 0.0413540 |
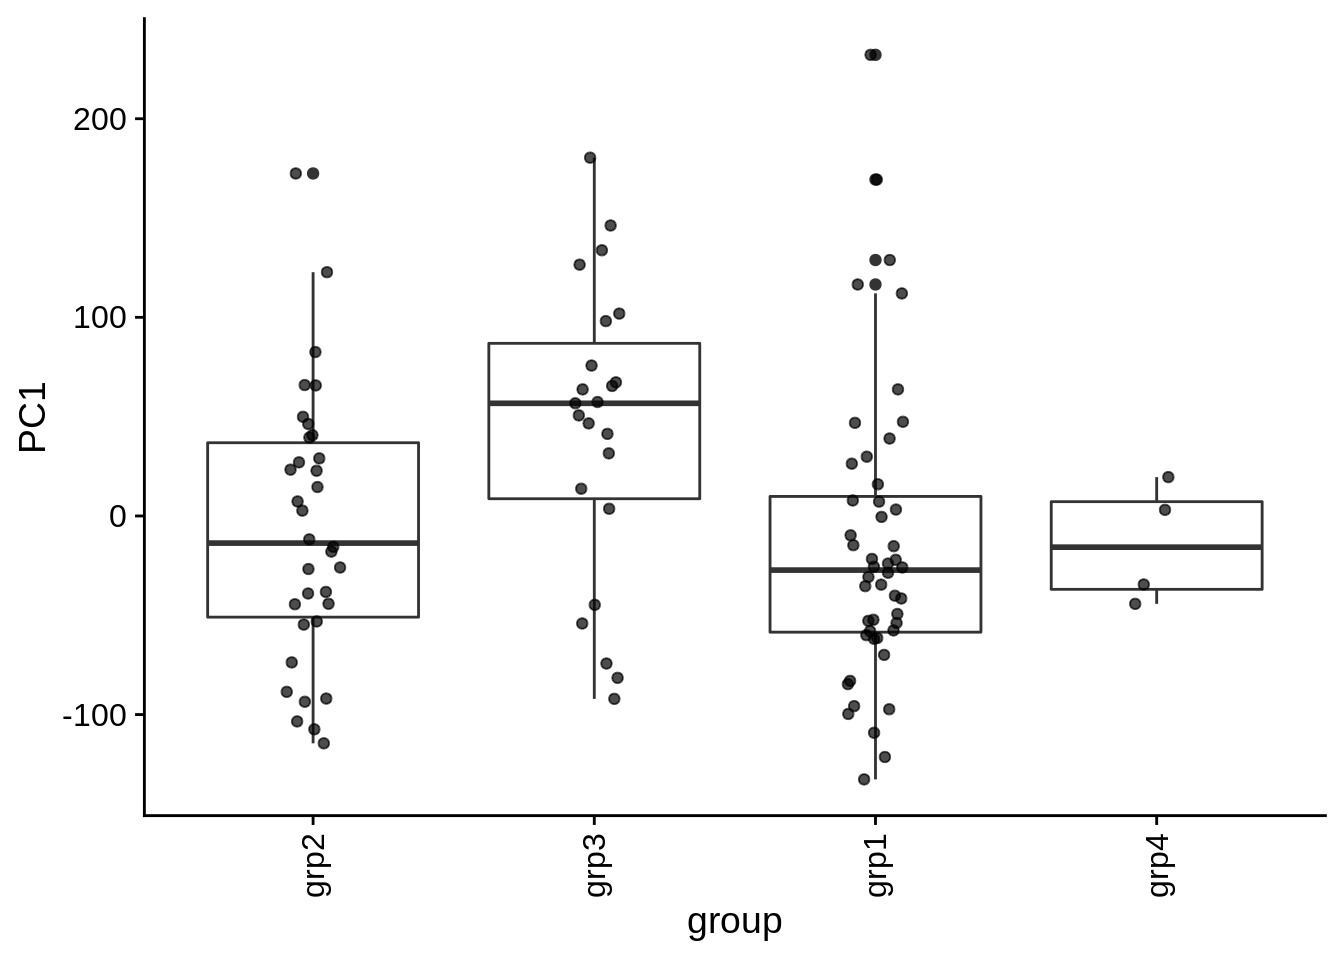
| PC1 | group | Categorical | group vs. PC1 ANOVA fdr: 4.9e-02 | 0.0121922 | 0.0487687 |
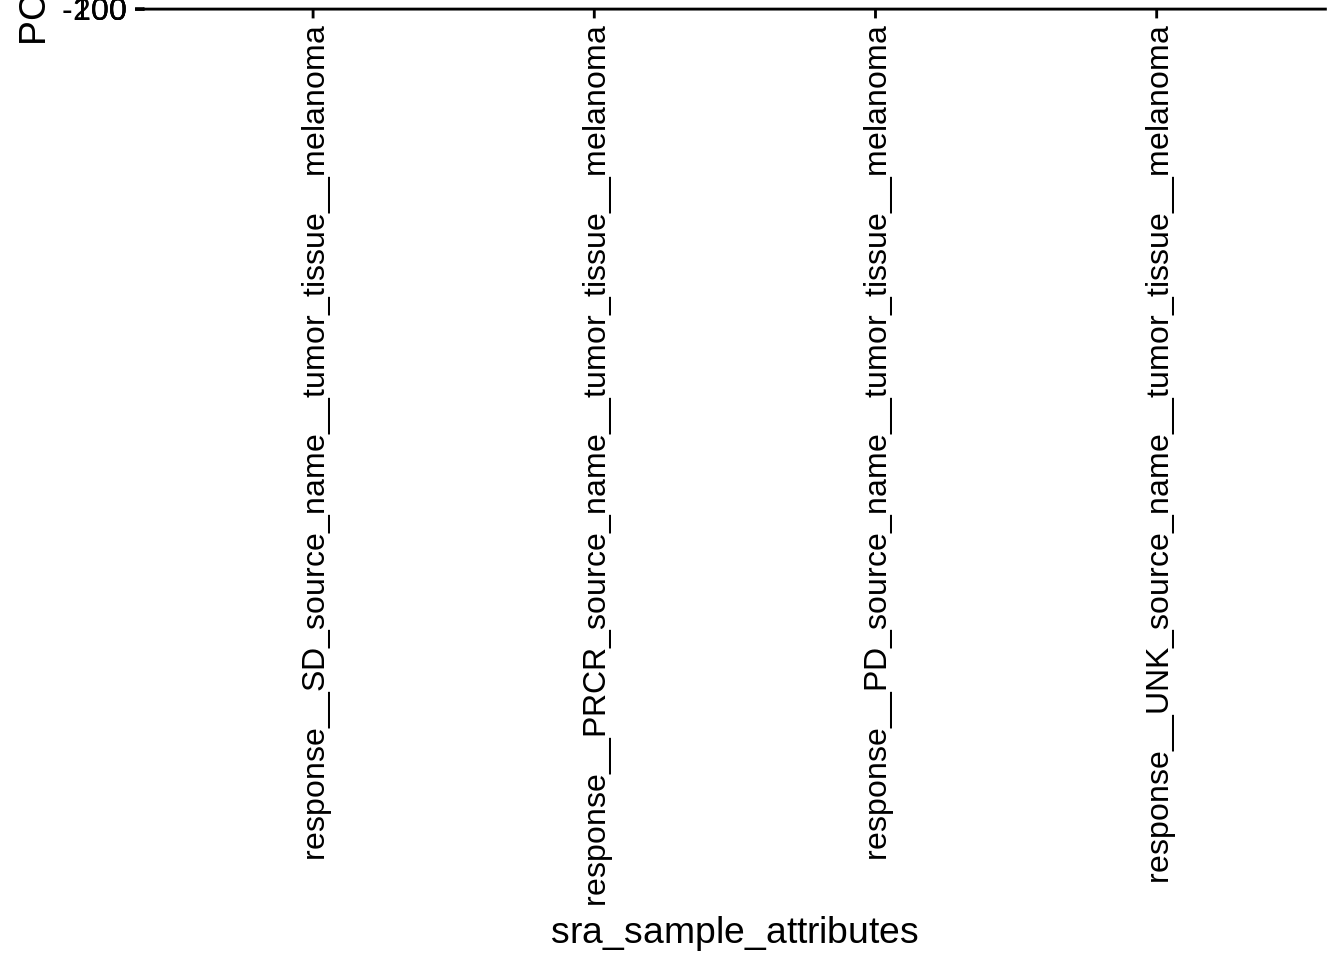
| PC1 | sra_sample_attributes | Categorical | sra_sample_attributes vs. PC1 ANOVA fdr: 4.9e-02 | 0.0121922 | 0.0487687 |
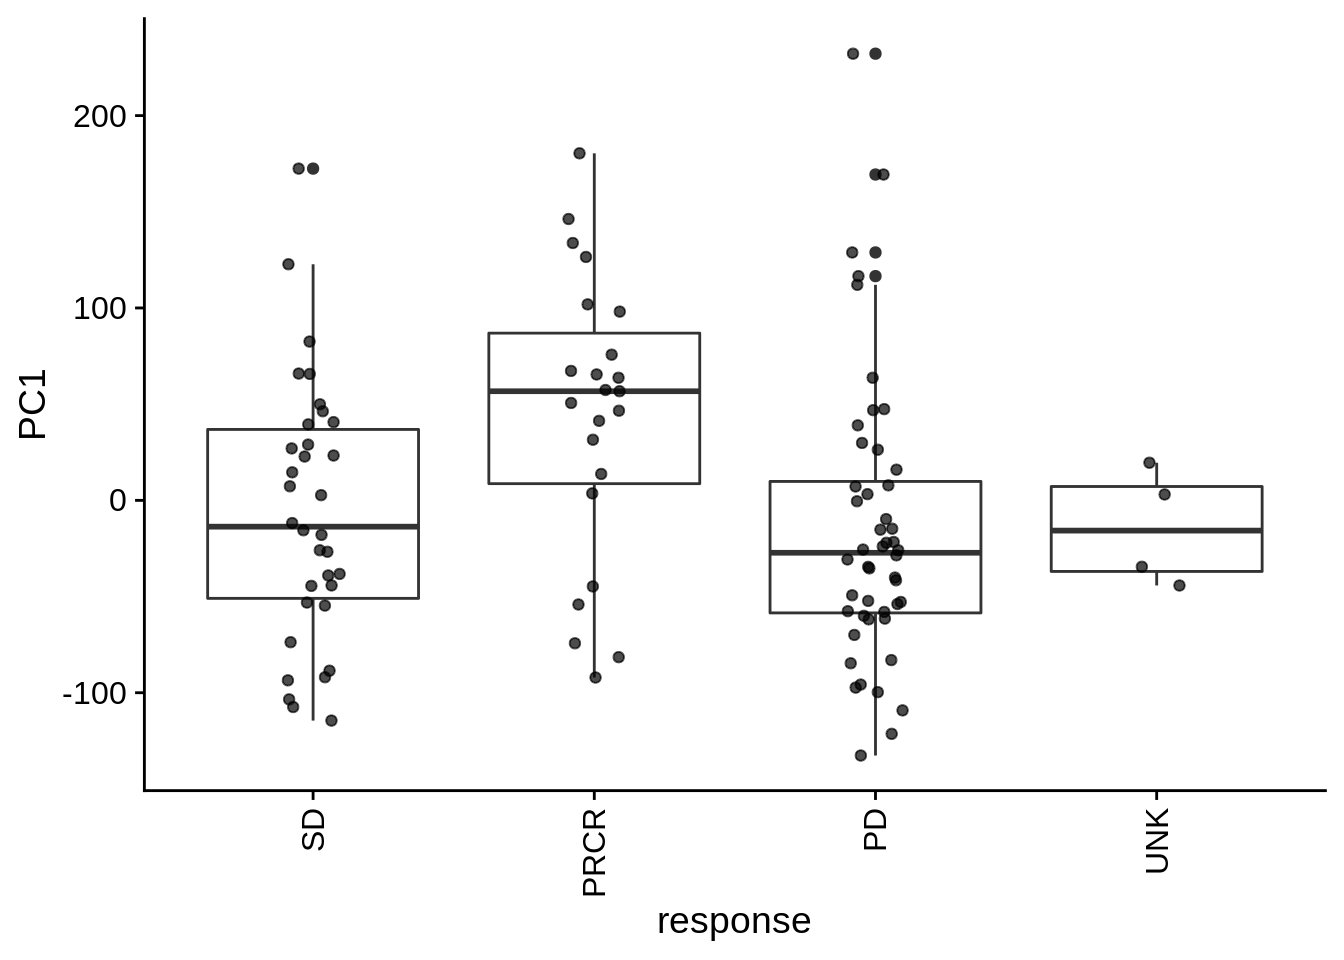
| PC1 | response | Categorical | response vs. PC1 ANOVA fdr: 4.9e-02 | 0.0121922 | 0.0487687 |
| PC2 | recount_qc_junction_count | Numeric | recount_qc_junction_count vs. PC2: r=0.256; fdr=5.7e-02 | 0.0072009 | 0.0571834 |
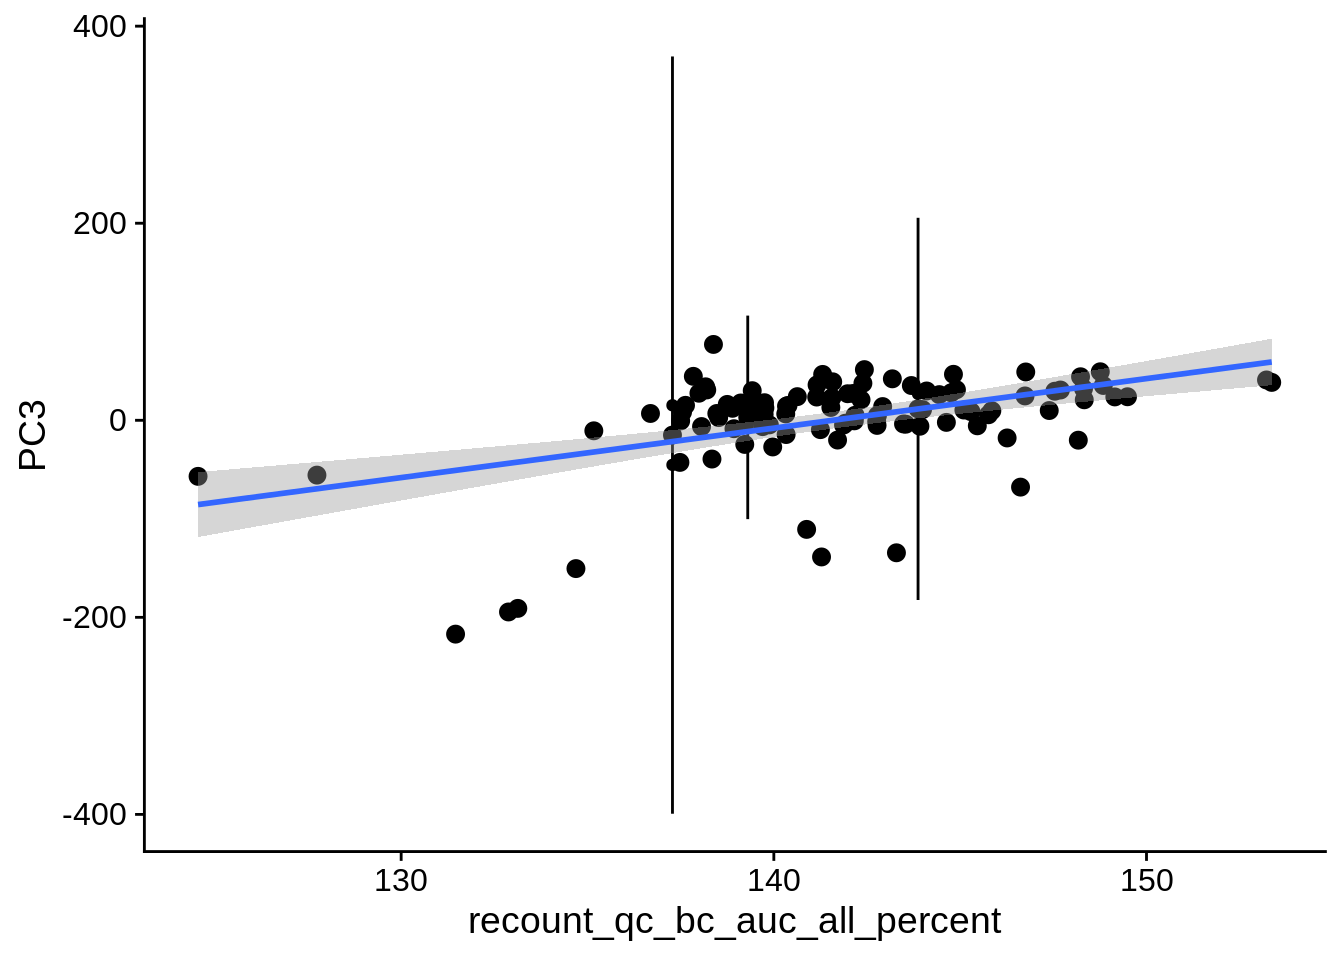
| PC3 | recount_qc_bc_auc_all_percent | Numeric | recount_qc_bc_auc_all_percent vs. PC3: r=0.255; fdr=5.8e-02 | 0.0075149 | 0.0578633 |
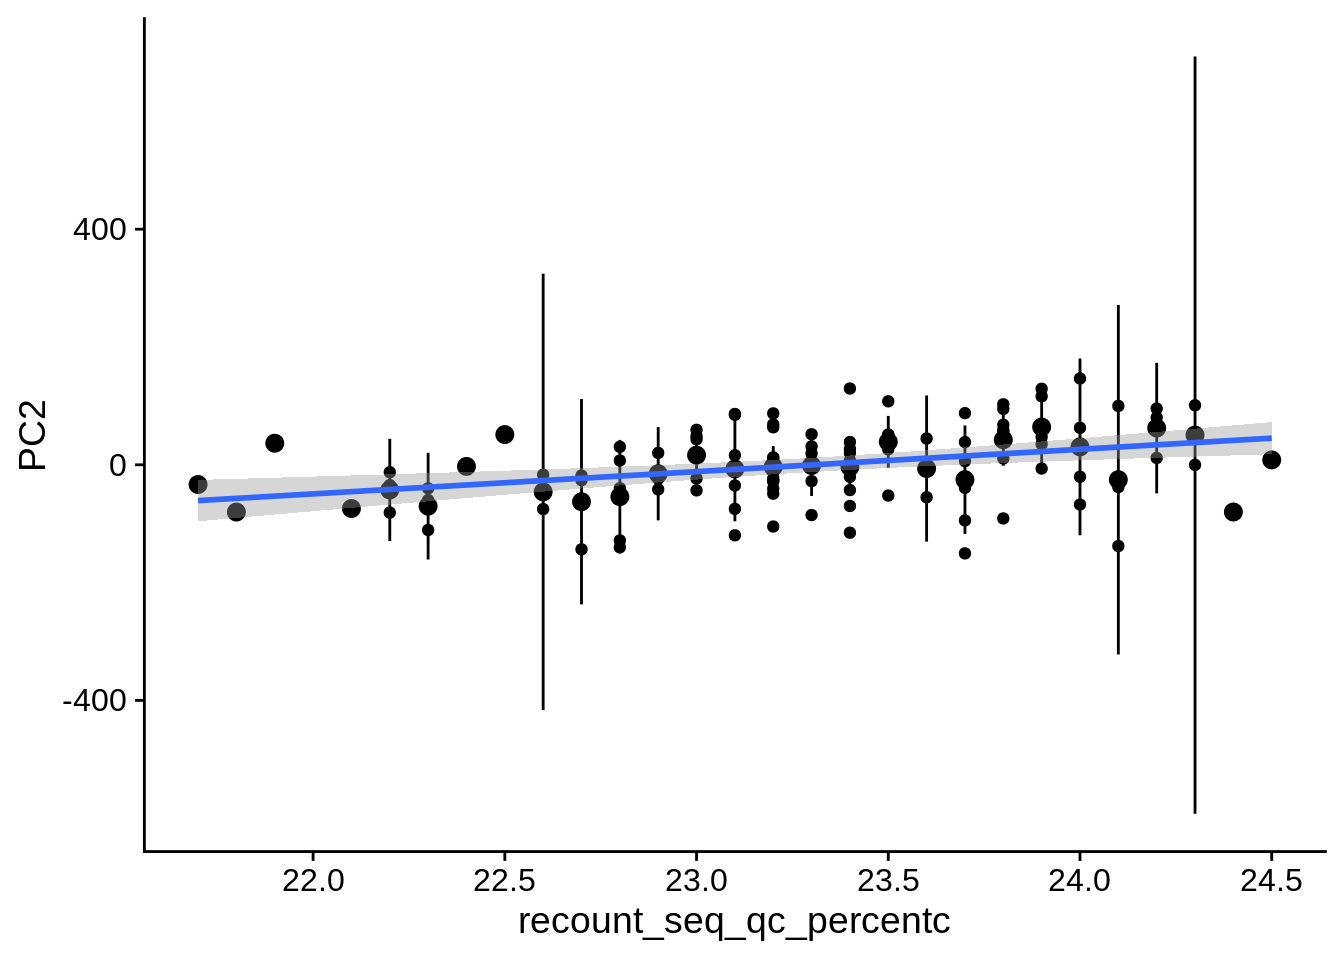
| PC2 | recount_seq_qc_percentc | Numeric | recount_seq_qc_percentc vs. PC2: r=0.254; fdr=5.8e-02 | 0.0077151 | 0.0578633 |
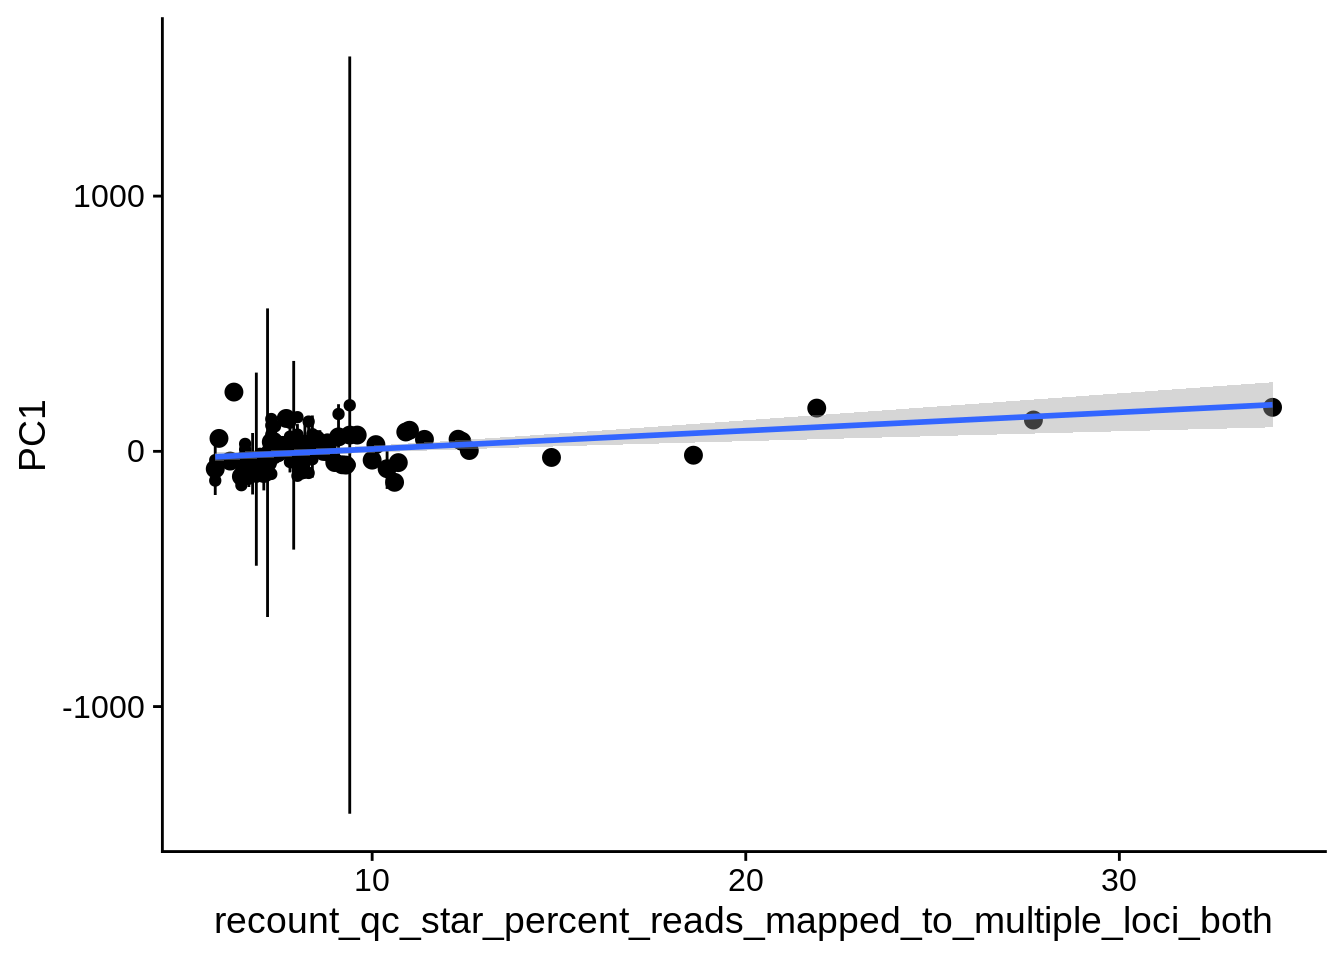
| PC1 | recount_qc_star_percent_reads_mapped_to_multiple_loci_both | Numeric | recount_qc_star_percent_reads_mapped_to_multiple_loci_both vs. PC1: r=0.25; fdr=6.1e-02 | 0.0086196 | 0.0612446 |
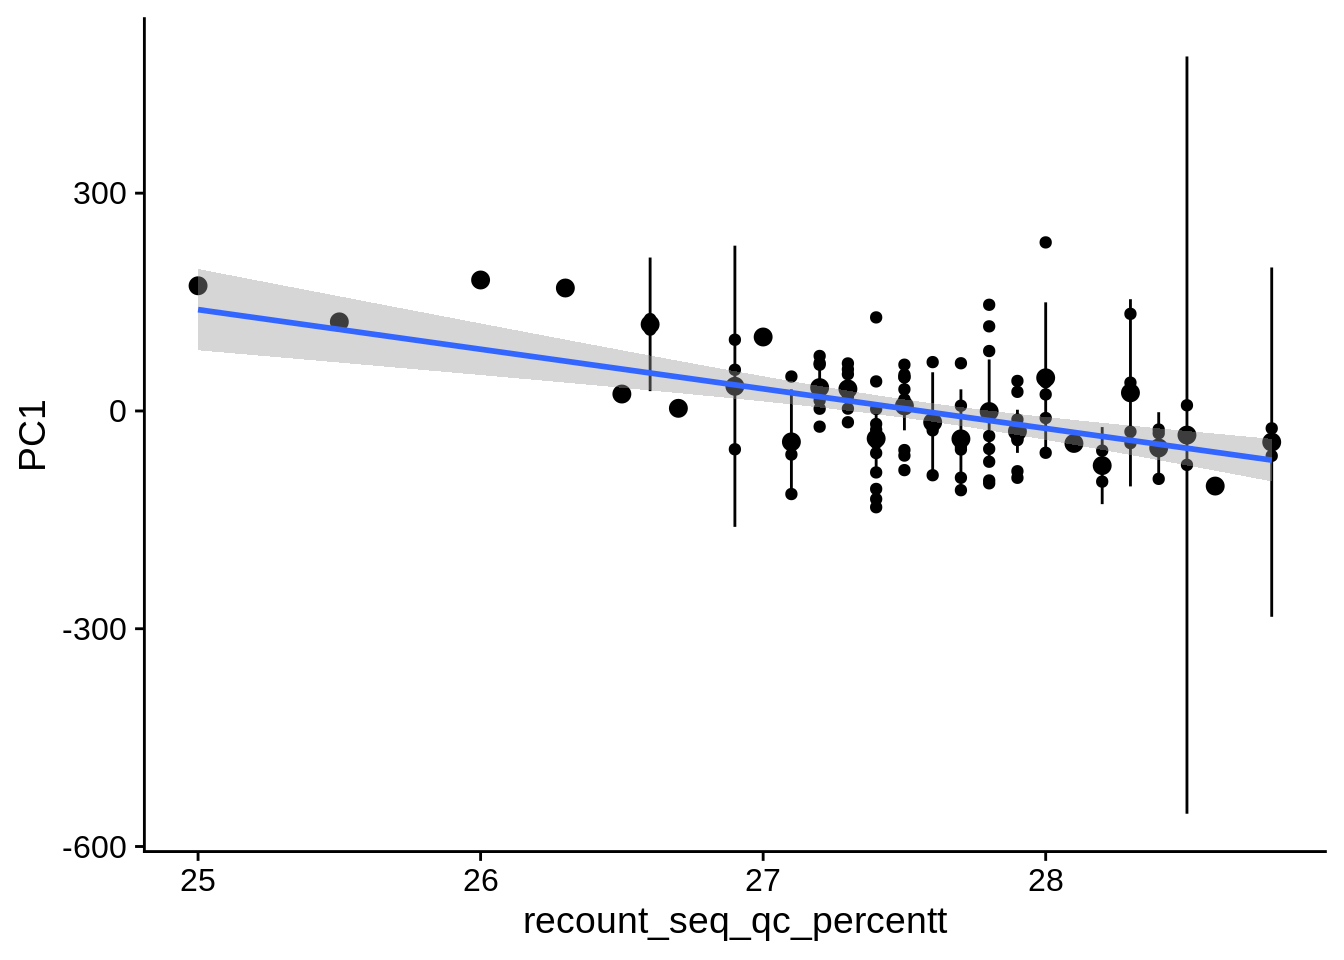
| PC1 | recount_seq_qc_percentt | Numeric | recount_seq_qc_percentt vs. PC1: r=-0.251; fdr=6.1e-02 | 0.0085142 | 0.0612446 |
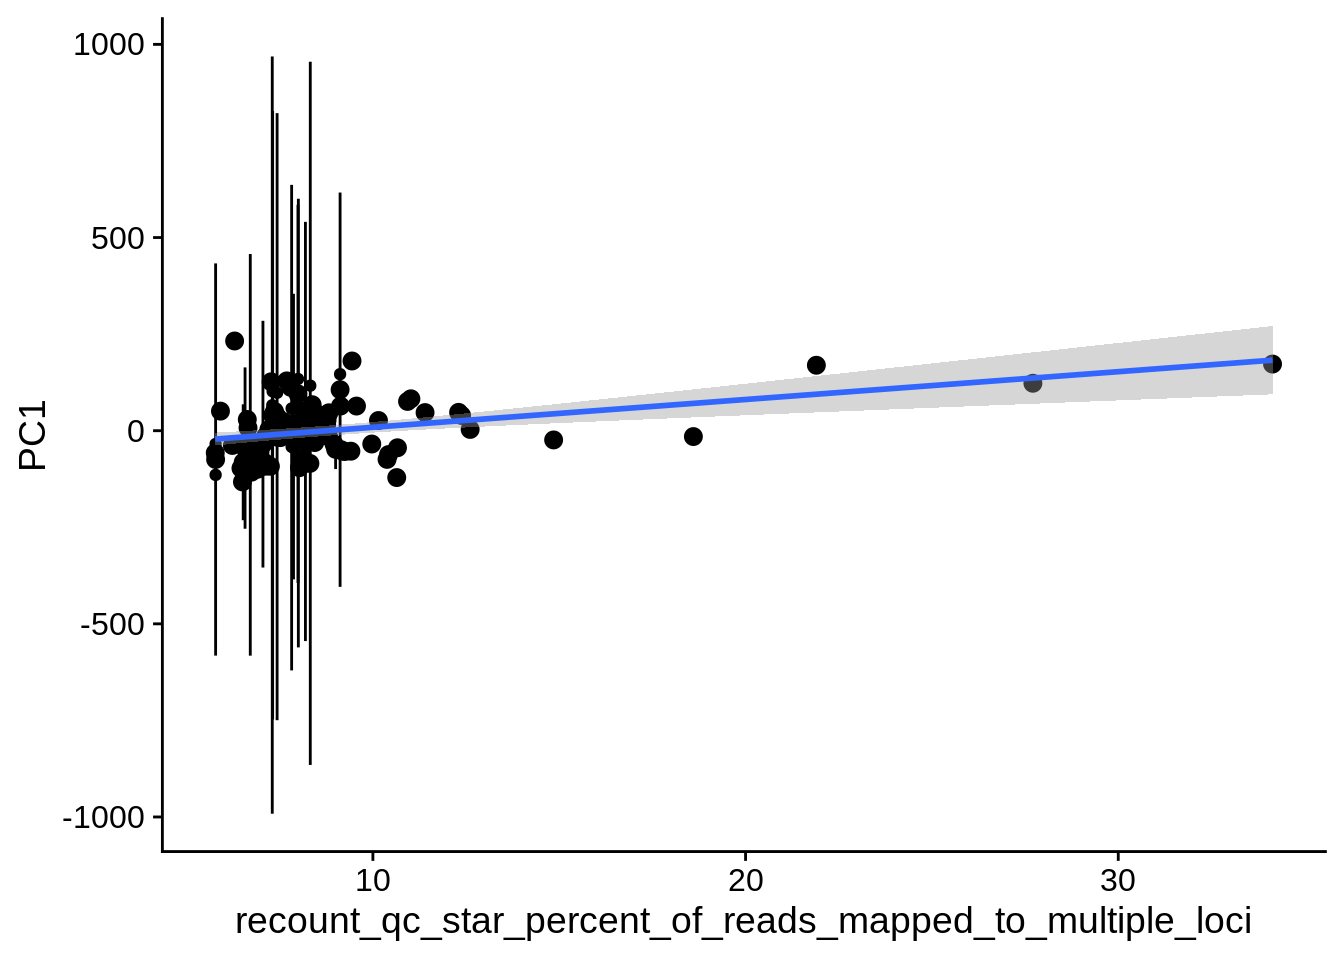
| PC1 | recount_qc_star_percent_of_reads_mapped_to_multiple_loci | Numeric | recount_qc_star_percent_of_reads_mapped_to_multiple_loci vs. PC1: r=0.247; fdr=6.4e-02 | 0.0096109 | 0.0639623 |
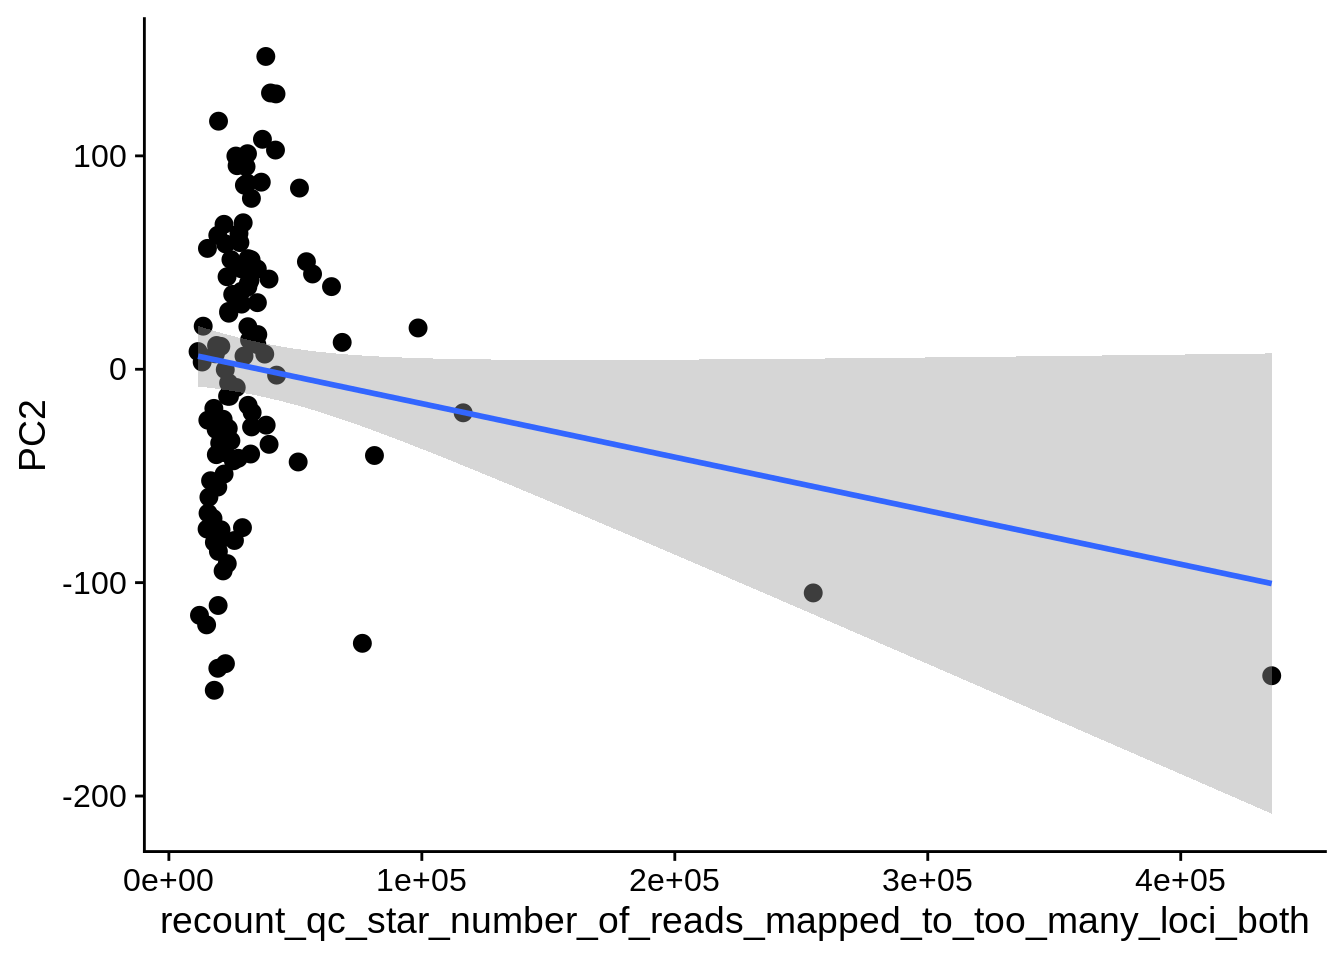
| PC2 | recount_qc_star_number_of_reads_mapped_to_too_many_loci | Numeric | recount_qc_star_number_of_reads_mapped_to_too_many_loci vs. PC2: r=0.247; fdr=6.4e-02 | 0.0097128 | 0.0639623 |
| PC2 | recount_qc_star_number_of_reads_mapped_to_too_many_loci_both | Numeric | recount_qc_star_number_of_reads_mapped_to_too_many_loci_both vs. PC2: r=0.247; fdr=6.4e-02 | 0.0097128 | 0.0639623 |
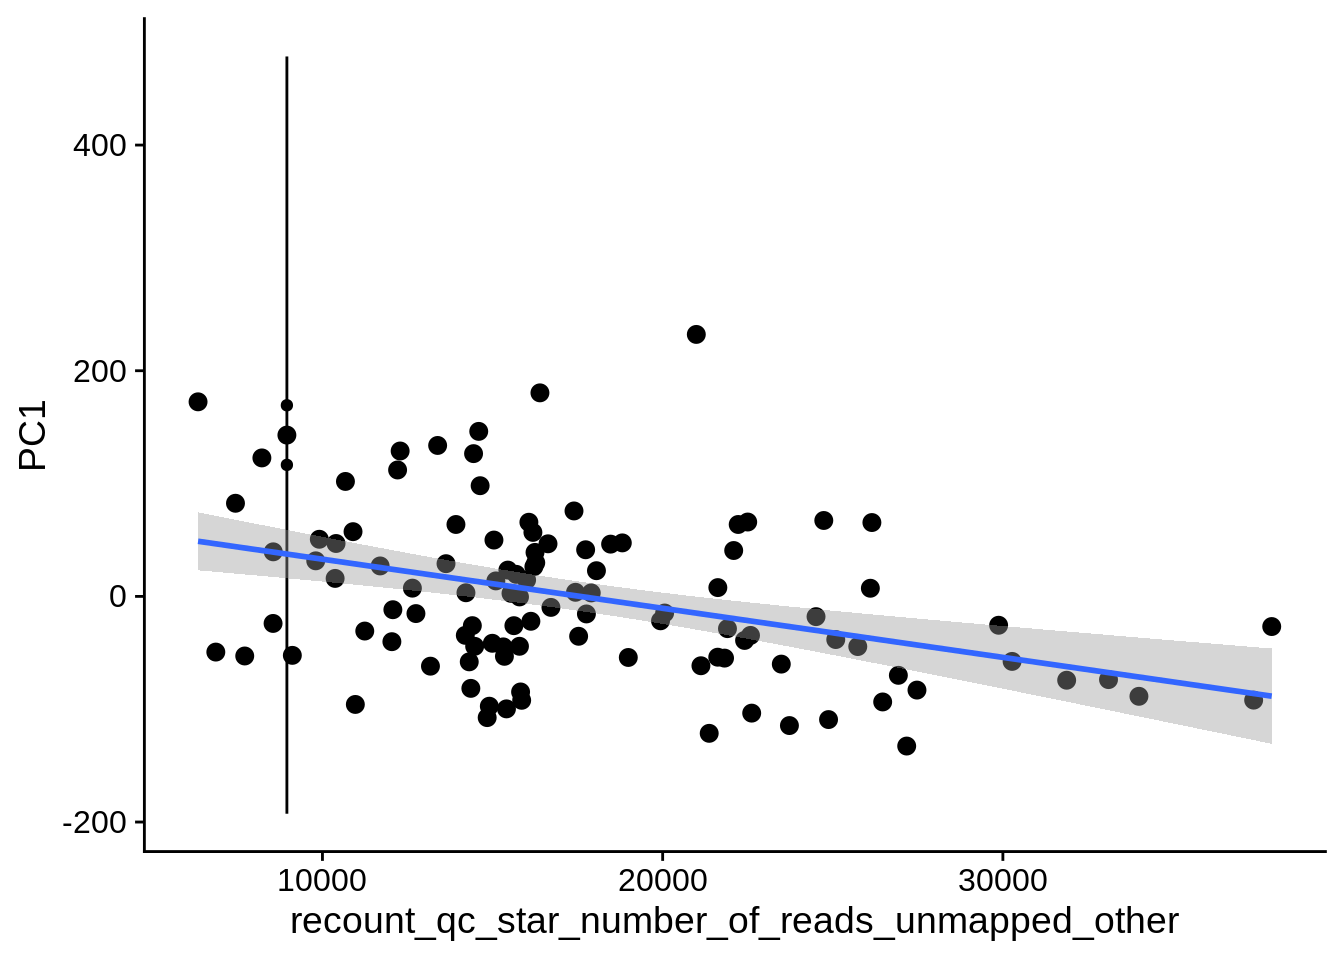
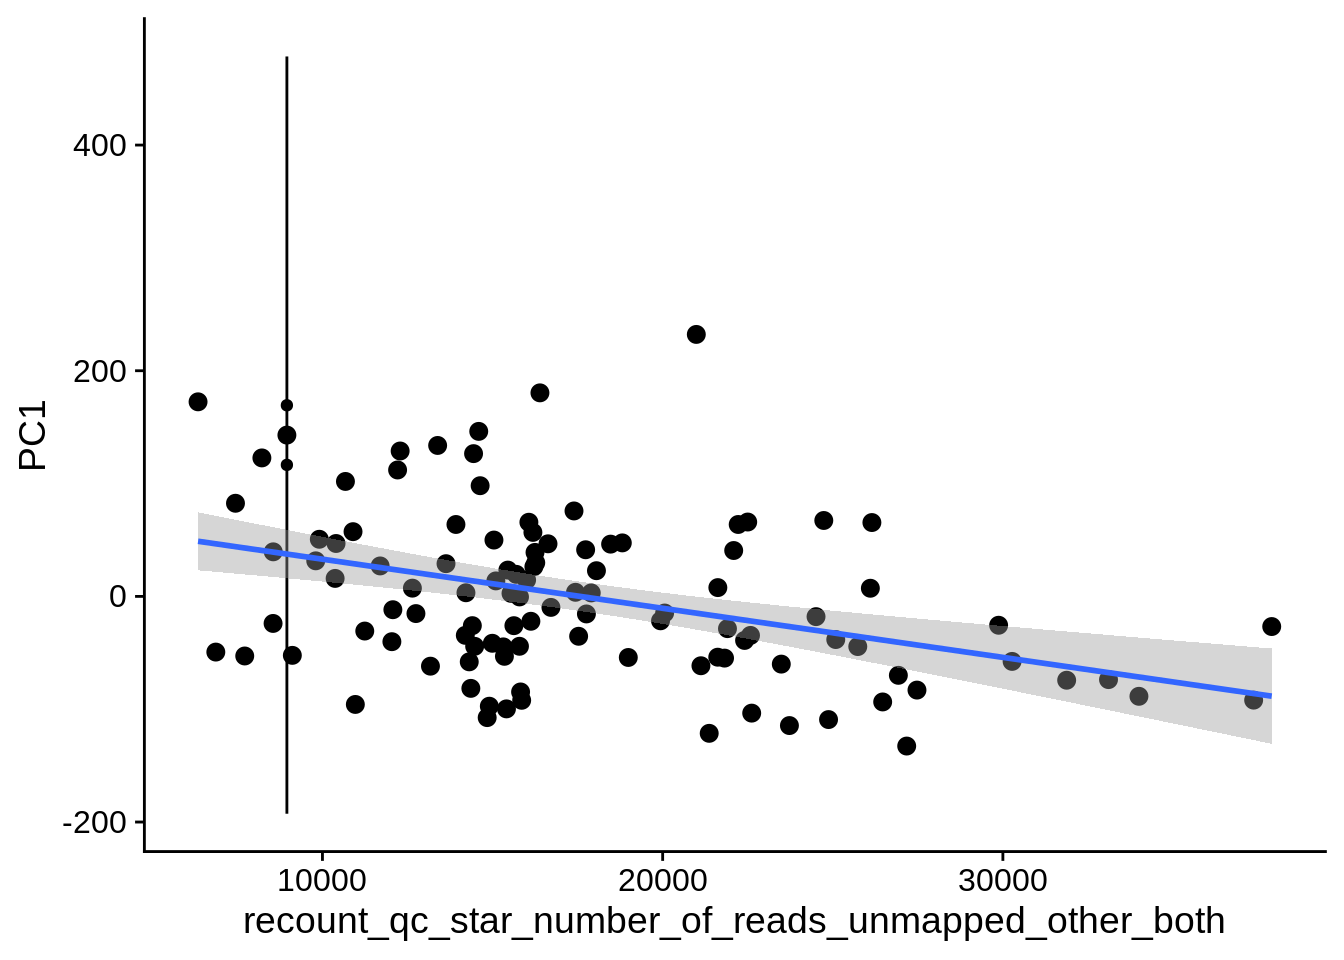
| PC1 | recount_qc_star_number_of_reads_unmapped_other | Numeric | recount_qc_star_number_of_reads_unmapped_other vs. PC1: r=-0.244; fdr=6.7e-02 | 0.0106223 | 0.0666982 |
| PC1 | recount_qc_star_number_of_reads_unmapped_other_both | Numeric | recount_qc_star_number_of_reads_unmapped_other_both vs. PC1: r=-0.244; fdr=6.7e-02 | 0.0106223 | 0.0666982 |
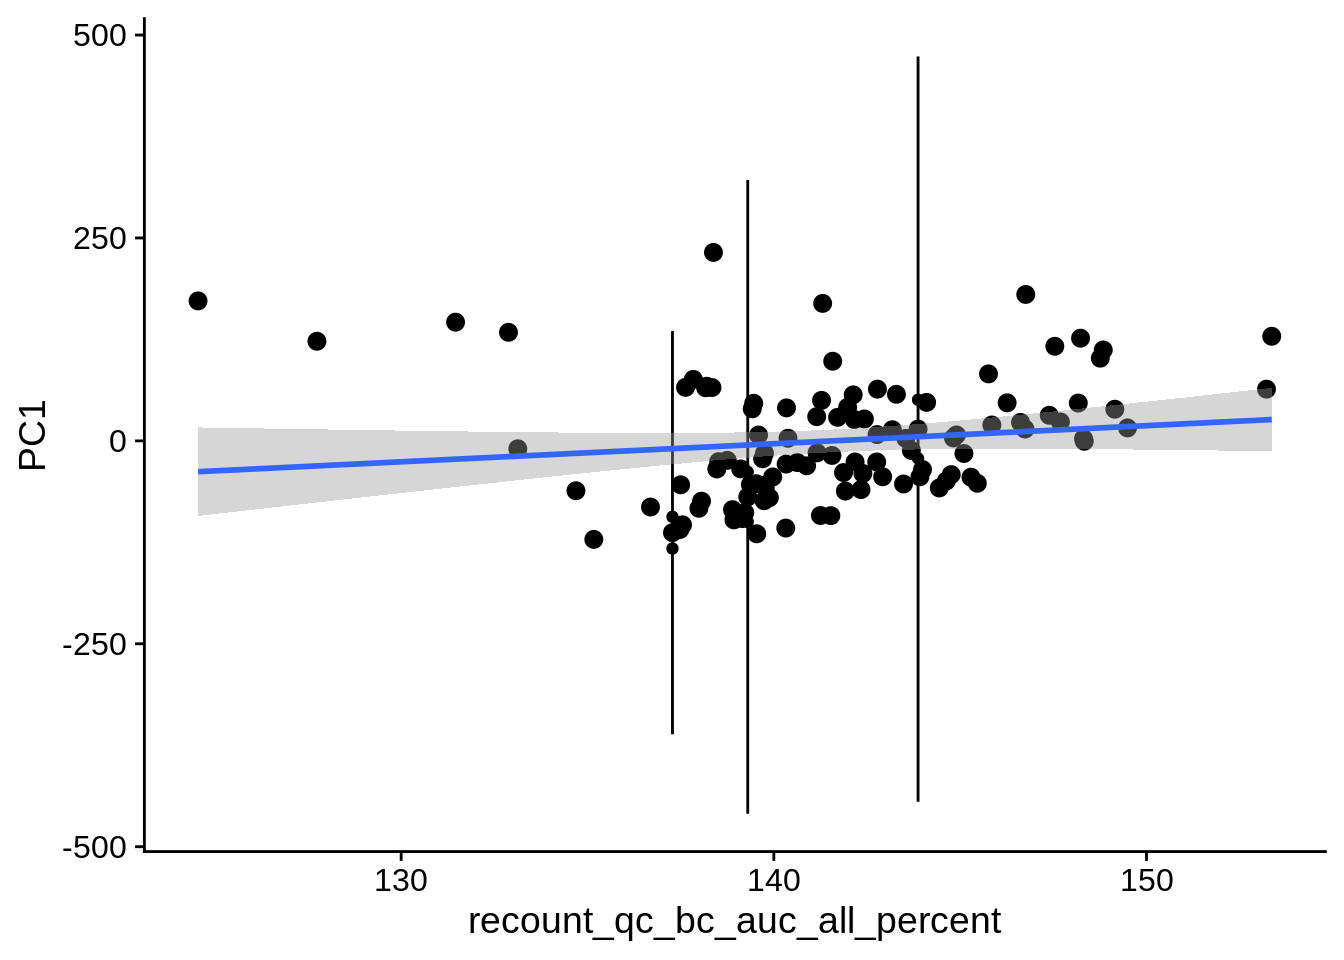
| PC1 | recount_qc_bc_auc_all_percent | Numeric | recount_qc_bc_auc_all_percent vs. PC1: r=0.229; fdr=9.8e-02 | 0.0164923 | 0.0975494 |
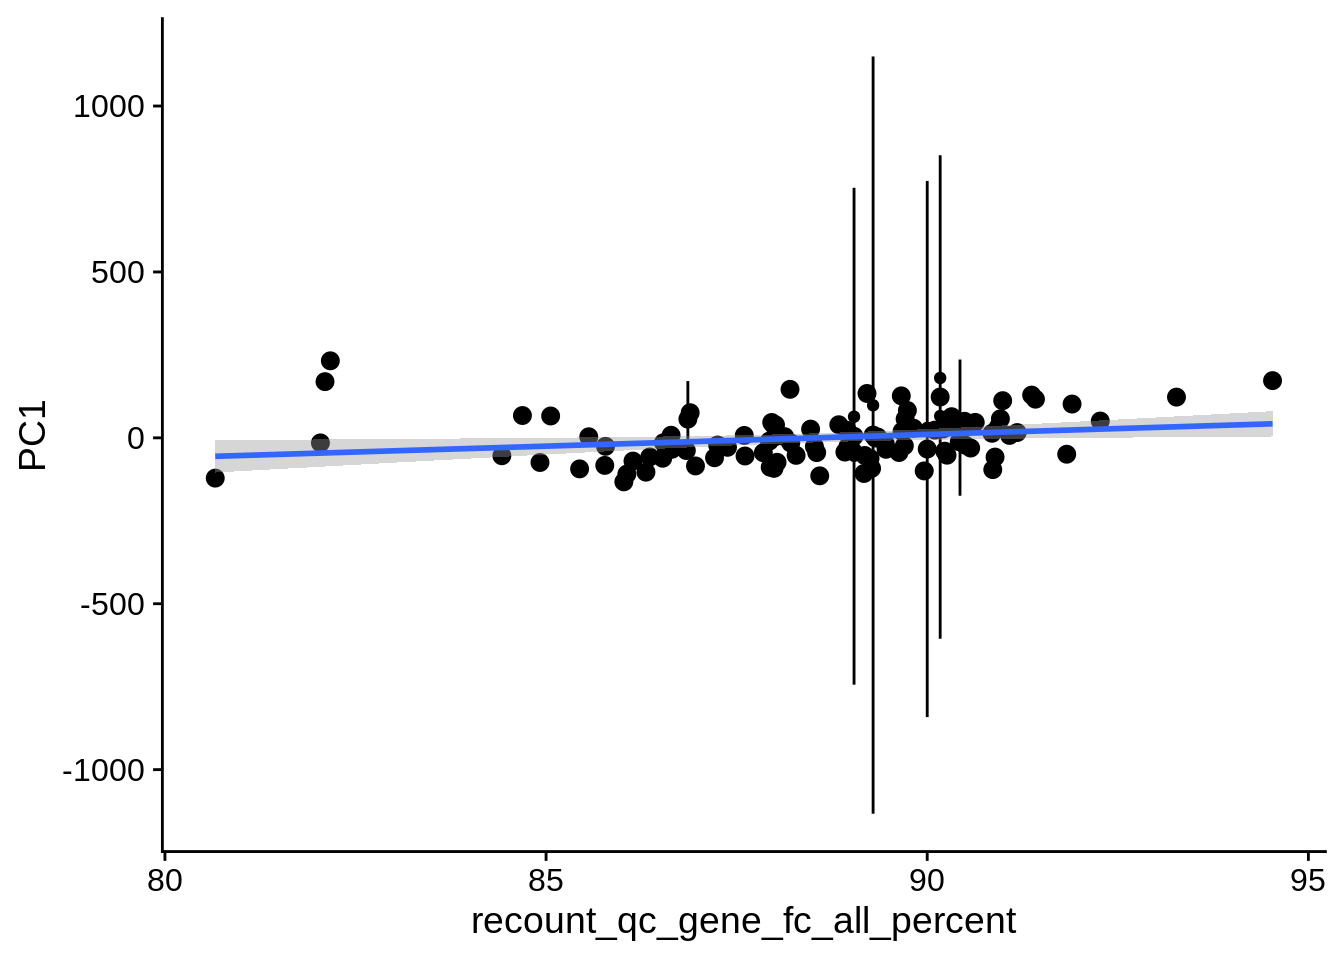
| PC1 | recount_qc_gene_fc_all_percent | Numeric | recount_qc_gene_fc_all_percent vs. PC1: r=0.23; fdr=9.8e-02 | 0.0159684 | 0.0975494 |
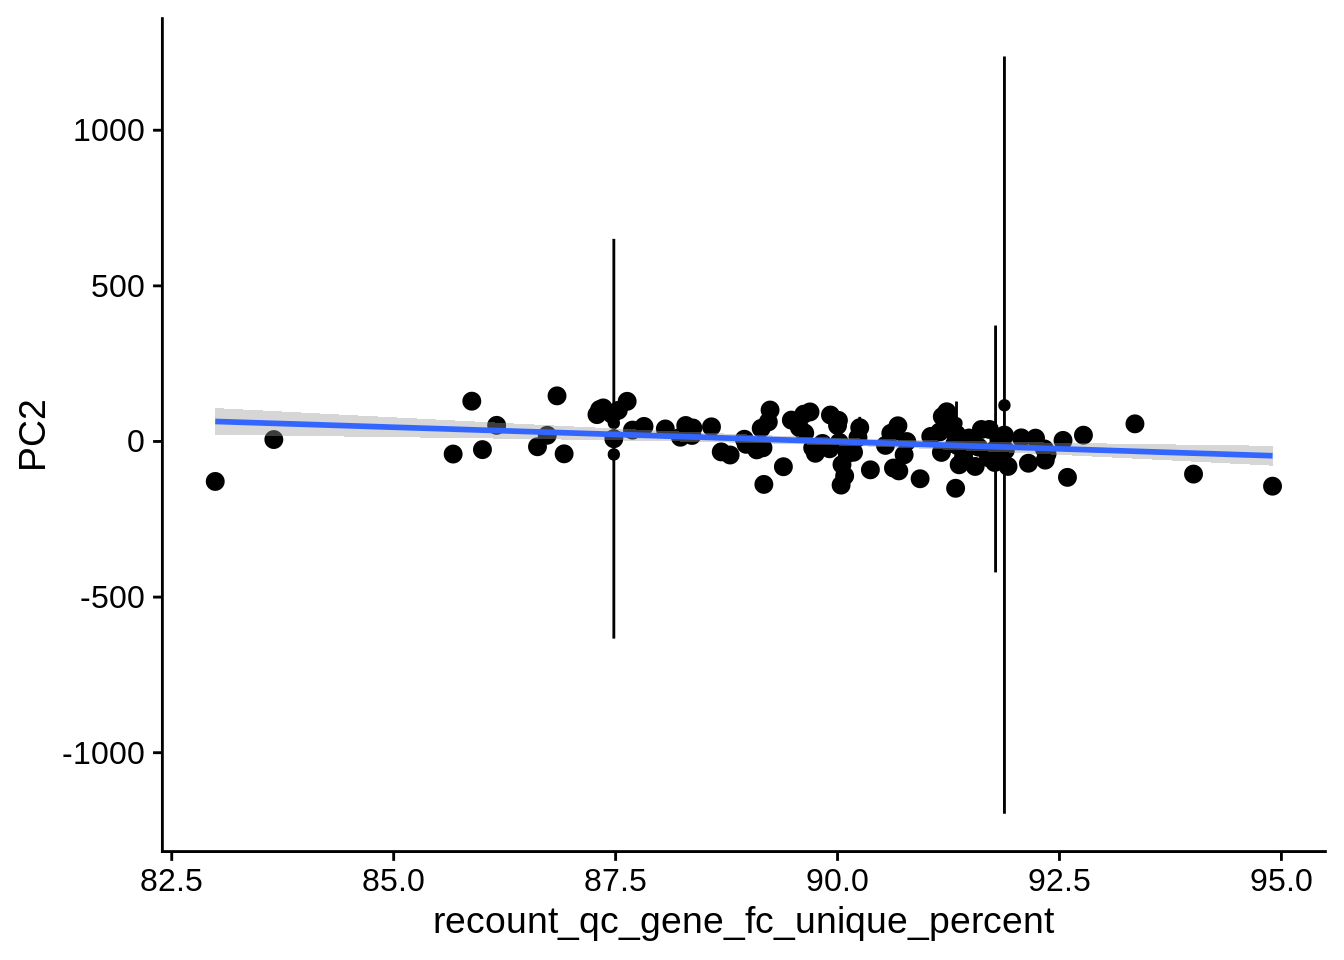
| PC2 | recount_qc_gene_fc_unique_percent | Numeric | recount_qc_gene_fc_unique_percent vs. PC2: r=-0.229; fdr=9.8e-02 | 0.0166195 | 0.0975494 |
2.2 Plots of significant covariates
Loop through the significant covariates and product all plots.