Chapter 3 Supplemental Tables
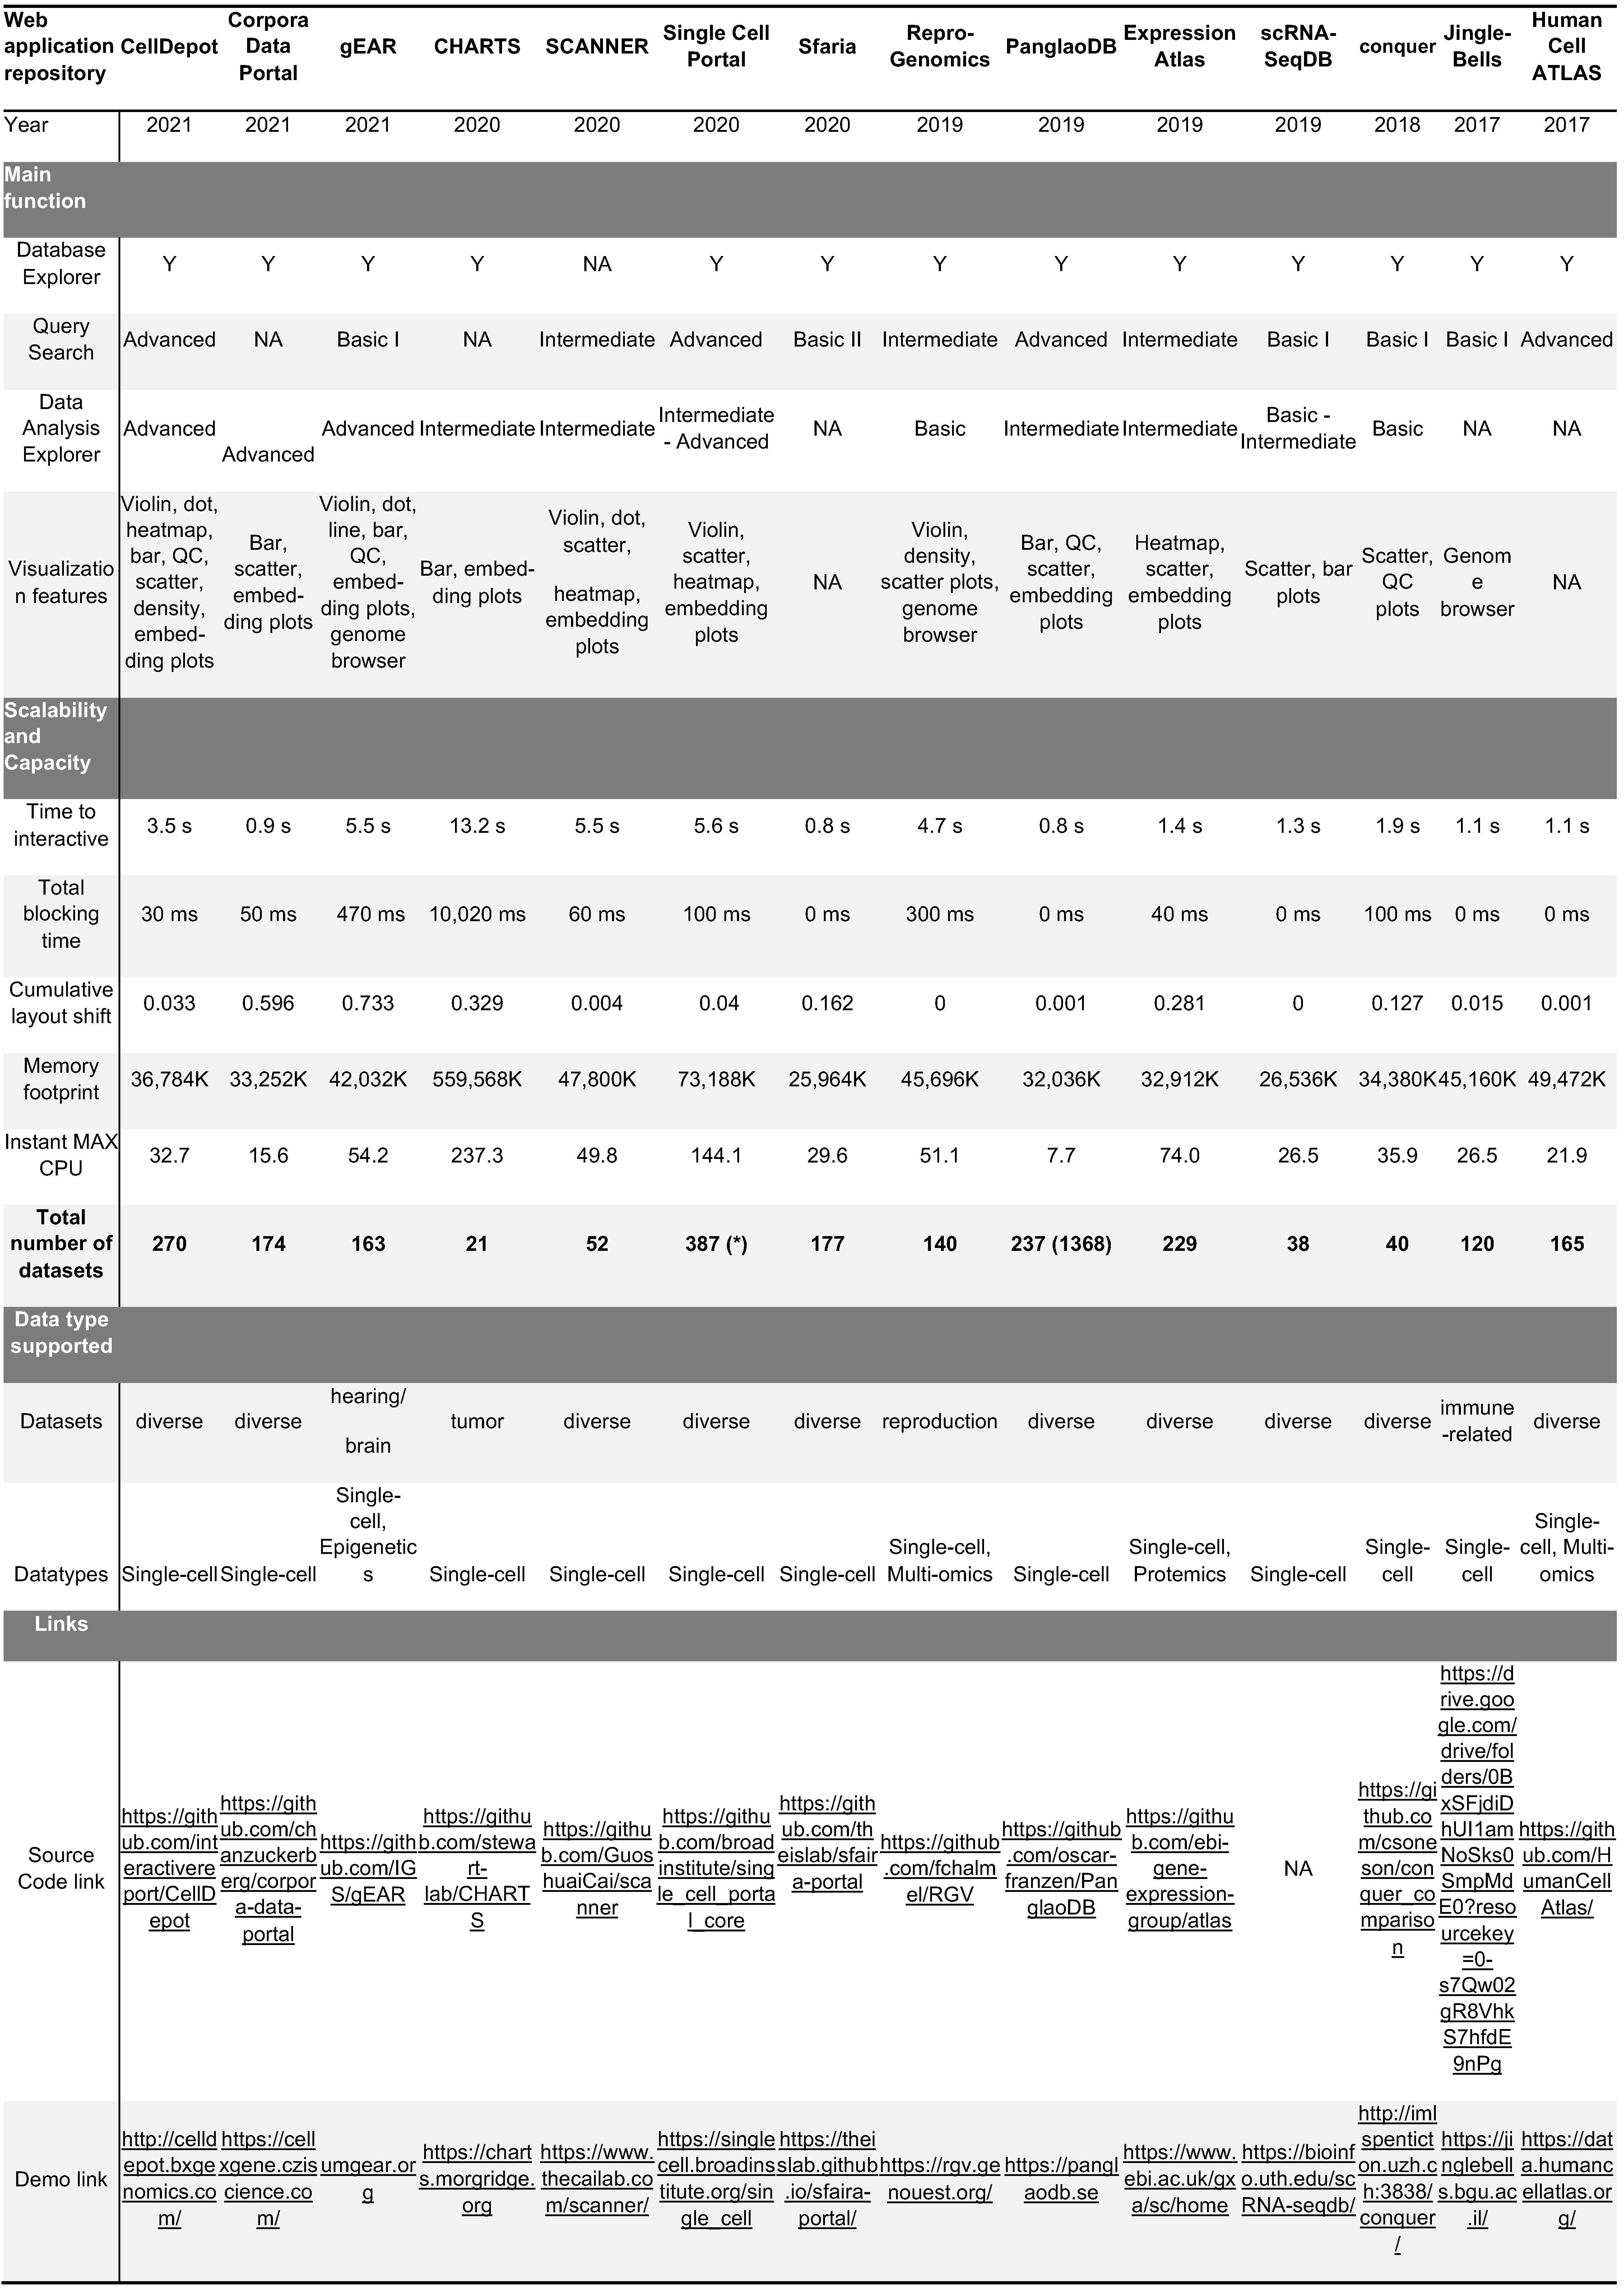
Table S1 - Comparison matrix of web portal tools
Table link: https://github.com/interactivereport/CellDepot/blob/gh-pages/bookdown/S1.csv| Web.application.repository | CellDepot | Corpora.Data.Portal | gEAR | CHARTS | SCANNER | Single.Cell.Portal | Sfaria | Repro.Genomics | PanglaoDB | Expression.Atlas | scRNA.SeqDB | conquer | Jingle.Bells | Human.Cell.ATLAS |
|---|---|---|---|---|---|---|---|---|---|---|---|---|---|---|
| Year | 2021 | 2021 | 2021 | 2020 | 2020 | 2020 | 2020 | 2019 | 2019 | 2019 | 2019 | 2018 | 2017 | 2017 |
| Main function | ||||||||||||||
| Database Explorer | Y | Y | Y | Y | NA | Y | Y | Y | Y | Y | Y | Y | Y | Y |
| Query Search | Advanced | NA | Basic I | NA | Intermediate | Advanced | Basic II | Intermediate | Advanced | Intermediate | Basic I | Basic I | Basic I | Advanced |
| Data Analysis Explorer | Advanced | Advanced | Advanced | Intermediate | Intermediate | Intermediate - Advanced | NA | Basic | Intermediate | Intermediate | Basic - Intermediate | Basic | NA | NA |
| Visualization features | Violin, dot, heatmap, bar, QC, scatter, density, embed-ding plots | Bar, scatter, embed-ding plots | Violin, dot, line, bar, QC, embed-ding plots, genome browser | Bar, embed-ding plots | Violin, dot, scatter,heatmap, embedding plots | Violin, scatter, heatmap, embedding plots | NA | Violin, density, scatter plots, genome browser | Bar, QC, scatter, embedding plots | Heatmap, scatter, embedding plots | Scatter, bar plots | Scatter, QC plots | Genome browser | NA |
| Scalability and Capacity | ||||||||||||||
| Time to interactive | 3.5 s | 0.9 s | 5.5 s | 13.2 s | 5.5 s | 5.6 s | 0.8 s | 4.7 s | 0.8 s | 1.4 s | 1.3 s | 1.9 s | 1.1 s | 1.1 s |
| Total blocking time | 30 ms | 50 ms | 470 ms | 10,020 ms | 60 ms | 100 ms | 0 ms | 300 ms | 0 ms | 40 ms | 0 ms | 100 ms | 0 ms | 0 ms |
| Cumulative layout shift | 0.033 | 0.596 | 0.733 | 0.329 | 0.004 | 0.04 | 0.162 | 0 | 0.001 | 0.281 | 0 | 0.127 | 0.015 | 0.001 |
| Memory footprint | 36,784K | 33,252K | 42,032K | 559,568K | 47,800K | 73,188K | 25,964K | 45,696K | 32,036K | 32,912K | 26,536K | 34,380K | 45,160K | 49,472K |
| Instant MAX CPU | 32.7 | 15.6 | 54.2 | 237.3 | 49.8 | 144.1 | 29.6 | 51.1 | 7.7 | 74 | 26.5 | 35.9 | 26.5 | 21.9 |
| Total number of datasets | 270 | 174 | 163 | 21 | 52 | 387 (*) | 177 | 140 | 237 (1368) | 229 | 38 | 40 | 120 | 165 |
| Data type supported | ||||||||||||||
| Datasets | diverse | diverse | hearing/brain | tumor | diverse | diverse | diverse | reproduction | diverse | diverse | diverse | diverse | immune-related | diverse |
| Datatypes | Single-cell | Single-cell | Single-cell, Epigenetics | Single-cell | Single-cell | Single-cell | Single-cell | Single-cell, Multi-omics | Single-cell | Single-cell, Protemics | Single-cell | Single-cell | Single-cell | Single-cell, Multi-omics |
| Links | ||||||||||||||
| Source Code link | https://github.com/interactivereport/CellDepot | https://github.com/chanzuckerberg/corpora-data-portal | https://github.com/IGS/gEAR | https://github.com/stewart-lab/CHARTS | https://github.com/GuoshuaiCai/scanner | https://github.com/broadinstitute/single_cell_portal_core | https://github.com/theislab/sfaira-portal | https://github.com/fchalmel/RGV | https://github.com/oscar-franzen/PanglaoDB | https://github.com/ebi-gene-expression-group/atlas | NA | https://github.com/csoneson/conquer_comparison | https://drive.google.com/drive/folders/0BxSFjdiDhUI1amNoSks0SmpMdE0?resourcekey=0-s7Qw02gR8VhkS7hfdE9nPg | https://github.com/HumanCellAtlas/ |
| Demo link | http://celldepot.bxgenomics.com/ | https://cellxgene.cziscience.com/ | umgear.org | https://charts.morgridge.org | https://www.thecailab.com/scanner/ | https://singlecell.broadinstitute.org/single_cell | https://theislab.github.io/sfaira-portal/ | https://rgv.genouest.org/ | https://panglaodb.se | https://www.ebi.ac.uk/gxa/sc/home | https://bioinfo.uth.edu/scRNA-seqdb/ | http://imlspenticton.uzh.ch:3838/conquer/ | https://jinglebells.bgu.ac.il/ | https://data.humancellatlas.org/ |
Note: The criteria for query search and data analysis explorer please see Table S2 and S3.
Table S2 - Criterion for query search
Table link: https://github.com/interactivereport/CellDepot/blob/gh-pages/bookdown/S2.csv| Query.Search | Keyword.Search | Multiple.Object.Search | Category.Filters |
|---|---|---|---|
| Basic S2 | Y | ||
| Basic II | Y | ||
| Intermediate | Y | Y | |
| Advanced | Y | Y | Y |
Table S3 - Criterion for data analysis explorer
Table link: https://github.com/interactivereport/CellDepot/blob/gh-pages/bookdown/S3.csv| Data.Analysis.Explorer | Analyze.scRNAseq.Data | Anaylze.Gene.Expression | Customize.Displays |
|---|---|---|---|
| Basic | Y | ||
| Intermediate | Y | Y | |
| Advanced | Y | Y | Y |
Table S4 - Project metadata captured in CellDepot
Table link: https://github.com/interactivereport/CellDepot/blob/gh-pages/bookdown/S4.csv| General.Category | Expected.Variable.Type | Description |
|---|---|---|
| Annotation Groups | String | categorical features from h5ad file |
| Cell Count | Integer | numbers of cell in study |
| Actions | Link | three options: 1) Study summary information; 2) Data visualization and analysis; 3) Update project information |
| Custom Accession | String | Customized accession name for individual project |
| Description | String | Additional information |
| DOI | Link | Digtial Object Identifier |
| File Name | String | h5ad file name |
| File Size | Integer | size of h5ad file |
| Gene Count | Integer | numbers of gene in study |
| Name | Link | project name |
| Notes | String | study notes |
| PMC ID | Link | |
| Publication Title | ||
| PubMed ID | Link | |
| Speices | String | |
| URL | Link | |
| Year | String |
